2066 | P a g e
Forecasting Optimised Tool wear, Surface Roughness,
Material Removal Rate and Hole Diameter Error on
OHNS in Drilling process through Scatter Search
Integrated Micro GA Algorithm
Dr.D.Ramalingam*
1, R.RinuKaarthikeyen
2, Dr.S.Muthu
3, Dr.V.Sankar
4*
1Associate Professor, Nehru Institute of Technology, Coimbatore, (India)
*corresponding author
2
Research Associate, Manager – Engineering, TCMPFL, Chennai, (India)
3
Principal, Adithya Institute of Technology, Coimbatore, (India)
4
Professor, Nehru Institute of Engineering and Technology, Coimbatore, (India)
ABSTRACT
The main aim of this work is to use Taguchi method and Analysis of Variance to uncover the impact of cutting
parameters such as spindle speed, feed and drill tool diameter on tool wear, surface roughness, material
removal rate and hole diameter error for their optimization. The effect of drilling parameters on outcome
parameters is analyzed in this scenario. The parameters effectiveness is calculated using optimization
algorithms such as Micro Genetic algorithm, Scatter search algorithm and Modified fish swarm algorithm and
Artificial Immune System Optimization. From the experimental result, the most appropriate algorithm was
located and framed hybrid approach to tune further regulation to locate the Tool wear, MRR, Hole diameter
error and Surface smoothness which is used for selecting the most suitable combination of parameters based on
the minimum and maximum errors.
Key words
-Material Removal Rate, Surface Roughness, Hole diameter Error, Tool Wear, Micro
Genetic algorithm, Scatter search algorithm, Modified fish swarm algorithm and Artificial Immune
System Optimization algorithm, Hybrid Algorithm, MATLAB.
I. INTRODUCTION
2067 | P a g e
creation holes in any component, conservative drilling cultivate time is the most widely suitable and commonly accomplished machining process for hole making.
NOMENCLATURE:
v, Cutting Speed (m / min) fr, Feed (mm / rev)
d, Drill diameter (mm) Ra, Surface roughness μm
Tw, Tool wear (g) V, Material Removal Rate ( mm 3
/ min) DEh, Hole Diameter error (mm)
II. RELATED LITERATURE
2068 | P a g e
objective of their research focused to revise the consequence of cutting speed, feed, cutting tool dimension, processing time on the most significant outcome of metal removal rate, surface roughness, specific energy, tool material wear and the volume fraction. Also quoted the Taylor registration with the intention of a most favorable or fiscal cutting speed exists which might make best use of material removal rate. Substantial hard works are motionless in advancement on the approach conventional cutting state of affairs and cutting tool range at the process preparation stage. The necessity for the selection combined implementation over the processing parameters combination and largest appropriate tool material and its dimension being recognized in the recent past. Jyotiprakash Bhol et al [12] in their reporting commented that drilling is one of the straight material removal techniques which more or less envelop 40% amongst of all metal removal processes. During the process the cutting tool show off is listed the same as wear at flank, crater, corner and chisel wear. Out of which the flank wear is identified as the significant wear of all. Tool damage wear has an unconstructive result on the smoothness of finished surface along with the precision in the machined dimension of the work. Result of vibrations generation during machining in owe of the developed thrust force and torque while in operations which try to disassociate the work from the holding devices. Because of the flank wear upend, for the same combination input cutting variables, the processing forces end up with significant raise which will reflect in the quality product. Identifying the right combination of machining parameters which leads to the least flank wear with lowest amount thrust force and torque development are determined by skill and the optimum parameters could not be definite and taken for establishment. Many investigations have been done with Taguchi orthogonal array setup in drilling process on behalf of identifying the favorable optimal setting in machining.
III. EXPERIMENT PROCEDURE
J.Pradeep Kumar et al [6] conducted drilling process experiment on OHNS material with size 300 x 100 x 10 mm considered the participation machining parameters in three levels as marked in Table 3.1. The design of experiment was performed by Taguchi orthogonal array L2.
Table 3.1 Participation machining parameters
Taguchi plan of experiments and investigation of variance were put in to ascertain the most advantageous cutting parameters and to examine the effects over the tool wear and noticed that the feed associated with the drill point angle were instituted as significant factors whilst cutting speed contribution ejects the slightest effectual parameter. Performed the drilling test were by means of HSS spiral type drill bits on DECKEL MAHODMC 835V (continues speed up to 14000rpm and 14kw spindle power) CNC machine. CNC part programs were formed by adopting Master Cam 10 CAD / CAM software on a delicate central processing unit. The concluding silhouette of the hole was resolute using a Renishaw cyclone CMM which has the three-axis mechanical arrangement, the probe head, control unit, and PC. The CMM employed was a vertical-arm CMM; using a Renishaw PH sensor mount with a touch-trigger probe and the surface roughness (Ra) is resulted with a
Variables / Levels 1 2 3
Cutting speed in m / min 5 6.5 8 Feed in mm / rev 0.15 0.20 0.25
2069 | P a g e
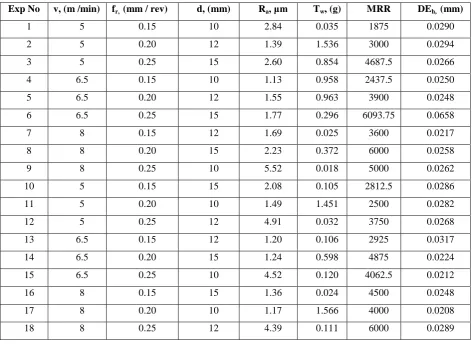
Mitutoyo Surftest SJ-201 Series 178-portable surface roughness tester instrument; tool wear was measured using the Shimadzu electronic balance machine. With the support of Minitab 13 software linear polynomial model was computed. Such Employed participation machining parameters and the responded upshot parameters are presented in Table 3.2
Table 3.2 Experimental observations
Exp No v, (m /min) fr, (mm / rev) d, (mm) Ra, μm Tw, (g) MRR DEh, (mm)
1 5 0.15 10 2.84 0.035 1875 0.0290
2 5 0.20 12 1.39 1.536 3000 0.0294 3 5 0.25 15 2.60 0.854 4687.5 0.0266
4 6.5 0.15 10 1.13 0.958 2437.5 0.0250
5 6.5 0.20 12 1.55 0.963 3900 0.0248 6 6.5 0.25 15 1.77 0.296 6093.75 0.0658
7 8 0.15 12 1.69 0.025 3600 0.0217 8 8 0.20 15 2.23 0.372 6000 0.0258
9 8 0.25 10 5.52 0.018 5000 0.0262
10 5 0.15 15 2.08 0.105 2812.5 0.0286 11 5 0.20 10 1.49 1.451 2500 0.0282
12 5 0.25 12 4.91 0.032 3750 0.0268
13 6.5 0.15 12 1.20 0.106 2925 0.0317 14 6.5 0.20 15 1.24 0.598 4875 0.0224
15 6.5 0.25 10 4.52 0.120 4062.5 0.0212
16 8 0.15 15 1.36 0.024 4500 0.0248 17 8 0.20 10 1.17 1.566 4000 0.0208
18 8 0.25 12 4.39 0.111 6000 0.0289
V. METHODOLOGY PROPOSALS TOWARDS OPTIMIZATION
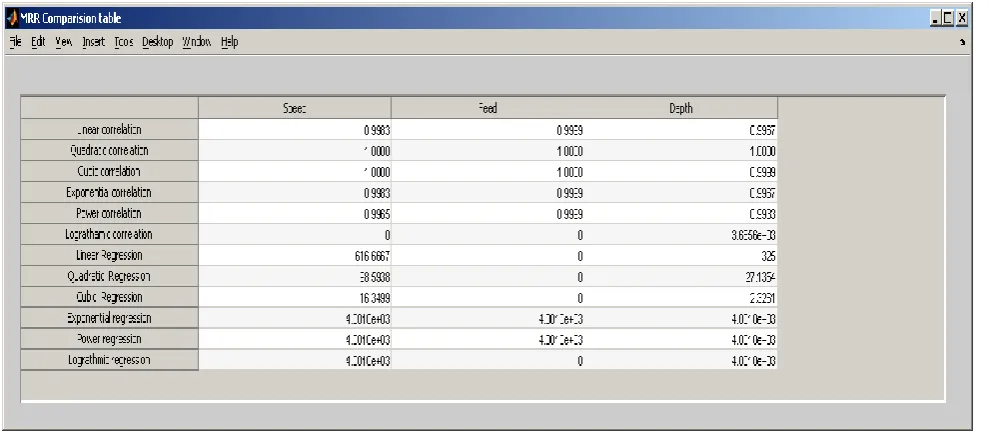
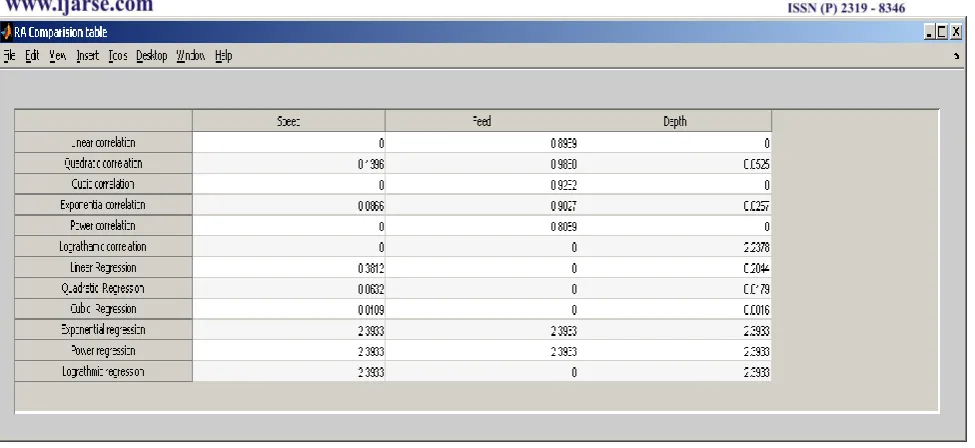
Parameters considered as participation and response variables are listed in Table 4.1. The mathematical relationship (correlation, regression) between each response variable – MRR, Surface roughness, Tool Wear and Hole diameter error with the participation variables individually with MiniTab17 in linear, quadratic, cubic, exponential, power, logarithmic functions and the values are represented through Figure 4.1 Correlation, Regression comparison of participation variables with MRR, Fig 4.2 Correlation, Regression comparison of participation variables with Surface roughness, Fig 4.3 Correlation, Regression comparison of participation variables with Tool wear and Fig 4.4 Correlation, Regression comparison of participation variables with Hole diameter Error respectively. While verifying all such computed relationship with the R2 response the cubic relationship is found to be most significant.
2070 | P a g e
Tw =1.88-0.105 v +0.30 fr,-0.0606 d
V =-7353+581.9 v +19073 fr,+304.6 d
DEh =0.0058-0.00113 v +0.0578 fr,+0.00147 d
In this approach, Micro GA algorithm, Scatter Search algorithm, Modified Fish Swarm algorithm and Artificial Immune System Optimization is used to compute and optimize the Participation variables towards the response variables.
Micro GA algorithm: - The micro-Genetic Algorithm (μGA) is an Evolutionary algorithm that in “small population” Genetic Algorithm (GA) which computes on the ideology of natural range or “continued existence of the fittest” to advance the finest probable resolution (i.e., design) over a numeral of generations to the
most-fit, or best possible, solution.
Scatter Search algorithm:- Scatter search, a Stochastic algorithm orients its explorations scientifically relation to a set of reference points that classically consist of superior solutions obtained by preceding trouble solving efforts, where the criterion for “good” are not constrained to objective function values, and may apply to
associate collections of solutions to a certain extent than to a single solution, as in the case of solutions that be at variance from each other according to certain specifications.
Modified Fish Swarm algorithm Swarm: - T.Bharathi et al. [13] presented that the Modified Artificial Fish Swarm Algorithm (MFSA) which has many benefits that includes higher convergence rate, flexibility, fault tolerance and high accuracy. General behaviors systems of standard AFSA are: Prey, Follow, and Swarm.
Artificial Immune System Optimization algorithm: - In artificial intelligence, artificial immune systems (AIS) are a class of computationally intellectual systems stimulated by the ideology and processes of the vertebrate immune system. The algorithms are classically modeled after the immune system's distinctiveness of learning and reminiscence for exercise in investigative.
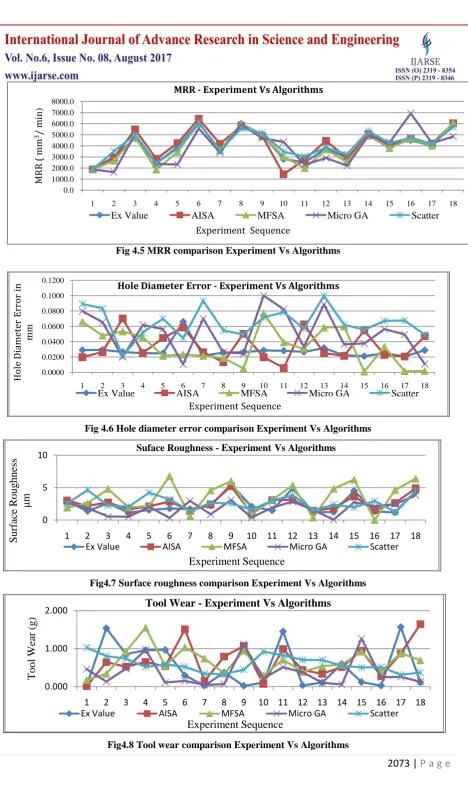
The computed values of each response variables through the employed algorithms are tabulated in Table 4.1, 4.2 respectively and the graphical representations are projected in the Figures 4.5, 4.6, 4.7 and 4.8.
2071 | P a g e
Fig 4.2 Correlation, Regression comparison of participation variables with Surface roughnessFig 4.3 Correlation, Regression comparison of participation variables with Tool wear
2072 | P a g e
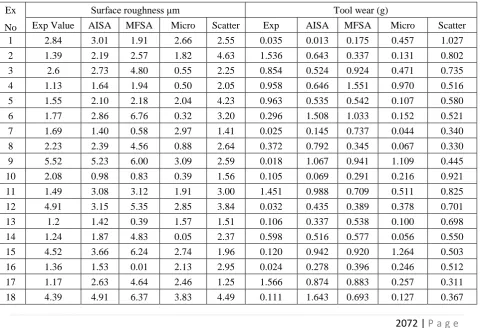
Table 4.1 Computed values of MRR and Hole Diameter Error – Experimental outcome Vs Algorithm wiseEx No
MRR ( mm3/ min) Hole Diameter error (mm) Exp Value AISA MFSA Micro
GA
Scatter Exp Value
AISA MFSA Micro GA
Scatter 1 1875.0 1874.9 1878.3 1875.2 1875.3 0.0290 0.0198 0.0658 0.0798 0.0893 2 3000.0 2932.3 2650.4 1617.4 3504.7 0.0294 0.0264 0.0478 0.0654 0.0834 3 4687.5 5470.5 4791.3 5026.2 5002.4 0.0266 0.0703 0.0532 0.0200 0.0213 4 2437.5 2832.4 1845.8 2369.8 2437.8 0.0250 0.0252 0.0458 0.0616 0.0520 5 3900.0 4238.9 3439.4 2311.3 3751.3 0.0248 0.0448 0.0215 0.0564 0.0700 6 6093.8 6435.2 6021.4 5568.9 6098.6 0.0658 0.0585 0.0231 0.0106 0.0446 7 3600.0 4176.5 3629.0 3382.8 3528.9 0.0217 0.0263 0.0215 0.0699 0.0933 8 6000.0 5759.7 5924.0 5905.4 5568.3 0.0258 0.0131 0.0187 0.0259 0.0547 9 5000.0 4869.1 4963.8 4688.7 5152.6 0.0262 0.0502 0.0051 0.0248 0.0493 10 2812.5 1438.2 3026.7 4342.3 3465.0 0.0286 0.0197 0.0769 0.0999 0.0718 11 2500.0 2763.5 1976.9 2304.0 3044.1 0.0282 0.0057 0.0391 0.0821 0.0784 12 3750.0 4444.0 3661.3 2892.1 3831.6 0.0268 0.0626 0.0306 0.0334 0.0569 13 2925.0 2908.4 2530.2 2212.1 3240.0 0.0317 0.0250 0.0582 0.0885 0.0999 14 4875.0 5053.9 4913.0 4917.8 5336.2 0.0224 0.0214 0.0598 0.0365 0.0619 15 4062.5 4126.9 3795.6 4321.9 4236.7 0.0212 0.0545 0.0009 0.0376 0.0555 16 4500.0 4612.2 4636.2 6929.5 4745.2 0.0248 0.0227 0.0334 0.0563 0.0671 17 4000.0 4201.4 3997.9 4239.9 4171.9 0.0208 0.0207 0.0014 0.0493 0.0676 18 6000.0 6031.1 6101.7 4840.3 5716.9 0.0289 0.0471 0.0018 0.0108 0.0490
Table 4.2 Computed values of Surface Roughness and Tool wear – Experimental outcome Vs Algorithm wise
Ex No
Surface roughness μm Tool wear (g) Exp Value AISA MFSA Micro
GA
Scatter Exp Value
AISA MFSA Micro GA
2073 | P a g e
Fig 4.5 MRR comparison Experiment Vs AlgorithmsFig 4.6 Hole diameter error comparison Experiment Vs Algorithms
Fig4.7 Surface roughness comparison Experiment Vs Algorithms
Fig4.8 Tool wear comparison Experiment Vs Algorithms 0.0000 0.0200 0.0400 0.0600 0.0800 0.1000 0.1200
1 2 3 4 5 6 7 8 9 10 11 12 13 14 15 16 17 18
Hol e Dia me te r Er ror in mm Experiment Sequence
Hole Diameter Error - Experiment Vs Algorithms
Ex Value AISA MFSA Micro GA Scatter
0 5 10
1 2 3 4 5 6 7 8 9 10 11 12 13 14 15 16 17 18
Surf
ac
e
R
oug
hnes
s
μm
Experiment Sequence
Suface Roughness - Experiment Vs Algorithms
Ex Value AISA MFSA Micro GA Scatter
0.000 1.000 2.000
1 2 3 4 5 6 7 8 9 10 11 12 13 14 15 16 17 18
T
oo
l
W
ea
r
(g
)
Experiment Sequence
Tool Wear - Experiment Vs Algorithms
Ex Value AISA MFSA Micro GA Scatter
0.0 1000.0 2000.0 3000.0 4000.0 5000.0 6000.0 7000.0 8000.0
1 2 3 4 5 6 7 8 9 10 11 12 13 14 15 16 17 18
M R R ( mm 3/ min )
Experiment Sequence
MRR - Experiment Vs Algorithms
2074 | P a g e
V. ANALYSIS OF COMPUTATIONAL RESULTS AND DISCUSSION
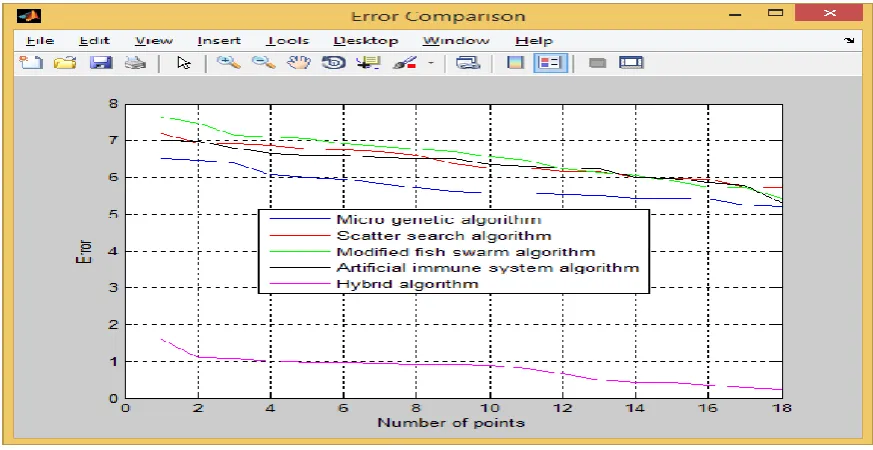
On comparing the outcome of Algorithms with the actual experimental observations individually on the parameters concerned, and identified the best outcome based on the minimal error rate the best and next best algorithms are taken out to frame hybrid algorithm. A hybrid algorithm is an algorithm that combines two or more other algorithms that solve the same problem, either choosing one (depending on the data), or switching between them over the course of the algorithm. This is generally done to combine desired features of each, so that the overall algorithm is better than the individual components. Scatter Search algorithm (second best) output is taken into the Micro Genetic Algorithm to form the hybrid outcome algorithm. Upon computing the mean error rate is brought down to the drastic level and the hybrid Scatter Search Integrated Micro GA Algorithm yields tuned result. The error as well as mean error comparison of this hybrid Scatter Search Integrated Micro GA Algorithm with other algorithms exposed in the Figure 4.5, Figure 4.6.
Fig 5.1 Error comparisons of Algorithms with Hybrid
2075 | P a g e
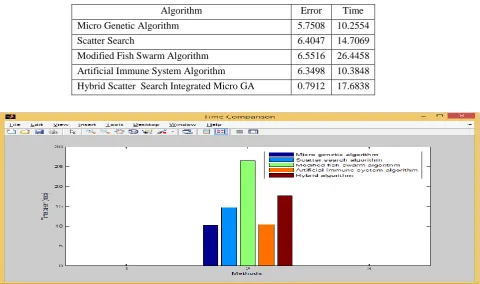
The time consumption to compute all algorithmic results also displayed in the Figure 5.3, in this computation the time taken for hybrid algorithm registers as the second largest, but resulted minimum error with reference to others. Both the error rate and time for computing is given in the Table 5.1. The values of the response variables with reference to the particiaption parameters computed through the Hybrid Scatter Search Integrated Micro GA are organized through Table 5.2.
Table 5.1Error values and Time consumption of computation
Algorithm Error Time Micro Genetic Algorithm 5.7508 10.2554 Scatter Search 6.4047 14.7069 Modified Fish Swarm Algorithm 6.5516 26.4458 Artificial Immune System Algorithm 6.3498 10.3848 Hybrid Scatter Search Integrated Micro GA 0.7912 17.6838
Fig 5.3 Time of computing by algorithms
Table 5.2 Outcome of Hybrid algorithm in output parameters
Hybrid Algorithm Outcomes
v d fr Ra Tw V DEh v d fr Ra Tw V DEh
2076 | P a g e
VI. CONCLUSION
For the OHNS material with the given set of machining conditions, Feed rate registered the high level of influence on Surface roughness, Tool wear and hole diameter accuracy, over the other input parameters. Micro Genetic and Scatter search algorithms are registered the first and second best algorithm for computation to optimize the parameters. Hybrid of Scatter Search Integrated Micro GA capitulate further more tuned result. This hybrid algorithm may be used, for computing the results for various combinations of input parameters and selecting the most suitable combination of parameters based on the minimum and maximum errors while drilling operations in OHNS material.
REFERENCES
[1] Alper Uysal., Mirigul Altan. and Erhan Altan, “Effects of cutting parameters on tool wear in drilling of polymer composite by Taguchi method,” International Journal of Advanced Manufacturing Technology,
vol.58, pp. 915-921, 2012.
[2] Singh, I., and Bhatnagar., N, “Drilling of uni-directional glass fiber reinforced plastic (UD-GFRP) composite,” International Journal of Advanced Manufacturing Technology, vol.27, pp. 870-876, 2006.
[3] P K Rakesh., I Singh and D Kumar, “Flexural behaviour of glass fibre-reinforced plastic laminates with drilled hole,” Proc. I MechE, vol. 226 Part L: J. Materials: Design and Applications, pp. 149-158, 2011.
[4] Kishore R. A., Tiwari R and Singh, I, “Investigation of drilling in [(0/90)/0]s glass fiber reinforced plastics
using Taguchi method”. Advances in Production Engineering and Management, vol. 4, no. 1, pp. 37–46, 2009.
[5] Mathew. J., Ramakrishnan, N and Naik. N. K, “Investigations into the effect of geometry of trepanning tool on thrust and torque during drilling of GFRP composites” Journal of Materials Processing
Technology, vol.91, pp. 1-11, 1999.
[6] J.Pradeep Kumar, P.Packiaraj, “Effect of Drilling Parameters on Surface Roughness, Tool Wear, Material Removal Rate and Hole Diameter Error in Drilling of OHNS,” International Journal of Advanced
Engineering Research and Studies, vol. I, Issue III, pp. 150-154, 2012.
[7] Mohan.NS, Ramachandra.A and Kulkarni SM, “Influence of process parameters on cutting force and
torque during drilling of glass-fiber polyester reinforced composites,” Composite Structures, vol. 71, pp. 405–413, 2005.
[8] Davim. JP, Reis P and Antonio CC, “Experimental study of drilling glass fiber reinforced plastics (GFRP) manufactured by hand layup,” Composite Science Technology, vol. 64, pp. 289–297, 2004.
[9] Kishore. RA, Tiwari. R, Dvivedi A and Singh I, “Taguchi analysis of the residual tensile strength after drilling in glass fiber reinforced epoxy composites,” Mater. Design, vol. 38, pp. 2186–2190, 2009.
[10] DeFu Liu, YongJun Tang, W.L.Cong, “A review of mechanical drilling for composite laminates,”
Composite Structures, vol.94, pp. 1265–1279, 2012.
[11] C. Dhavamani, T. Alwarsamy, “Review on optimization of machining operation,” International Journal of
2077 | P a g e
[12] Jyotiprakash Bhol, Satindra N. Bhattacharya, and Nirmal K. Mandal, “A Neuro-Genetic Approach forMulti-Objective Optimization of Process Variables in Drilling,” International Journal of Technology and Engineering System, vol. 2, no1, pp. 89- 94, 2011.
[13] T. Bharathi and P. Krishnakumari “Application of Modified Artificial Fish Swarm Algorithm for