O R I G I N A L R E S E A R C H
External Validation Of The Updated ADO Score
In COPD Patients From The Birmingham COPD
Cohort
This article was published in the following Dove Press journal: International Journal of Chronic Obstructive Pulmonary Disease
Spencer J Keene 1–3
Rachel E Jordan1
Frits ME Franssen 3,4
Frank de Vries2,5
James Martin1
Alice Sitch1,6
Alice Margaret Turner1
Andrew P Dickens 1
David Fitzmaurice7
Peymane Adab 1
1Institute of Applied Health Research,
College of Medical and Dental Sciences, University of Birmingham, Birmingham, UK;2Department of Clinical Pharmacy &
Toxicology, Maastricht University Medical Center+, Maastricht, the Netherlands;
3Ciro, Horn, the Netherlands; 4Department of Respiratory Medicine,
NUTRIM School of Nutrition and Translational Research in Metabolism, Maastricht University Medical Centre+, Maastricht, The Netherlands;5Utrecht
Institute for Pharmaceutical Sciences Utrecht University, Utrecht, The Netherlands;6NIHR Birmingham
Biomedical Research Centre, University Hospitals Birmingham NHS Foundation Trust and University of Birmingham, Birmingham, UK;7Clinical Trials Unit,
Warwick Medical School, University of Warwick, Coventry, UK
Background: Reviews suggest that the ADO score is the most discriminatory prognostic
score for predicting mortality among chronic obstructive pulmonary disease (COPD) patients, but a full evaluation and external validation within primary care settings is critical before implementation.
Objectives: To validate the ADO score in prevalent and screen-detected primary care
COPD cases at 3 years and at shorter time periods.
Patients and methods: One thousand eight hundred and ninety-two COPD cases were
recruited between 2012 and 2014 from 71 United Kingdom general practices as part of the Birmingham COPD Cohort study. Cases were either on the practice COPD register or screen-detected. We validated the ADO score for predicting 3-year mortality with 1-year and 2-year mortality as secondary endpoints using discrimination (area-under-the-curve (AUC)) and calibration plots.
Results:One hundred and fifty-four deaths occurred within 3 years. The ADO score was
discriminatory for predicting 3-year mortality (AUC= 0.74; 95% CI: 0.69–0.79). Similar
performance was found for 1- (AUC= 0.73; 0.66–0.80) and 2-year mortality (0.72; 0.67–
0.76). The ADO score showed reasonable calibration for predicting 3-year mortality
(cali-bration slope 0.95; 0.70–1.19) but over-predicted in cases with higher predicted risks of
mortality at 1 (0.79; 0.45–1.13) and 2-year (0.79; 0.57–1.01) mortality.
Discussion:The ADO score showed promising discrimination in predicting 3-year mortality
in a primary care population including screen-detected cases. It may need to be recalibrated if it is used to provide risk predictions for 1- or 2-year mortality since, in these time-periods, over-prediction was evident, especially in cases with higher predicted mortality risks.
Keywords:pulmonary disease, chronic obstructive, mortality, prognosis, validation studies
Plain Language Summary
Prediction models are tools that can be used to provide estimates of likely outcomes, such as
death, over a specified time period in individual patients. This information can then be used
to inform treatment decisions. For example, the intensity of treatment (or monitoring) may be increased for those with higher individual risks. These tools are usually developed using data from one group of people. However, because other groups of people may have different characteristics, the accuracy of the tool needs to be checked in these other groups. The ADO (age, dyspnoea (i.e. breathlessness), and obstructed airways) score was developed to predict death within 3 years in people with COPD. Our aim was to check whether the ADO score is
accurate in predicting the risk of death in a group of people with COPD identified in general
practices in the UK. We also wanted to determine whether it was accurate for predicting the Correspondence: Rachel E Jordan
Institute of Applied Health Research, College of Medical and Dental Sciences, University of Birmingham, Edgbaston, Birmingham, UK
Tel +44 0121 414 6775 Email [email protected]
International Journal of Chronic Obstructive Pulmonary Disease
Dove
press
open access to scientific and medical research
Open Access Full Text Article
International Journal of Chronic Obstructive Pulmonary Disease downloaded from https://www.dovepress.com/ by 118.70.13.36 on 22-Aug-2020
risk of death at time periods shorter than 3 years. Previous studies have shown that the ADO score distinguishes well between likelihood of being dead or alive (i.e. the discrimination of a model). In our sample of people with newly diagnosed and
existing COPD in primary care, we confirmed these results.
However, previous studies have not properly assessed the degree of agreement between the expected and observed individual risk of death (i.e. the calibration of a model). It is essential to report calibration in prognostic models because it tells you how accu-rate mortality predictions are likely to be for individual with a particular disease. We found that the ADO score over-predicts individual risk of death for periods <3 years. Unless adjusted, this reduces its usefulness for clinical decision-making. In addi-tion, this has implications for other COPD prognostic scores that have been tested and used at shorter time periods than they were developed for.
Introduction
Chronic obstructive pulmonary disease (COPD) is the third leading cause of mortality worldwide.1,2 Prognostic scores to predict mortality risk in people with COPD are useful in order to assess disease severity, define interven-tion opinterven-tions, and facilitate consultainterven-tions with patients about their prognosis.3Knowledge of the risk of mortality also allows the benefits of treatments for COPD to be weighed against potential harms, such as side effects, costs, and inconvenience2 in order to enable informed clinical decision-making. The extent of airflow obstruc-tion, usually assessed by forced expiratory volume in the
first second (FEV1), has long been recognised as an impor-tant measure of prognosis and is used for disease staging.2 However, the complex and multifaceted nature of COPD4,5 has led to the identification of other important predictors of mortality and the recognition that combining these in multicomponent indices6–10 improves prognostic ability. However, before implementation in clinical practice, it is important to evaluate the predictive ability of the prognos-tic index in different populations.3There are two important aspects to such evaluation, including assessment of how well the index can differentiate between those who die and those who remain alive (i.e. discrimination) and the extent of agreement between predicted and observed mortality (i.e. calibration). The latter is particularly important for prognostication.11
Amongst prognostic indices, the ADO (age, dyspnoea, airflow obstruction) score has wide applicability as it is made up of only three easily measured components,9 over-coming the limitation of many other indices.12The origi-nal ADO score was developed in 20099to predict 3-year
mortality in patients with moderate-to-severe COPD from secondary care and was updated in 2012 in an interna-tional cohort from a variety of healthcare settings to improve its generalisability.13 The updated ADO has been externally validated several times.13–16 However, only two validation studies were in primary care populations,14,16 where most people with COPD are cared for.17 In one of these studies, calibration was not assessed.14 The other study only considered 2-year mor-tality as the outcome and adjusted the intercept of the ADO score.16 A further two studies used populations across primary, secondary and tertiary settings.13,15 However, no analyses were undertaken to assess the dif-ferential performance of the ADO score in each setting.
Our aim was to validate the updated ADO score in COPD cases from a large primary care research cohort (the Birmingham COPD cohort) which included both pre-viously and newly diagnosed cases and where dyspnoea and lung function were measured under standardized conditions.
Methods
This paper was written in accordance with the Transparent Reporting of a multivariable prediction model for Individual Prognosis Or Diagnosis statement.18
Design
External validation study of a published prognostic score.
Source And Study Population
The characteristics of the Birmingham COPD cohort, which is part of the Birmingham Lung Improvement Studies (BLISS), have been summarized in a previous publication.19 Briefly, COPD cases were recruited from 71 UK general practices across the West Midlands, United Kingdom. For this analysis, cohort cases with diagnosed COPD (aged 40 and over) on practice Quality and Outcomes Framework COPD registers (i.e. prevalent cases) and those with newly detected COPD identified through a case-finding trial (i.e. incident cases were screen-detected)20 were included. The definition of COPD in incident cases was based on reporting of relevant symptoms in those with airflow obstruction (forced expira-tory volume in the first second (FEV1)/forced vital capa-city (FVC) <0.7 according to recommendations in UK guidelines). Baseline assessments took place at cohort entry from 31 May 2012 to 25 June 2014.
International Journal of Chronic Obstructive Pulmonary Disease downloaded from https://www.dovepress.com/ by 118.70.13.36 on 22-Aug-2020
Exposure And Outcome Measurements
The ADO score (0–14) was computed from three variables taken at baseline: age, dyspnoea (modified MRC score), and obstruction (FEV1% predicted). Age was calculated from patient-reported date of birth, and dyspnoea was assessed by a questionnaire using the British Medical Research Council guidelines.21 A researcher trained to international standards to measure FEV1administered the nddEasy One Spirometer (ndd, Switzerland) before (max eight blows) and after (max six blows) 400µg salbutamol, aiming for three blows within 100 mL. FEV1and FVC recording were con-sidered useable if they met ATS acceptability criteria and were within 200 mL. The highest recording was then taken.19 Quality assurance was maintained using real-time quality assessment, with over-reading of spirometry measurements. FEV1% predicted was estimated using the Global Lung Function Initiative equations.22Linked mortality data were obtained through the Office of National Statistics for the period of recruitment until 31 March 2016 through NHS Digital.23Other patient charac-teristics including ethnicity, level of deprivation (using Index of Multiple Deprivation derived from home post-code), smoking status, quality of life, and medical history (including self-reported comorbidities and previous exacerbations) were obtained by patient self-report through standardized questionnaires. Body mass index (BMI derived from height and weight measurements) and exercise capacity (using sit-to-stand test) were obtained by trained researchers using standardised protocols at the baseline visit.19
Patient Selection Criteria
The ADO score was developed for participants 40 years and older. Missing baseline mMRC scores or FEV1% predicted observations were imputed using multiple imputation (MI) by chained equations so that all remain-ing incident and prevalent cases (N= 1892) could be included in the final analyses (baseline tables show data prior to imputation). Additional auxiliary variables (cardiovascular disease history, cardiovascular disease medication, chronic cough, chronic phlegm, ethnicity, and gender) were used to aid the imputation. The num-ber of imputed datasets used was based on the fraction of missing data for all variables (11%, so 11 MI datasets were used).24 Death data were complete for all cases under the assumption that patients without a date of death remained alive.
Analysis
Baseline characteristics were compared between preva-lent and incident cases as well as between those who died within 3 years of study entry compared to those who did not. Chi-square and Student’s t-tests were used for categorical and continuous variables, respectively.
The updated ADO score regression coefficients and intercept13were used to compute the predicted probability of 3-year mortality for each eligible cohort participant (Supplementary Table 1). To assess discrimination, area-under-the-curve (AUC) was estimated with a 95% confi -dence interval (95% CI) and plotted using AUC-ROC plots.25 Calibration was assessed by comparing the pre-dicted probability to the observed probability of mortality and examined with a calibration plot and calibration slope with 95% CI. Calibration plots (STATA function: pmcal-plot) displayed observed risk by deciles of the predicted risk and also examined risk at the individual level using Locally Weighted Scatterplot Smoothing algorithms.26An estimate of the Calibration-in-the-large (CITL) was used to indicate whether the predictions were systematically too high or too low.26As MI datasets were used, the AUC and calibration slope were estimated in each individual MI dataset, before Rubin’s rule was used to combine estimates.27
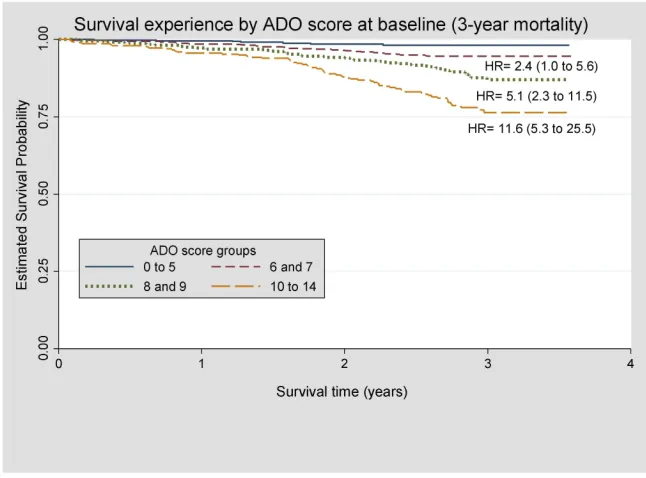
A Kaplan–Meier plot was created according to ADO score group (0 to 5, 6 and 7, 8 and 9, and 10 to 14). Scores were grouped based on the number of patients. Separation of Kaplan–Meier curves for ADO score groups indicates better discriminative performance.
In secondary analyses (using the same discrimination and calibration methods as above), we evaluated the ability of the ADO index to predict mortality at 1 and 2 years. The period end dates for each case were 1, 2, and 3 years after study entry. If the end date for the period fell after the 31 March 2016, then the case was excluded from that period. Period exclusions were made regardless of whether and at what time cases died to ensure that dead and alive cases were treated the same. However, a sensitivity analysis was performed by re-introducing cases that died within a certain period despite a period end date that fell after the 31 March 2016. Two additional sensitivity analyses were con-ducted: 1) We estimated the discrimination and calibra-tion estimates for prevalent cases alone and 2) for complete cases (non-missing obstruction and dyspnoea). Prevalent cases were studied alone because the accuracy
International Journal of Chronic Obstructive Pulmonary Disease downloaded from https://www.dovepress.com/ by 118.70.13.36 on 22-Aug-2020
of the ADO score may be affected by the inclusion of screen-detected cases (which might not reflect usual primary care populations). All analyses were undertaken using STATA (StataCorp, College Station TX, USA).
Results
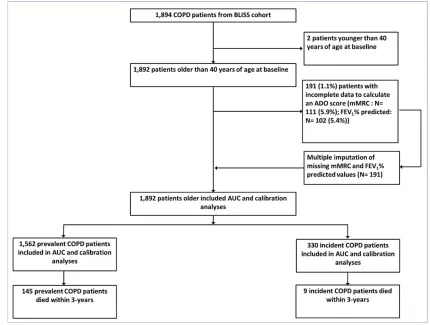
Out of 1894 cases in the cohort, two were younger than 40 years of age at baseline, 111 (5.9%) had missing mMRC score, and 102 (5.4%) had missing FEV1% predicted values (22 (1.2%)) were missing both (Figure 1). Before imputing miss-ing mMRC and FEV1% predicted, there were 1392 prevalent and 309 incident cases (total 1701). The median observation time was 3.02 years (minimum 1.77 and maximum 3.83 years). The average age was 68.4 years old and 651 (38.3%) cases were female. The majority (79.5%) had mild-to-moder-ate airflow obstruction (50.6% with GOLD stage II) and the mean ADO score at baseline was 7.0 (SD 2.4). One hundred and twenty-four (7.3%) deaths occurred within 3 years of observation time, 116 (94%) of which occurred in the preva-lent cases.
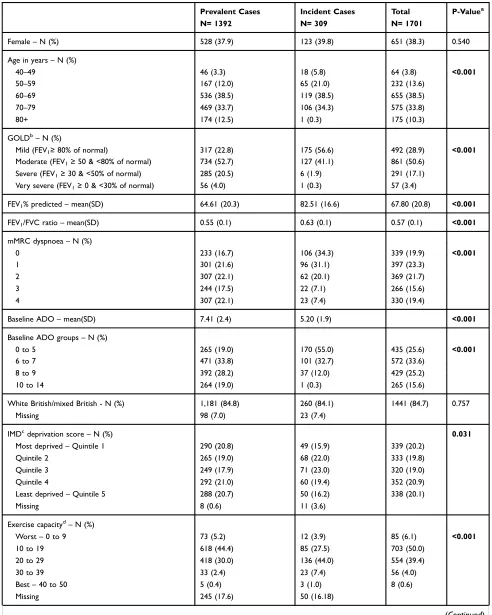
When compared to incident cases, prevalent cases tended to have a worse baseline ADO score (older age, more severe obstruction and worse breathlessness), lower exercise capacity scores, more comorbidities, were more likely to report a worse health-related quality of life score, had more former smokers, and were more likely to report a respiratory hospitalisation and at least one exacerbation in the previous 12 months (Table 1).
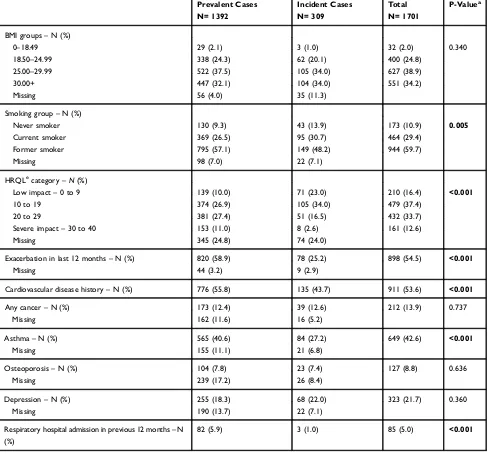
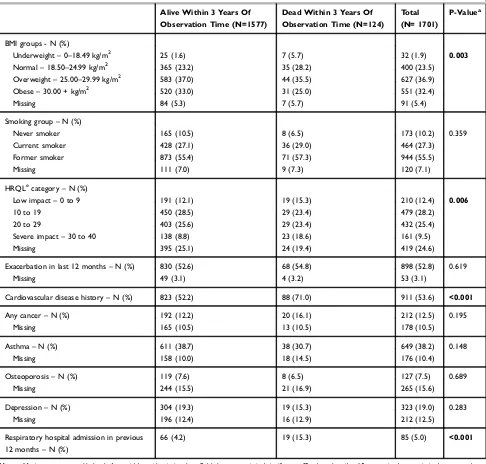
Table 2shows a comparison of characteristics of cases according to whether or not they were alive within 3 years of observation time. Those who died were older and had more severe obstruction and dyspnoea (allP<0.001) which resulted in a higher baseline ADO score (mean (SD) score 8.98 (2.14)) compared to those who remained alive (6.85 (2.39)). They were also less likely to be female, had poorer exercise capacity, lower BMI, were more likely to have a severe impact of COPD on health-related quality of life, were more likely to have cardiovascular comorbidity, and were more likely to report respiratory hospitalisation in the 12 months before baseline compared to those who remained alive.
Figure 1Patient (i.e. case)flow chart from whole cohort to ADO validation sample.
International Journal of Chronic Obstructive Pulmonary Disease downloaded from https://www.dovepress.com/ by 118.70.13.36 on 22-Aug-2020
Table 1Comparison Of Baseline Characteristics Of Existing COPD Cases With Those Who Were Screen Detected (N=1701)
Prevalent Cases N= 1392
Incident Cases N= 309
Total N= 1701
P-Valuea
Female–N (%) 528 (37.9) 123 (39.8) 651 (38.3) 0.540
Age in years–N (%)
40–49 46 (3.3) 18 (5.8) 64 (3.8) <0.001
50–59 167 (12.0) 65 (21.0) 232 (13.6)
60–69 536 (38.5) 119 (38.5) 655 (38.5)
70–79 469 (33.7) 106 (34.3) 575 (33.8)
80+ 174 (12.5) 1 (0.3) 175 (10.3)
GOLDb–N (%)
Mild (FEV1≥80% of normal) 317 (22.8) 175 (56.6) 492 (28.9) <0.001
Moderate (FEV1≥50 & <80% of normal) 734 (52.7) 127 (41.1) 861 (50.6)
Severe (FEV1≥30 & <50% of normal) 285 (20.5) 6 (1.9) 291 (17.1)
Very severe (FEV1≥0 & <30% of normal) 56 (4.0) 1 (0.3) 57 (3.4)
FEV1% predicted–mean(SD) 64.61 (20.3) 82.51 (16.6) 67.80 (20.8) <0.001
FEV1/FVC ratio–mean(SD) 0.55 (0.1) 0.63 (0.1) 0.57 (0.1) <0.001
mMRC dyspnoea–N (%)
0 233 (16.7) 106 (34.3) 339 (19.9) <0.001
1 301 (21.6) 96 (31.1) 397 (23.3)
2 307 (22.1) 62 (20.1) 369 (21.7)
3 244 (17.5) 22 (7.1) 266 (15.6)
4 307 (22.1) 23 (7.4) 330 (19.4)
Baseline ADO–mean(SD) 7.41 (2.4) 5.20 (1.9) <0.001
Baseline ADO groups–N (%)
0 to 5 265 (19.0) 170 (55.0) 435 (25.6) <0.001
6 to 7 471 (33.8) 101 (32.7) 572 (33.6)
8 to 9 392 (28.2) 37 (12.0) 429 (25.2)
10 to 14 264 (19.0) 1 (0.3) 265 (15.6)
White British/mixed British - N (%) 1,181 (84.8) 260 (84.1) 1441 (84.7) 0.757
Missing 98 (7.0) 23 (7.4)
IMDcdeprivation score–N (%) 0.031
Most deprived–Quintile 1 290 (20.8) 49 (15.9) 339 (20.2)
Quintile 2 265 (19.0) 68 (22.0) 333 (19.8)
Quintile 3 249 (17.9) 71 (23.0) 320 (19.0)
Quintile 4 292 (21.0) 60 (19.4) 352 (20.9)
Least deprived–Quintile 5 288 (20.7) 50 (16.2) 338 (20.1)
Missing 8 (0.6) 11 (3.6)
Exercise capacityd–N (%)
Worst–0 to 9 73 (5.2) 12 (3.9) 85 (6.1) <0.001
10 to 19 618 (44.4) 85 (27.5) 703 (50.0)
20 to 29 418 (30.0) 136 (44.0) 554 (39.4)
30 to 39 33 (2.4) 23 (7.4) 56 (4.0)
Best–40 to 50 5 (0.4) 3 (1.0) 8 (0.6)
Missing 245 (17.6) 50 (16.18)
(Continued)
International Journal of Chronic Obstructive Pulmonary Disease downloaded from https://www.dovepress.com/ by 118.70.13.36 on 22-Aug-2020
Figure 2shows a Kaplan–Meier plot of the survival of cases according to their ADO score at baseline. The sur-vival curves are well separated which indicates good dis-crimination. Cases with an ADO score of 10 or higher had nearly 12 times the rate of death when compared to patients with an ADO of 0 to 5.
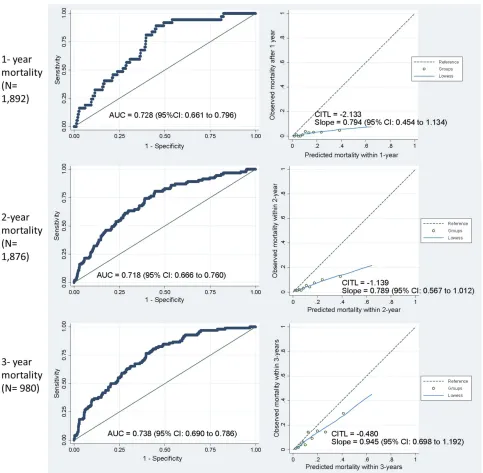
Figure 3shows AUC and calibration plots for prevalent and incident cases. One thousand eight hundred and ninety-two cases were available after imputing missing mMRC and FEV1% predicted observations which added 30 more deaths (total equal to 154 deaths) within 3 years of observation time (Figure 1). For 3-year mortality
Table 1(Continued).
Prevalent Cases N= 1392
Incident Cases N= 309
Total N= 1701
P-Valuea
BMI groups–N (%)
0–18.49 29 (2.1) 3 (1.0) 32 (2.0) 0.340
18.50–24.99 338 (24.3) 62 (20.1) 400 (24.8)
25.00–29.99 522 (37.5) 105 (34.0) 627 (38.9)
30.00+ 447 (32.1) 104 (34.0) 551 (34.2)
Missing 56 (4.0) 35 (11.3)
Smoking group–N (%)
Never smoker 130 (9.3) 43 (13.9) 173 (10.9) 0.005
Current smoker 369 (26.5) 95 (30.7) 464 (29.4)
Former smoker 795 (57.1) 149 (48.2) 944 (59.7)
Missing 98 (7.0) 22 (7.1)
HRQLecategory– N(%)
Low impact–0 to 9 139 (10.0) 71 (23.0) 210 (16.4) <0.001
10 to 19 374 (26.9) 105 (34.0) 479 (37.4)
20 to 29 381 (27.4) 51 (16.5) 432 (33.7)
Severe impact–30 to 40 153 (11.0) 8 (2.6) 161 (12.6)
Missing 345 (24.8) 74 (24.0)
Exacerbation in last 12 months–N (%) 820 (58.9) 78 (25.2) 898 (54.5) <0.001
Missing 44 (3.2) 9 (2.9)
Cardiovascular disease history–N (%) 776 (55.8) 135 (43.7) 911 (53.6) <0.001
Any cancer–N (%) 173 (12.4) 39 (12.6) 212 (13.9) 0.737
Missing 162 (11.6) 16 (5.2)
Asthma–N (%) 565 (40.6) 84 (27.2) 649 (42.6) <0.001
Missing 155 (11.1) 21 (6.8)
Osteoporosis–N (%) 104 (7.8) 23 (7.4) 127 (8.8) 0.636
Missing 239 (17.2) 26 (8.4)
Depression–N (%) 255 (18.3) 68 (22.0) 323 (21.7) 0.360
Missing 190 (13.7) 22 (7.1)
Respiratory hospital admission in previous 12 months–N (%)
82 (5.9) 3 (1.0) 85 (5.0) <0.001
Notes:Missing rows were added only for variables with missing data. Bold denotes statistical significance.a
P-values describe differences in characteristics between cohorts without accounting for missing as a separate category. Chi-square test for categorical data and Student’st-test for continuous data.b
The Global Initiative for Chronic Obstructive Lung Disease (GOLD) categories of airflow limitation.c
Based on the Index of Multiple Deprivation (IMD) 2010. Lower quintiles indicate more deprivation. d
Assessed using the sit-to-stand test.28e
Health-related quality of life based on the COPD Assessment Test (CAT).
Abbreviations:FEV1, forced expiratory volume in one second; MRC, medical research council; HRQL, health-related quality of life.
International Journal of Chronic Obstructive Pulmonary Disease downloaded from https://www.dovepress.com/ by 118.70.13.36 on 22-Aug-2020
Table 2Baseline Characteristics Of Cases (N=1701) By Whether Or Not They Died Within 3 Years Of Observation Time
Alive Within 3 Years Of Observation Time (N=1577)
Dead Within 3 Years Of Observation Time (N=124)
Total (N= 1701)
P-Valuea
Female–N (%) 618 (39.2) 33 (26.6) 651 (38.3) 0.006
Age in years–N (%)
40–49 62 (3.9) 2 (1.6) 64 (3.8) <0.001
50–59 227 (14.4) 5 (4.0) 232 (13.6)
60–69 619 (39.3) 36 (29.0) 655 (38.5)
70–79 529 (33.5) 46 (37.1) 575 (33.8)
80+ 140 (8.9) 35 (28.2) 169 (9.9)
GOLDbstage–N (%)
Mild (FEV1≥80% of normal) 479 (30.4) 13 (10.5) 492 (28.9) <0.001
Moderate (FEV1≥50 & <80% of normal) 803 (50.9) 58 (46.8) 861 (50.6)
Severe (FEV1≥30 & <50% of normal) 252 (16.0) 39 (31.5) 291 (17.1)
Very severe (FEV1≥0 & <30% of normal) 43 (2.7) 14 (11.3) 57 (3.4)
FEV1% predicted–mean(SD) 69.0 (20.5) 55.2 (20.6) 68.0 (20.8) <0.001
FEV1/FVC ratio–mean(SD) 0.57 (0.13) 0.52 (0.15) 0.57 (0.13) <0.001
mMRC dyspnoea–N (%)
0 321 (20.4) 18 (14.5) 339 (19.9) <0.001
1 382 (24.2) 15 (12.1) 397 (23.3)
2 343 (21.8) 26 (21.0) 369 (21.7)
3 243 (15.4) 23 (18.6) 266 (15.6)
4 288 (18.3) 42 (33.9) 330 (19.4)
Baseline ADO–mean (SD) 6.85 (2.39) 8.98 (2.14) 7.01 (2.43) <0.001
Baseline ADO groups–N (%)
Low risk–0 to 5 428 (27.1) 7 (5.7) 435 (25.6) <0.001
6 to 7 548 (34.8) 24 (19.4) 572 (33.6)
8 to 9 390 (24.7) 39 (31.5) 429 (25.2)
High risk–10 to 14 211 (13.4) 54 (43.6) 265 (15.6)
White British/mixed British–N (%) 1331 (84.4) 110 (88.7) 1441 (84.7) 0.425
Missing 115 (7.3) 6 (4.8) 121 (7.1)
IMDcdeprivation score–N (%) 0.406
Most deprived–Quintile 1 316 (20.0) 23 (18.6) 339 (19.9)
Quintile 2 302 (19.2) 31 (25.0) 333 (19.6)
Quintile 3 302 (19.2) 18 (14.5) 320 (18.8)
Quintile 4 324 (20.6) 28 (22.6) 352 (20.7)
Least deprived–Quintile 5 316 (20.0) 22 (17.7) 338 (19.9)
Missing 17 (1.1) 2 (1.6) 19 (1.1)
Exercise capacityd–N (%)
Worst–0 to 9 75 (4.8) 10 (8.1) 85 (5.0) <0.001
10 to 19 644 (40.8) 59 (47.6) 703 (41.3)
20 to 29 536 (34.0) 18 (14.5) 554 (32.6)
30 to 39 55 (3.5) 1 (0.8) 56 (3.3)
Best–40 to 50 8 (0.5) 0 8 (0.5)
Missing 259 (16.4) 36 (29.0) 295 (17.3)
(Continued)
International Journal of Chronic Obstructive Pulmonary Disease downloaded from https://www.dovepress.com/ by 118.70.13.36 on 22-Aug-2020
(N= 980), the ADO score was able to discriminate fairly well between patients who died (N= 98) and those who remained alive (AUC= 0.74; 95% CI: 0.69–0.79). Discriminative ability remained consistent for 1-year (N= 1892, 37 died; AUC=0.73; 95% CI: 0.66–0.80) and 2-year (N= 1,876, 93 died; AUC= 0.72; 95% CI: 0.67– 0.76) mortality. Calibration plots showed that the ADO score accurately predicted 3-year mortality (calibration
slope= 0.95; 95% CI: 0.70 to 1.19) but over-prediction was evident in those with higher predicted risks of mor-tality at 1- (0.79; 95% CI: 0.45 to 1.13) and 2-year (0.79; 95% CI: 0.57 to 1.01) time periods. Predictions were also too high (i.e. CITL< 0) at all time-periods; however, these improved as the time periods lengthened. Re-introducing cases that died within a period but with period end dates after the 31 March 2016 only affected the 3-year mortality
Table 2(Continued).
Alive Within 3 Years Of Observation Time (N=1577)
Dead Within 3 Years Of Observation Time (N=124)
Total (N= 1701)
P-Valuea
BMI groups - N (%)
Underweight–0–18.49 kg/m2 25 (1.6) 7 (5.7) 32 (1.9) 0.003
Normal–18.50–24.99 kg/m2 365 (23.2) 35 (28.2) 400 (23.5)
Overweight–25.00–29.99 kg/m2 583 (37.0) 44 (35.5) 627 (36.9)
Obese–30.00 + kg/m2 520 (33.0) 31 (25.0) 551 (32.4)
Missing 84 (5.3) 7 (5.7) 91 (5.4)
Smoking group–N (%)
Never smoker 165 (10.5) 8 (6.5) 173 (10.2) 0.359
Current smoker 428 (27.1) 36 (29.0) 464 (27.3)
Former smoker 873 (55.4) 71 (57.3) 944 (55.5)
Missing 111 (7.0) 9 (7.3) 120 (7.1)
HRQLecategory–N (%)
Low impact–0 to 9 191 (12.1) 19 (15.3) 210 (12.4) 0.006
10 to 19 450 (28.5) 29 (23.4) 479 (28.2)
20 to 29 403 (25.6) 29 (23.4) 432 (25.4)
Severe impact–30 to 40 138 (8.8) 23 (18.6) 161 (9.5)
Missing 395 (25.1) 24 (19.4) 419 (24.6)
Exacerbation in last 12 months–N (%) 830 (52.6) 68 (54.8) 898 (52.8) 0.619
Missing 49 (3.1) 4 (3.2) 53 (3.1)
Cardiovascular disease history–N (%) 823 (52.2) 88 (71.0) 911 (53.6) <0.001
Any cancer–N (%) 192 (12.2) 20 (16.1) 212 (12.5) 0.195
Missing 165 (10.5) 13 (10.5) 178 (10.5)
Asthma–N (%) 611 (38.7) 38 (30.7) 649 (38.2) 0.148
Missing 158 (10.0) 18 (14.5) 176 (10.4)
Osteoporosis–N (%) 119 (7.6) 8 (6.5) 127 (7.5) 0.689
Missing 244 (15.5) 21 (16.9) 265 (15.6)
Depression–N (%) 304 (19.3) 19 (15.3) 323 (19.0) 0.283
Missing 196 (12.4) 16 (12.9) 212 (12.5)
Respiratory hospital admission in previous 12 months–N (%)
66 (4.2) 19 (15.3) 85 (5.0) <0.001
Notes:Missing rows were added only for variables with missing data. Bold denotes statistical significance.a
P-values describe differences in characteristics between cohorts without accounting for missing as a separate category. Chi-square test for categorical data and Student’sT-test for continuous data.b
The Global Initiative for Chronic Obstructive Lung Disease (GOLD) categories of airflow limitation.c
Based on the Index of Multiple Deprivation (IMD) 2010. Lower quintiles indicate more deprivation. d
Assessed using the sit-to-stand test.28 e
Health-related quality of life based on the COPD Assessment Test (CAT).
Abbreviations:FEV1, forced expiratory volume in one second; MRC, medical research council; HRQL, health-related quality of life.
International Journal of Chronic Obstructive Pulmonary Disease downloaded from https://www.dovepress.com/ by 118.70.13.36 on 22-Aug-2020
outcome (N=1,036) and resulted in worse discimination (AUC= 0.71; 95% CI: 0.67-0.76) and calibration (slope= 0.82; 95% CI: 0.62-1.02) (data not shown). An additional sensitivity analysis with only prevalent patients showed similar results for discriminative performance and calibra-tion slopes (Supplementary Table 2). In the complete cases, the calibration slope was decreased to 0.73 at 1-year mortality when compared to the analysis that included all cases. At 3-year mortality, calibration slope increased to 1.08 while discrimination increased to 0.77.
Discussion
In this external validation study in a primary care COPD population which included screen-detected and prevalent cases, we found that the updated ADO score13 was discriminatory with an AUC of 0.74 for predicting 3-year mortality. Discrimination remained stable when predicting 1- and 2-year mortality. However, we found that the ADO score tended to over-predict mortality, especially among the few patients with higher predicted risks of mortality at 1- and 2-year time frames.
Our finding of an AUC of 0.74 is lower than the development model (AUC= 0.85)13 but consistent with estimates from two other studies that validated the ADO score for predicting 3-year mortality, one in primary care (AUC= 0.724, 95% CI: 0.719–0.730; mean FEV1% predicted of participants: 59.5)14 and the other
across multiple healthcare settings (AUC= 0.73, 95% CI: 0.70–0.76; FEV1% predicted 65.9).13 However, a third study used a network meta-analysis to pool data on patients across many healthcare settings and found that the discriminative performance of the ADO score was below 0.70 but still better than nine other prognos-tic scores.15 Our findings are consistent with the results of one primary care study for 1-year (AUC= 0.720; 95% CI: 0.710–0.729) and 2-year (AUC= 0.725; 95% CI: 0.718–0.731) mortality,14 but slightly less accurate than a second study for 2-year (AUC= 0.78; 95% CI: 0.71– 0.84)16 mortality since the upper CI of our 2-year AUC estimate was slightly lower than 0.78.
Accurate calibration is particularly important for evaluating prognostic models because predicted and observed risk need to closely match for predictions to be clinically useful.11 This is the first study that reports the calibration slope of the ADO score when predicting 3-year mortality. In addition to 3-year mortality, predic-tions using shorter time frames are important because clinicians rely on multicomponent prediction models to identify patients nearing the end of life who may benefit from palliative care.29 No other studies have assessed calibration for shorter time periods without adjusting the model. We have shown that over-prediction was more pronounced in patients with higher predicted risks of mortality for these time periods. Thus, our findings
Figure 2Kaplan–Meier plot of survival experience of patients by ADO score group at baseline. ADO score 0 to 5 used as the reference group (N= 1701).
International Journal of Chronic Obstructive Pulmonary Disease downloaded from https://www.dovepress.com/ by 118.70.13.36 on 22-Aug-2020
suggest that recalibration, for example, by using statis-tical shrinkage techniques,30 is needed, in order for the ADO score to better predict mortality over a shorter time frame.
Our study overcomes several limitations found in pre-vious validation studies. For example, we used recom-mended statistical approaches for predicting mortality in a validation study.26Using a research dataset, such as the Birmingham COPD cohort, had the advantage of more accurate and higher quality measurements at prescribed
time points, particularly for spirometry. On the other hand, the Birmingham COPD cohort is not completely representative of all primary care patients with COPD. Ethnic diversity was limited. Additionally, patients needed to be mobile to take part in the cohort study and, therefore, patients with more severe disease who were housebound were more likely to be excluded. Since we used a fixed ratio (based on UK guideline recommendations) instead of a lower limit of normal of FEV1/FVC to define COPD, overdiagnosis may have occurred in older patients.31
Figure 3Area-under-the-curve and calibration plots comparing observed and predicted mortality for incident and prevalent cases.
International Journal of Chronic Obstructive Pulmonary Disease downloaded from https://www.dovepress.com/ by 118.70.13.36 on 22-Aug-2020
However, the ADO score was developed in a population where COPD was defined using thefixed ratio9and using the lower limit of normal could lead to underdiagnosis compared to expert opinion.32 Furthermore, in a study of 24,207 US adults from 4 cohorts, COPD-related hospita-lization and mortality were not significantly different when using thefixed ratio of FEV1/FVC < 0.70 compared to the lower limit of normal to define COPD.33 This indicates that our results would not be very different if we had used a lower limit of normal to define our cohort. We included screen-detected COPD cases who, predictably, had very few deaths. However, other studies have not included screen-detected cases despite at least 50% of the COPD population remaining undiagnosed worldwide.34 It is important to assess the validity of prognostic indices to predict mortality in this population to inform treatment decisions. Finally, a very small number of deceased patients may have had delayed death registration due to a variety of reasons such as suspicious, unexpected, or acci-dental deaths.35In addition to the loss of power (i.e. fewer deaths), if patients were considered alive when they were truly dead, then this would result in weaker prognostic accuracy.
Conclusion
It is well-known that prognostic scores are rarely used in clinical practice for managing people with COPD, especially in primary care.3 Although the ADO score is attractive because of its accurate discriminative ability and ease of measurement and calculation in a primary care setting recali-bration is needed to improve risk prediction for shorter time frames. Currently, when predicting 1- and 2-year mortality, the ADO score may not be accurate in primary care populations because over-prediction was evident, especially in those with higher predicted risks of mortality and people with COPD may be given treatment that is not needed as a result.
Abbreviations
ADO, Age, dyspnoea, and obstruction score; AUC, area-under-the-curve; BLISS, Birmingham Lung Improvement Studies; BMI, body mass index; CITL, Calibration-in-the-large; COPD, chronic obstructive pulmonary disease; CI, confidence interval; FEV1, forced expiratory volume in one second; FVC, forced vital capacity; mMRC, modified Medical Research Council.
Ethics Approval
The cohort received ethical approval from the National Research Ethics Service Committee West Midlands, Solihull (ref.: 11/WM/0304)
Data Availability
STATA code used for data manipulation and analyses can be provided upon request.
Disclaimer
The views expressed are those of the authors and not necessarily those of the NIHR or the Department of Health and Social Care. The Birmingham COPD Cohort study is part of The Birmingham Lung Improvement StudieS–BLISS.
Acknowledgments
We would like to acknowledge the GPs and patients for taking part in BLISS. We would also like to thank our patient advisory group and programme steering committee. We thank the Clinical Research network West Midlands at the University of Birmingham for recruiting the GPs. We thank Alexandra Enocson (University of Birmingham), Sue Jowett (University of Birmingham), Jen Marsh (University of Birmingham), Jon G Ayres (University of Birmingham), Sheila Greenfield (University of Birmingham), Stanley Siebert (University of Birmingham), Amanda Daley (Loughborough University), KK Cheng (University of Birmingham), Richard Riley (Keele University), Martin R Miller (University of Birmingham), Brendan G Cooper (University Hospitals Birmingham), and Kate Jolly (University of Birmingham) for their roles in BLISS. Richard Riley provided statistical advice. Martin R Miller, Robert Stockley (University Hospitals Birmingham), Brendan G Cooper, and Kate Jolly commented on thefinal draft. Finally, we would like to acknowledge all BLISS team members for facilitating the study and conducting the assessment visits.
Author Contributions
All authors contributed to data analysis, drafting and revis-ing the article, gave final approval of the version to be published, and agree to be accountable for all aspects of the work.
International Journal of Chronic Obstructive Pulmonary Disease downloaded from https://www.dovepress.com/ by 118.70.13.36 on 22-Aug-2020
Funding
This work was supported by the National Institute for Health Research (NIHR) under its Programme Grants for Applied Research Programme (grant number: RP–PG– 0109–10061). NIHR had no involvement in the study design, the data collection, analysis, interpretation, writing of the manuscript, or in the decision to submit the article for publication.
Disclosure
FV currently supervises two Ph.D. students who are employed with F. Hoffmann La Roche Ltd. Basel, Switzerland. He has not received any reimbursements for this and the Ph.D. topics are not related to this paper. FMEF reports personal fees from AstraZeneca, personal fees from Boehringer Ingelheim, personal fees from Chiesi, personal fees from GlaxoSmithKline, grants and personal fees from Novartis, grants and per-sonal fees from MedImmune, perper-sonal fees from TEVA, outside the submitted work. AS reports grants from Astra Zeneca, outside the submitted work, grants from NIHR, during the conduct of the study. AMT reports grants from Linde REAL fund, grants from Alpha 1 Foundation, non-financial support from GSK, personal fees and non-financial support from Boehringer Ingelheim, grants, personal fees and non-financial sup-port from Chiesi, grants, personal fees and non-financial support from AstraZeneca, grants from Grifols Biotherapeutics, outside of submitted work, personal fees from CSL Behring, personal fees from Pfizer, dur-ing the conduct of the study. PA, DF, AS, and REJ hold a grant from NIHR (Programme Grant, 2010–2018) that supported the development of the Birmingham COPD Cohort analysed in the submitted paper. PA holds other NIHR grants and is Deputy chair of the NIHR PHR Funding committee. The authors report no other
con-flicts of interest in this work.
References
1. Lozano R, Naghavi M, Foreman K, et al. Global and regional mortal-ity from 235 causes of death for 20 age groups in 1990 and 2010: a systematic analysis for the global burden of disease study 2010.
Lancet. 2012;380(9859):2095–2128. doi:10.1016/S0140-6736(12) 61728-0
2. Decramer M, Janssens W, Miravitlles M. Chronic obstructive pulmon-ary disease.Lancet.2012;379(9823):1341–1351. doi:10.1016/S0140-6736(11)60968-9
3. Moons KGM, Royston P, Vergouwe Y, Grobbee DE, Altman DG. Prognosis and prognostic research: what, why, and how? BMJ.
2009;338(7706):1317–1320. doi:10.1136/bmj.b375
4. Agusti A, Sobradillo P, Celli BR. Addressing the complexity of chronic obstructive pulmonary disease: from phenotypes and biomar-kers to scale-free networks, systems biology, and P4 medicine.Am J Respir Crit Care Med. 2011;183(9):1129–1137. doi:10.1164/ rccm.201009-1414PP
5. Agusti A, Calverley PMA, Celli B, et al. Characterisation of COPD heterogeneity in the ECLIPSE cohort.Respir Res.2010;11(122):1–14.
doi:10.1186/1465-9921-11-1
6. Azarisman MS, Fauzi MA, Faizal MPA, Azami Z, Roslina AM, Roslan H. The SAFE (SGRQ score, air-flow limitation and exercise tolerance) Index: a new composite score for the stratification of severity in chronic obstructive pulmonary disease.Postgrad Med J.
2007;83(981):492–497. doi:10.1136/pgmj.2006.052399
7. Jones RC, Donaldson GC, Chavannes NH, et al. Derivation and validation of a composite index of severity in chronic obstructive pulmonary disease: the DOSE index.Am J Respir Crit Care Med.
2009;180(12):1189–1195. doi:10.1164/rccm.200902-0271OC 8. Divo M, Cote C, De Torres JP, et al. Comorbidities and risk of
mortality in patients with chronic obstructive pulmonary disease.
Am J Respir Crit Care Med. 2012;186(2):155–161. doi:10.1164/ rccm.201201-0034OC
9. Puhan MA, Garcia-Aymerich J, Frey M, et al. Expansion of the prognostic assessment of patients with chronic obstructive pulmonary disease: the updated BODE index and the ADO index. Lancet.
2009;374(9691):704–711. doi:10.1016/S0140-6736(09)61301-5 10. Celli B, Cote C, Marin JM, et al. The body-mass index, airflow
obstruction, dyspnea, and exercise capacity index in chronic obstruc-tive pulmonary disease. N Engl J Med. 2004;350(10):1005–1012. doi:10.1056/NEJMoa021322
11. Cook NR. Statistical evaluation of prognostic versus diagnostic mod-els: beyond the ROC curve. Clin Chem. 2008;54(1):17–23. doi:10.1373/clinchem.2007.096529
12. Haile SR, Guerra B, Soriano JB, Puhan MA. Multiple score compar-ison: a network meta-analysis approach to comparison and external validation of prognostic scores.BMC Med Res Methodol. 2017;17 (1):172. doi:10.1186/s12874-017-0433-2.
13. Puhan MA, Hansel NN, Sobradillo P, et al. Large-scale international validation of the ADO index in subjects with COPD : an individual subject data analysis of 10 cohorts. BMJ Open. 2012;2::e002152. doi:10.1136/bmjopen-2012-002152
14. Morales DR, Flynn R, Zhang J, Trucco E, Quint JK, Zutis K. External validation of ADO, DOSE, COTE and CODEX at predict-ing death in primary care patients with COPD uspredict-ing standard and machine learning approaches. Respir Med. 2018;138:150–155. doi:10.1016/j.rmed.2018.04.003
15. Guerra B, Haile SR, Lamprecht B, et al. Large-scale external valida-tion and comparison of prognostic models: an applicavalida-tion to chronic obstructive pulmonary disease. BMC Med. 2018;16(1):1–13.
doi:10.1186/s12916-018-1013-y
16. Abu Hussein N, Ter Riet G, Schoenenberger L, et al. The ADO index as a predictor of two-year mortality in general practice-based chronic obstructive pulmonary disease cohorts.Respiration.2014;88(3):208– 214. doi:10.1159/000363770
17. James GD, Donaldson GC, Wedzicha JA, Nazareth I. Trends in management and outcomes of COPD patients in primary care, 2000–2009: a retrospective cohort study. NPJ Prim CARE Respir Med.2014;24:14015. doi:10.1038/npjpcrm.2014.15
18. Moons KGM, Altman DG, Reitsma JB, et al. Transparent reporting of a multivariable prediction model for individual prognosis or diag-nosis (TRIPOD): explanation and elaboration. Ann Intern Med.
2015;162(1):W1–73.. doi:10.7326/M14-0698
19. Adab P, Fitzmaurice DA, Dickens AP, et al. Cohort profile: the Birmingham Chronic Obstructive Pulmonary Disease (COPD) cohort study. Int J Epidemiol. 2016;46(1):dyv350. doi:10.1093/ ije/dyv350
International Journal of Chronic Obstructive Pulmonary Disease downloaded from https://www.dovepress.com/ by 118.70.13.36 on 22-Aug-2020
20. Jordan RE, Adab P, Sitch A, et al. Targeted casefinding for chronic obstructive pulmonary disease versus routine practice in primary care (TargetCOPD): a cluster-randomised controlled trial.Lancet Respir Med.2017;4(9):720–730. doi:10.1016/S2213-2600(16)30149-7 21. Bestall JC, Paul EA, Garrod R, Garnham R, Jones PW, Wedzicha JA.
Usefulness of the Medical Research Council (MRC) dyspnoea scale as a measure of disability in patients with chronic obstructive pulmonary disease.Thorax.1999;54(7):581–586. doi:10.1136/thx.54.7.581 22. Quanjer PH, Stanojevic S, Cole TJ, et al. Multi-ethnic reference
values for spirometry for the 3–95-yr age range: the global lung function 2012 equations. Eur Respir J. 2012;40(6):1324–1343. doi:10.1183/09031936.00080312
23. NHS. NHS Digital- Quality and Outcomes Framework.
24. White IR, Royston P, Wood AM. Multiple imputation using chained equations : issues and guidance for practice. Stat Med. 2011;30 (4):377–399. doi:10.1002/sim.4067
25. Altman DG, Bland JM. Statistics Notes: diagnostic tests 3: receiver operating characteristic plots. BMJ. 1994;309:188. doi:10.1136/ bmj.309.6948.188
26. Steyerberg EW, Vickers AJ, Cook NR, et al. Assessing the perfor-mance of prediction models : a framework for some traditional and novel measures. Epidemiology. 2010;21(1):128–138. doi:10.1097/ EDE.0b013e3181c30fb2.
27. Marshall A, Altman DG, Holder RL, Royston P. Combining estimates of interest in prognostic modelling studies after multi-ple imputation: current practice and guidelines. BMC Med Res Methodol.2009;9:57. doi:10.1186/1471-2288-9-57
28. Wretenberg P, Arborelius UP. Power and work produced in differ-ent leg muscle groups when rising from a chair. Eur J Appl Physiol Occup Physiol.1994. doi:10.1007/BF00843738
29. Smith LJE, Moore E, Ali I, Smeeth L, Stone P, Quint JK. Prognostic variables and scores identifying the end of life in COPD: A systema-tic review. Int J COPD. 2017;12:2239–2256. doi:10.2147/COPD. S137868
30. Copas JB. Regression, Prediction and Shrinkage.J R Stat Soc Ser B.
1983. doi:10.2307/2345402
31. Il HY, Kim CH, Kang HR, et al. Comparison of the prevalence of chronic obstructive pulmonary disease diagnosed by lower limit of normal andfixed ratio criteria.J Korean Med Sci.2009;24(4): 621– 626. doi:10.3346/jkms.2009.24.4.621
32. Güder G, Brenner S, Angermann CE, et al. GOLD or lower limit of normal definition? A comparison with expert-based diag-nosis of chronic obstructive pulmonary disease in a prospective cohort-study.Respir Res.2012;13(1):13. doi:10.1186/1465-9921-13-13
33. Bhatt SP, Balte PP, Schwartz JE, et al. Discriminative accuracy of FEV1:FVC thresholds for COPD-related hospitalization and
mortal-ity.JAMA.2019;321(24):2438–2438. doi:10.1001/jama.2019.7233 34. Haroon S, Adab P, Riley RD, Fitzmaurice D, Jordan RE. Predicting
risk of undiagnosed COPD: development and validation of the TargetCOPD score.Eur Respir J.2017;49(6):1602191. doi:10.1183/ 13993003.02191-2016
35. Office for National Statistics. Impact of registration delays on mor-tality statistics.Natl Arch.2011;2011:94–95.
International Journal of Chronic Obstructive Pulmonary Disease
Dove
press
Publish your work in this journal
The International Journal of COPD is an international, peer-reviewed journal of therapeutics and pharmacology focusing on concise rapid reporting of clinical studies and reviews in COPD. Special focus is given to the pathophysiological processes underlying the disease, inter-vention programs, patient focused education, and self management
protocols. This journal is indexed on PubMed Central, MedLine and CAS. The manuscript management system is completely online and includes a very quick and fair peer-review system, which is all easy to use. Visit http://www.dovepress.com/testimonials.php to read real quotes from published authors.
Submit your manuscript here:https://www.dovepress.com/international-journal-of-chronic-obstructive-pulmonary-disease-journal
International Journal of Chronic Obstructive Pulmonary Disease downloaded from https://www.dovepress.com/ by 118.70.13.36 on 22-Aug-2020