BRAIN STROKE CLASSIFICATION BASED ON
MULTI-LAYER PERCEPTRON USING WATERSHED
SEGMENTATION AND GABOR FILTER
1C. AMUTHA DEVI, 2 Dr. S. P. RAJAGOPALAN
1
Asst. Professor, PERI Institute of Technology, Chennai, Tamilnadu, INDIA
2
Professor, GKM College of Engineering, Chennai, Tamilnadu, INDIA E-mail: [email protected], [email protected]
ABSTRACT
Stroke is a cardiovascular disease that occurs whenever blood supply to the brain is stopped. For the diagnosis of the brain strokes, characterization of the progress of the disease and monitoring the treatment therapies, neuro-imaging techniques in the form of Magnetic Resonance Images (MRI) are widely used. Accurate segmentation and classification of stroke affected regions are essential for correct detection and diagnosis. Image classification is a critical step for high-level processing of automatic brain stroke classification. In this paper, a method is proposed for classifying the MRI images into stroke and non-stroke images. Features are extracted using Watershed segmentation and Gabor filter. The extracted features are classified using Multilayer Perceptron (MLP). Experiments have been conducted to evaluate the efficiency of the proposed method with varying number of features.
Keywords: Infarction, Stroke Classification, Magnetic Resonance Imaging (MRI), Watershed, Gabor filter, Multilayer Perceptron (MLP)
1. INTRODUCTION
Infraction refers to tissue death caused whenever blood supply to the tissues are interrupted. Any tissue of the human body may be affected by the infarction. Based on the tissue affected infarctions are named as Myocardial infarction, Cerebral Infraction, Retinal infarction, Limb infarction, Splenic infarction, etc. Cerebral infarction takes place when the blood supply to the brain tissues is interrupted. Cerebral infraction is otherwise called as Brain attack. Disturbance in blood supply may occur because of blockage in a delivering artery, a rupture of an artery or compression of an artery due to a tumor. Brain infarction is often associated with high blood pressure. If blood flow is blocked for several minutes, the brain is deprived of blood and oxygen, so brain cells begin to die at a rate of 12 million cells per minute, causing permanent damage.
Infarction leads to stroke. Stroke is a cardiovascular disease occurs when blood supply to brain is interrupted [1]. During this period blood cells stop their functioning temporarily. There are two major types of stroke: ischemic stroke and hemorrhagic stroke [2]. Hemorrhagic stroke occurs when there is a sudden rupture in blood vessels
supplying blood to the brain. Ischemic stroke occurs when a blood clot blocks the artery supplying blood to the brain. This may happen in two ways:
• Thrombotic stroke is caused by clot in an already narrow artery. The artery becomes narrow due to plaque which is a sticky substance collected on the wall of the artery due to fat, cholesterol and other substances.
• Embolic stroke is caused by clots which have broken off from a blood vessel in the brain, or from some other part of the body.
Accurate segmentation and classification of stroke affected regions is essential for correct detection and diagnosis. This process is done by well experienced radiologists but still it is a challenging task because of time consumption and inter and intra subject variability. Correct prediction also depends on the expert’s domain knowledge. For example, segmentation of brain regions to find abnormal regions by experts has variability from 14 to 22 % approximately [8].
Some of the segmentation methods are based on thresholding, region growing, clustering, artificial networks, deformable models, atlas guided approaches and watershed segmentation [9, 10]. Automated methods are helpful to make a quick decision by the radiologists. Feature extraction and selection also places an important role in classifying regions into stroke and non-stroke. Selecting suitable variable is important for successful implementation of an image classification.
Artificial Neural Networks (ANNs) are widely applied for functions such as approximation, feature extraction, and classification [11]. Image processing methods such as enhancing of an image, registration, segmentation, feature extraction, and recognition and classification also use ANNs [12]. In a high-level processing such as brain tumor classification, object recognition and image classification steps are critical. Thus, ANN is used for classification in this study.
In this work it is proposed to study the automatic classification of MRI images into stroke and non-stroke images. The proposed method extracts features from the MRI brain images using Watershed segmentation and Gabor filter. Feature reduction is accomplished using Information Gain (IG). Top 20, 40, 60, 80, 100, 140 and 160 features are extracted for classification. Multilayer Perceptron (MLP) is used to classify the extracted features.
2. LITERATURE REVIEW
Bala presented an Improved Watershed Image Segmentation Technique [13]. In mathematical morphology, Watershed Transformation is a powerful tool for image segmentation. Watershed transformation was based on edge detection algorithms and used gradient operators. But it suffered from over segmentation. To avoid over segmentation image enhancement and noise removal techniques with the Prewitt’s edge
detection operator were introduced. When evaluating the results of segmentation this method showed more accurate segmentation results and reduced the problem of over segmentation.
Kailashet et al presented Brain Tumor Classification Using Neural Network Based Methods [14]. Classification of MRI images was a challenging task because of variance and complexity of brain lesions. Two Neural Network techniques were used for the classification of the MR brain images. Features were extracted using discrete wavelet transformation (DWT). Then the number of features was reduced by using principles component analysis (PCA) to the more essential features. During classification two classifiers were based on supervised machine learning used. One was feed forward artificial neural network (FF-ANN) and the second classifier was Back-Propagation Neural Network. The classifiers were used to classify the subjects as normal or abnormal MRI brain images.
Bagher-Ebadian et al [15] presented methods for predicting the extent of Ischemic Infarction based on ANN. The final size of the ischemic lesion is important in hemispheric ischemic stroke to correlate clinical functional outcome. A set of acute-phase MR images were used as inputs to ANN to predict the outcome measure in 3 months. The ANN was trained and tested using 12 subjects. On training, the ANN was able to produce maps of predicted outcome that were well correlated. Thus, an ANN can be efficiently trained to provide an estimate of 3-month ischemic lesion.
Shanthi et al [16] investigated the effectiveness of ANN for predicting the Thrombi-embolic stroke disease. The proposed ANN was evaluated for various types of stroke. Back propagation algorithm was used for training the ANN. Experimental results demonstrated that the classification of stroke using the proposed method was satisfactory, achieving an overall predictive accuracy of 88.5%.
Golovko et al [23] proposed integration of nonlinear principal component analysis (NPCA) neural network and MLP for identifying transient ischemic attacks. The proposed method was evaluated using the clinical observation of 114 patients. A recognition accuracy of 78% for the testing dataset was achieved.
3. METHODOLOGY
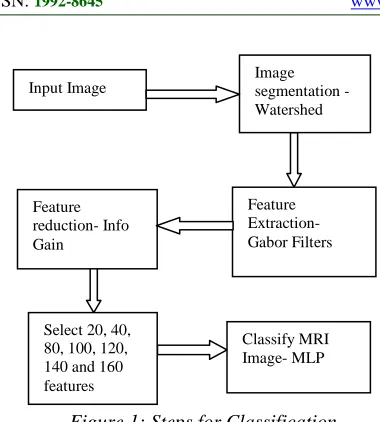
Figure 1: Steps for Classification
The brain MRI image to be classified is segmented with Watershed algorithm and the features are extracted using Gabor filter. Features are selected using Info-gain. Varying number of features is selected (20, 40, 60, 80, 100,120,140 and 160) and used to classify the image as stroke and non-stroke by the MLP.
Watershed is the segmentation algorithm based on edge detection [17]. A watershed refers to a basin-like landform with distinct ridgelines descending into lower elevations. The homogeneous regions in an image have low gradient values and edges have high gradient values. If an image surface is flooded from its minima, the image is segmented into two different sets representing the catchment basins and the watershed lines. The catchment basins refer to the homogeneous grey level regions of the image and the watershed lines are the edges.
Watershed transformation is a powerful segmentation process due to its simplicity, speed and complete division of the image [18]. It produces closed contours even for images with low contrast and weak boundaries. The main problem of watershed transform is its sensitivity to intensity variations, resulting in over segmentation, which occurs when the image is segmented into an unnecessarily large number of regions [19].
Gabor filters are linear filters used for edge detection [20]. As the frequency and orientation of Gabor filters are similar to the human visual system, it is advantageously applied to texture representation and discrimination. A 2D Gabor filter is a Gaussian kernel function modulated by a sinusoidal plane wave in the spatial domain. All the Gabor filters are self-similar and are generated from
one mother wavelet by dilation and rotation. Features are extracted using a set of Gabor filters with different frequencies and orientations.
The one-dimensional Gabor filter is defined as the Multiplication of a cosine/sine (even/odd) wave with Gaussian windows as follows [21],
Where w0 defines the centre frequency and σ is
the spread of the Gaussian window. The features extracted using watershed algorithm and Gabor filter are ranked based on its information gain value. Higher values of information gain indicate the infomativeness of the feature. In this study, after ranking the features, the top 20, 40, 60, 80, 100,120,140 and 160 features are selected as the feature set and utilized for classification.
Multilayer Perceptron (MLP) consists of multiple layers of computational units, interconnected in a feed-forward way. Perceptron from each layer is connected to the perceptron of the successive layer [22]. In this study, the number of neurons in the input layer depends on the number of features. Thus, the number of input neurons varies from 20 to 160. The MLP consists of one hidden layer, and consists of 50% of the input neurons i.e., 10 to 80 neurons. The input values are mapped into output values using activation functions.
Sigmoidal function is used in this study. The activation function for sigmoidal function is given as follows:
The output values range from 0 to 1.
[image:3.612.322.483.175.240.2]MLPs use an assortment of learning techniques; the most popular one is back-propagation. During training, the output values are compared with actual values to compute the value of the error. The error is then back propagated through the network, during which the algorithm adjusts the weights of each connection to reduce the value of the error. This process is repeated for a number of training cycles, the network converges to a state where the error is small. Thus, the MLPs are trained to classify the images. Table 1 gives the architecture of the MLP used in this study.
Table 1 Architecture of the MLP
Feature Extraction- Gabor Filters Input Image
Classify MRI Image- MLP
Image segmentation - Watershed
Feature reduction- Info Gain
Number of neurons in input layer
20, 40, 60, 80, 100,120,140,160
Number of neurons in hidden layer
10, 20, 30, 40, 50,60,70,80
Number of hidden layers 1
Number of neurons in output layer 2
Learning rate 0.1
Momentum 0.2
Activation function used
Sigmoid in both hidden and output layer
Number of epochs 500
4. RESULTS AND DISCUSSION
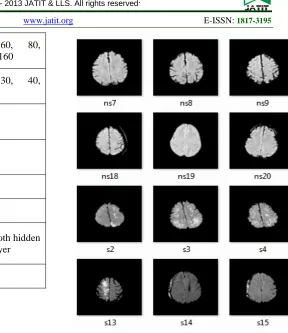
[image:4.612.250.538.61.394.2]To evaluate the efficiency of the proposed method, a dataset of 52 DWI scan images are complied. The images were procured from the MRI Department of Vijaya Health Centre, India. Of the 52 images, 25 images are of positive stroke images. Experts in the radiology department have reviewed the dataset for precise classification of patients with stroke. Figure 2 shows some of the MRI images used in the current study.
Figure 2: Sample MRI images used in the study
[image:4.612.309.525.511.689.2]Experiments were conducted using varying number of features. Sigmoid activation function of MLP was used to evaluate the effectiveness of classification of the stroke images. Table 2 gives the classification accuracy and Root Mean Squared Error (RMSE) obtained.
Table 2: Classification Accuracy and Root Mean Squared Error
Number of Features
Classification Accuracy %
RMSE
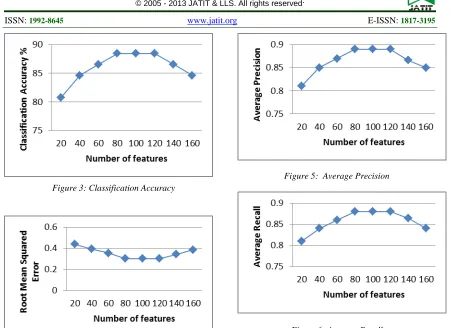
Figure 3: Classification Accuracy
Figure 4: Root Mean Squared Error
It is observed from figure 3 that the best classification performance is achieved by sigmoidal function with 80, 100 and 120 features. Classification accuracy of 88.46 % was achieved with low RMSE. It is also seen that with the increase in number of features the classification accuracy reduces.
Table 3 gives the precision and recall achieved for the varying number of features.
Table 3: Precision and Recall achieved
Number of Features
Precision Recall
20 0.81 0.81 40 0.85 0.84 60 0.87 0.86 80 0.89 0.88 100 0.89 0.88 120 0.89 0.88 140 0.866 0.864 160 0.85 0.84
Figure 5 and 6 shows the precision and recall curve.
Figure 5: Average Precision
Figure 6: Average Recall
The precision and recall is the highest when the number of features is 80, 100 and 120 as seen from figure 5 and 6.
The classification accuracy achieved from the proposed method is satisfactory when compared with the works available in the literature [16, 23]. This study used a small training set to train the neural network. It is required to use a larger dataset to avoid processing errors due to image quality, image deformation or artifacts which can affect the neural networks efficiency.
5. CONCLUSION
This study proposes a method for classification of MRI brain image as stroke and non-stroke. The proposed method extracts features from the MRI brain images using Watershed segmentation and Gabor filter. Feature reduction is accomplished by ranking features using Information gain. The top 20, 40, 60, 80,100,120,140 and 160 features are used for classification. Multilayer Perceptron (MLP) is used to classify the extracted features.
Results show that the best classification performance is achieved by sigmoidal function with 80 to 120 features with low root mean square error and high precision.
Future work aims to optimize the number of features to improve accuracy in classification. Further work is required to detect and classify different types of strokes such as chronic infarcts, hemorrhages and so on.
REFRENCES:
[1]. M.Lawrence, and M.D.Brass, “Stroke“, chapter 18 , www.iristrial.org .
[2] S. Runchey, and S. McGee, “Does This Patient Have a Hemorrhagic Stroke? ” JAMA: the journal of the American Medical Association, 2010, 303(22), 2280-2286.
[3] I.Dzialowski, M.D.Hill, S.B.Coutts,
A.M.Demchuk, D.M.Kent, O.Wunderlich, and R.Von Kummer, “ Extent of Early Ischemic Changes on Computed Tomography (CT) Before Thrombolysis Prognostic Value of the Alberta Stroke Program Early CT Score in ECASS II. Stroke”, 2006, 37(4), 973-978.
[4] R.N.Bryan, L.M.Levy, W.D.Whitlow,
J.M.Killian, T.J.Preziosi,and J.A. Rosario, ”Diagnosis of acute cerebral infarction: comparison of CT and MR imaging” , American journal of neuroradiology, 1991, 12(4), 611-620.
[5] P.C.Sundgren, Q.Dong, D.Gomez-Hassan,
S.K.Mukherji, P.Maly, and R.Welsh, “Diffusion tensor imaging of the brain: review of clinical applications. Neuroradiology” 2004, 46(5), 339-350.
[6] M.F.Othman, N.B.Abdullah, and N.F.B.Kamal, ” MRI brain classification using support vector machine” In Modeling, Simulation and Applied Optimization (ICMSAO), 4th International Conference on (pp. 1-4). IEEE, April 2011. [7] G.José Merino, and Steven Warach, “ Imaging
of acute stroke”, National Institute of Neurological Disorders and Stroke, National Institutes of Health, Bethesda, MD 20892, USA, September 2010.
[8] A.Guiler, A.Demihran, and Karkais,
“Interpretation of MR Images using self-organizing Maps and Knowledge based expert systems “, Elsevier, Journal of digital Signal Processing, vol.19, pp.668-677, 2009.
[9] D.L.Pham, C.Xu, and J.L.Prince, “Current methods in medical image segmentation”,
Annual review of biomedical engineering, 2(1), 315-337, 2000.
[10] N.Sharma, and L.M.Aggarwal, “Automated medical image segmentation techniques”, Journal of medical physics/Association of Medical Physicists of India, 2010, 35(1), Vol 3.
[11] K.J.Hunt, D.Sbarbaro, R.Żbikowski, and
P.J.Gawthrop, “Neural networks for control systems—a survey”, Automatica, 1992, 28(6), 1083-1112.
[12] M.J.Moghaddam, and H.Soltanian-Zadeh,
“Medical Image Segmentation Using Artificial Neural Networks”, Artificial Neural Networks-Methodological Advances and Biomedical Applications, 2011, 121-138.
[13] Anju Bala “An Improved Watershed Image Segmentation Technique using MATLAB”, International Journal of Scientific & Engineering Research Volume 3, Issue 6, June-2012.
[14] D.Kailash Kharat, Pradyumna P.Kulkarni and M.B.Nagori, “Brain Tumor Classification Using Neural Network Based Methods”, International Journal of Computer Science and Informatics ISSN (PRINT): 2231 –5292, Vol-1, Iss-4, 2012.
[15] H.Bagher-Ebadian , K.Jafari-Khouzani,
P.D.Mitsias , Lu M, H.Soltanian-Zadeh et al. “Predicting Final Extent of Ischemic Infarction Using Artificial Neural Network Analysis of Multi-Parametric MRI in Patients with Stroke” PLoS ONE, 2011, 6(8): e22626.
[16] D.Shanthi, G.Sahoo, and N.Saravanan,
“Designing an artificial neural network model for the prediction of thrombo-embolic stroke”, International Journals of Biometric and Bioinformatics (IJBB), 2009, 3(1), 10-18.
[17] S. Beucher, and C. Lantu Tjoul, “Use of watersheds in contour detection”, In the Proceedings of International Workshop on Image Processing, Real-time Edge and Motion Detection/Estimation, vol. 132, 1979, pp. 2.1– 2.12.
[18] J.B.T.M. Roerdink, and A. Meijster, “The watershed transform: definitions, algorithms and parallelization strategies”, Fundamental Informaticae , 2000, 187–228.
[19] Rash Bihari, Madasu Hanmandlu, , Suresh K. Gupta, and Sushil K. Gupta, “The Brain MR Image Segmentation Techniques and use of Diagnostic Packages” , AcadRadiol, 2010. [20] D.Stork, and H.Wilson, “Do Gabor functions
cortical receptive fields?” Journal of the Optical Society of America-A, 1990,7(9), 1362–1373. [21] J.Daugman, “Two-dimensional analysis of
cortical receptive field profiles”, Vision Research, 1980, Vol 20, 846–856.
[22] D.Svozil, V.Kvasnicka, and J.Pospichal,
“Introduction to multi-layer feed-forward neural
networks”, Chemometrics and intelligent
laboratory systems, 1997, 39(1), 43-62.
[23] V.Golovko, H.Vaitsekhovich, E.Apanel, and A.Mastykin, “Neural network model for transient ischemic attacks diagnostics”, Optical Memory and Neural Networks, 2012, 21(3), 166-176.