UGC Approved Sr. No.49366, MAR–APR, 2018, VOL- 5/44
Copyright © 2018, Scholarly Research Journal for Interdisciplinary Studies ECOLOGICAL FOOTPRINT AND SPIRITUAL INTELLIGENCE: A CORRELATIONAL STUDY
Ms. Geeta S. Thakur
Asst. Prof. , MES‟ Pillai College of Education and Research, New Panvel
“Ecology and spirituality are fundamentally connected because deep ecological awareness, ultimately, is spiritual awareness.”-Fritjov Capra
Life is essentially a relationship between living organism and its environment; an environment which provides us with all our needs. It is this underlying principle that exists behind the need to conserve and preserve our natural environment, since the very existence of mankind depends on it. The present study was aimed at establishing relationship of ecological footprint of the student teachers with their emotional quotient. Descriptive correlational research method was used to ascertain this relationship between the variables and the extent to which they were related. The sample for the present study comprised of student teachers pursuing Diploma in elementary education from colleges affiliated to Maharashtra State Council of Examination and Bachelor of Education and Master of Education degree from the colleges affiliated to the University of Mumbai. The sample size for the study was 1465 student teachers. The tool employed the studying the ecological footprint was constructed with the help of inputs from “Personal Eco-Footprint Calculator” given by Tim Turner in his paper „How big is my Ecological footprint‟ and Global Footprint Network. Changes were made to suit the requirement of the study. Spiritual quotient was studied using „The Spiritual Intelligence Self-Report Inventory or the SISRI-24‟ tool constructed by Dr. David B. King (2008). The data obtained was subjected to statistical analysis and correlation between the two variables was established using the „Pearson‟s Product-Moment coefficient of correlation‟. A negative linear correlation was found between the ecological footprint of student teachers with their spiritual quotient with respect to gender and location of college.
Keywords: Spiritual quotient (SQ) and Ecological footprint (EF)
Introduction: 1
As per the Global Ecological Footprint data, humanity is using resources and
producing CO2 emissions at a rate of 60 percent higher than what nature can regenerate and
reabsorb. This gap has resulted in the deterioration of the natural environment on which all
the species depend upon for their survival. Nature has a natural capacity to get back to its
original form gradually over a period of time, however the vigorous activities of mankind has
overpowered and interfered with this natural activity of nature. Natural calamities have
1
http://www.footprintnetwork.org/en/index.php/GFN/page/the_footprint_and_biodiversity/
(Pg. 9834-9842)
Copyright © 2018, Scholarly Research Journal for Interdisciplinary Studies
become more common and frequent from the past few years. Damage to all forms of life can
be seen in all these cases.
We fail to understand how much is needed, how much we are using and how much
we have that is left for use. In order to find out this information, „Ecological Footprint‟ (EF) has emerged as the world‟s premier measure of humanity‟s demand on nature. A person's
ecological footprint is an estimation of the amount of land required to sustain a person based
on their current lifestyle. It expresses the consumption pattern of an individual to maintain a
particular life style. It mainly focuses on the consumption of energy, water and other
commodities, food habits and processing of domestic waste and recycling. It is assumed that
a higher standard of living reflects higher ecological footprint.
The solutions to all the environmental problems needs to be solved with all these three
„Hs‟; Heart to empathize, Head to think and Hand to convert thoughts into actions. Man‟s
actionsare governed by their spiritual inclination or intelligence. The measure of one‟s
spiritual intelligence is termed as2spiritual quotient which is the ultimate intelligence with
which we address and solve problems of meaning and value, the intelligence with which we
can place our action and our lives in wider, richer meaningful context, the intelligence with
which we can assess the course of one‟s action.
The crux of the study is that, an individual with high Spiritual quotient will have
concern for the environment and exhibit love, care, preservation, conservation and empathy
for the environment.
The individuals will judiciously utilize resources and will consume less with a
mind-set of Reuse, Reduce and Recycle, thereby, leading a better life with a reduced Ecological
Footprint. Education is the best vehicle to transmit the ethics and values towards life and
environment and teachers play a fundamental role in the imbibing spiritual and environmental
values among the students.
Objectives of the study:
1. To study the ecological footprint and spiritual quotient of student teachers.
2
http://danahzohar.com/ Higher spirituality
Increased Environmental
concern
Reduced Ecological
footprint
(Pg. 9834-9842)
Copyright © 2018, Scholarly Research Journal for Interdisciplinary Studies
2. To study the relationship between ecological footprint and spiritual quotient of student
teachers.
3. To study the correlation between the ecological footprint of student teachers and their
spiritual quotient with respect to gender and location of the college.
Hypotheses of the study:
1. There is no significant relationship between the ecological footprint of student teachers
and their spiritual quotient.
2. There is no significant relationship between the ecological footprint of student teachers
and their spiritual quotient with respect to gender and location of the college.
Methodology:
The present study was aimed at establishing relationship of ecological footprint of the
teachers with their spiritual quotient. Descriptive correlational research design was used to ascertain the relationship between the variables and the extent to which they were related.
Sampling, Sample and Sample Size:
For the present study stratified random sampling technique was used. The samples
were the student teachers pursuing Diploma in Elementary Education from colleges affiliated
to Maharashtra State Council of Examination and Bachelor and Master of Education from
colleges affiliated to the University of Mumbai. The total sample size was 1465 student
teachers.
Tools:
The tool employed for studying the ecological footprint was constructed with the help
of inputs from “Personal Eco-Footprint Calculator” given by Tim Turner in his paper 3„How big is my Ecological footprint‟ and from 4
Global footprint network. Changes were made in
the tool to suit the requirement of the study. The tool was validated by experts in the field of
education and environment. Reliability of the tool was calculated using the split half method
and the reliability index(𝜌) of the tool was 0.95. Spiritual quotient was studied using The Spiritual Intelligence Self-Report Inventory or the SISRI-24 tool constructed by Dr. David B. King (2008).The reliability of the scale obtained by the split half method was 0.91.
3
http://www.earthrangers.org/wp-content/uploads/2016/08/how_big_is_my_ecological_footprint.pdf
4
(Pg. 9834-9842)
Copyright © 2018, Scholarly Research Journal for Interdisciplinary Studies Analysis of the data and interpretation:
Pearson‟s product moment coefficient of correlation was used to establish correlation
between the scores of the ecological footprint of student teachers with the score of
theirspiritual quotient.
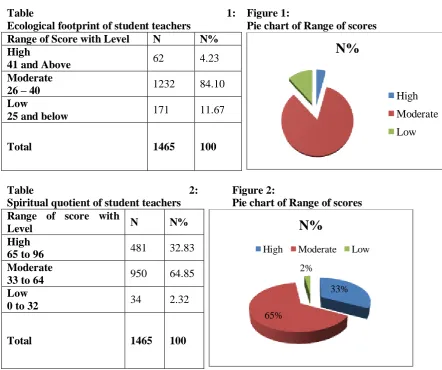
Table 1:
Ecological footprint of student teachers
Figure 1:
Pie chart of Range of scores Range of Score with Level N N%
High
41 and Above 62 4.23 Moderate
26 – 40 1232 84.10 Low
25 and below 171 11.67
Total 1465 100
Table 2:
Spiritual quotient of student teachers
Figure 2:
Pie chart of Range of scores Range of score with
Level N N% High
65 to 96 481 32.83 Moderate
33 to 64 950 64.85 Low
0 to 32 34 2.32
Total 1465 100
From Table no. 1 and 2 it is clearly evident that most of the student teachers possess
[image:4.595.77.520.157.527.2]moderate level of ecological footprint and lie in the moderate range of spiritual quotient.
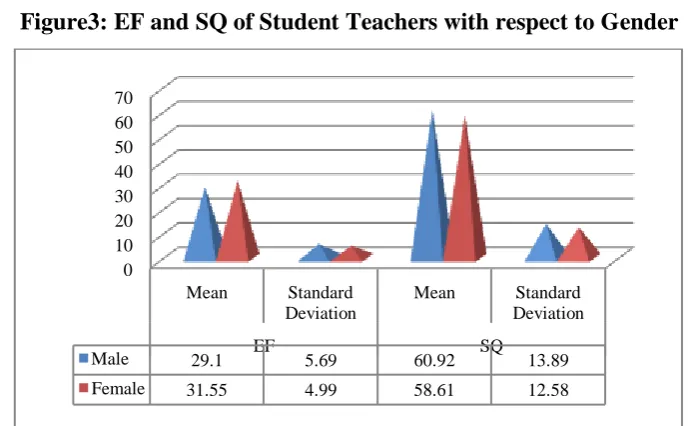
Table 3: EF and SQ of Student Teachers with respect to Gender
Variables
Gender N
EF SQ
Mean Standard
Deviation Mean Standard Deviation
Male 86 29.10 5.69 60.92 13.89
Female 1379 31.55 4.99 58.61 12.58
N%
High
Moderate
Low
33%
65% 2%
N%
[image:4.595.96.503.590.657.2](Pg. 9834-9842)
Copyright © 2018, Scholarly Research Journal for Interdisciplinary Studies Figure3: EF and SQ of Student Teachers with respect to Gender
The mean value and standard deviation of ecological footprint of male student
teachers was 29.1 and 5.69 respectively while those of female student teachers were31.55 and
4.99 respectively. The mean values and standard deviation of spiritual quotient of male
student teachers were60.92 and 13.89 and while those of female student teachers were 58.61
and 12.58 respectively.
From the above data we may infer that male students have a higher spiritual quotient
than female student teachers and thereby lower ecological footprint while female student
[image:5.595.123.472.77.290.2]teachers have a lower spiritual quotient and therefore a higher ecological footprint.
TABLE 4: EF and SQ ofStudent Teachers with respect to the location of their college
Variables Gender N
EF SQ
Mean Standard
Deviation Mean
Standard Deviation
Urban 817 32.25 5.05 57.38 12.74
Semi Urban
648 30.35 4.88 60.46 12.36
0 10 20 30 40 50 60 70
Mean Standard Deviation
Mean Standard Deviation
EF SQ
(Pg. 9834-9842)
Copyright © 2018, Scholarly Research Journal for Interdisciplinary Studies
FIGURE4: EF and SQ ofStudent Teachers with respect to the location of their college
The mean value and standard deviation of ecological footprint of the student teachers
belonging to urban areas was 32.25 and 5.05 respectively while that belonging to semi urban
areas was 30.35 and 4.88 respectively. The mean value and standard deviation of spiritual
quotient of student teachers belonging to urban areas was 57.38 and 12.74 while that
belonging to semi urban areas was 60.46 and 12.36 respectively.
From the above data we can infer that the students whose colleges are located in
urban areas have a low spiritual quotient and high ecological footprint while those whose
colleges are located in semi urban areas have high spiritual quotient and low ecological
footprint.
H0 1: There is no significant relationship between the ecological footprints of student
teachers with their spiritual quotient.
TABLE 5: Correlation between EFand SQ of Student Teachers
Variables EF SQ
EF 1
SQ -0.13734 1
From table 5: The obtained value of correlation „r‟ between the ecological footprint of
student teachers with their spiritual quotient was -0.13734 (table value of r is 0.114 at 0.01
level of significance) which is higher than the table value of „r‟. The negative value of „r‟
indicates a negative correlation, i.e. if spiritual quotient of student teachers increases then
their ecological footprint decreases and vice versa. The higher value obtained indicates there
is a relationship between the two variables therefore the null hypothesis is rejected at 0.01
level of significance. Thus, there is a significant relationship between the ecological footprint
of student teachers and their spiritual quotient. 0
10 20 30 40 50 60 70
Mean Standard Deviation
Mean Standard Deviation
EF SQ
Urban 32.25 5.05 57.38 12.74
(Pg. 9834-9842)
Copyright © 2018, Scholarly Research Journal for Interdisciplinary Studies
H02 a: There is no significant relationship between the ecological footprint of student
teachers and their spiritual quotient with respect gender.
TABLE 6 CORRELATION BETWEEN EF AND SQ: GENDER Gender
Variables
Male Female
df ‘r’ value df ‘r’ value
EF and SQ 84 -0.2211 1377 -0.12663
The correlation between the ecological footprint and spiritual quotient of male and
female student teachers was found to be -0.2211 (table value of r=0.2120) and
-0.12663 (table value of r=0.087) respectively. The obtained value of r is higher than the table
value of r in case of both male and female student teachers indicating a weak correlation
between the variables. A negative correlation is also found in both cases which means that
when the spiritual quotient of student teachers increases then their ecological footprint
decreases and vice versa. Since a significant correlation exists between the variables,
therefore the null hypothesis was rejected at 0.05 level of significance.There is significant
relationship between the ecological footprint of student teachers and their spiritual quotient
with respect gender.
H0 2 b: There is no significant relationship between the ecological footprint of student
teachers and their spiritual quotient with respect to the location of the college.
TABLE 7: CORRELATION BETWEEN EF AND SQ: LOCATION OF THEIR COLLEGE
Location Variables
Urban Semi Urban
df ‘r’ value df ‘r’ value
EF and SQ 815 -0.11782 646 -0.11756
The correlation between the ecological footprint and spiritual quotient of student
teachers whose college is located in urban and semi urban areas was found to be -0.11782
and -0.11756(table value of r=0.087) respectively. The obtained r values indicate a negative
linear correlation in both the cases i.e. if the spiritual quotient of student teachers increases
then their ecological footprint decreases and vice a versa. A low correlation was found
between EF and SQ among student teachers of both urban and semi urban settings.Since in
both the cases the obtained value was higher than the table value therefore the null hypothesis
was rejectedat 0.05 level of significance. There is a significant relationship found between the
ecological footprint of student teachers and their spiritual quotient with respect to the location
(Pg. 9834-9842)
Copyright © 2018, Scholarly Research Journal for Interdisciplinary Studies Major findings:
It was found majority of the student teachers lie in the moderate range of spiritual
quotient and even their ecological footprint was found to be moderate.
Male student teacher had a higher spiritual quotient and lower ecological footprint as
compared to female student teachers.
Student teachers belonging to semi urban areas had a higher spiritual quotient and
lower ecological footprint as compared to student teachers from urban localities.
A significant correlation was found to exist between the ecological footprint of
student teachers with their spiritual quotient. In male student teachers, better correlation was
found between the ecological foot print and spiritual quotient as compared to female student
teachers.
Same level of correlation was found between the ecological footprint and spiritual
quotient of student teachers based on the location of their college.
Conclusion:
On the basis of above findings, the following conclusions have been drawn. Male
student teachers had a better spiritual quotient than the female student teachers. Students from
semi urban localities also had better spiritual quotient thane those form urban areas. There is
a relationship between ecological footprint of student teachers with their spiritual quotient
with respect to gender and location of college. However, as the relationship between these
variables was found to be low, there may be a chance of some other variable or factors
involved in such type of result. Though the correlation found was weak, it was negative in
nature i.e. if the value of one increases the value of one decreases and vice-versa.
Implications of the study:
The study highlights the overall relationship between ecological footprint and spiritual
quotient of student teachers with respect to gender and location of college.Increasing ones
spiritual intelligence is a gradual process which in turns helps us to have a better equation
with nature. The findings helped to identify that ecological footprint of the individuals can be
reduced if their spiritual quotient is enhanced.Therefore colleges should provide the student
teachers with situations that will boost their spiritual quotient. Participation in environmental
activities aimed at conservation and preservation of nature will also help student teachers to
be environmentally aware and conscious thereby leading to lesser ecological footprint.
(Pg. 9834-9842)
Copyright © 2018, Scholarly Research Journal for Interdisciplinary Studies
can be continued further by taking other aspects like socio economic status and level of
education into consideration and finding out the correlation.
References
Agarwal, K.M, Sikdar P.K, and Deb, S.C. (2002).A Textbook of environment. Kolkata, Macmillan India Limited.
Best, J.W. and Kahn, J.V.(2006). Research in education (4thed.).Prentice-Hall.
Garrett, G.E. (2011). Statistics in psychology and education.New Delhi, Paragon International Publishers.Page 491.
Goleman, D (1995).Emotional Intelligence: Why it can matter more than IQ.BentamBooksm New York.
Kaul, L. (2008).Methodology of educational research (3rd rev. ed.).New Delhi: Vikas Publishing House Pvt. Ltd.
Miluwi, J. O. & Rashid H. (2015).Research methodology Principles methods and practices (1sted.). Delhi: Mangalam Publications.