825
HUMAN EAR RECOGNITION USING SURF-PSO
TECHNIQUE
1Ahmed Ali Ahmed Al-Dulaimi, 2Jamal Mustafa Abbas Al-Tuwaijari, 3Ziyad Tariq Mustafa Al-Ta’i
Department of Computer Science - College of Science - University of Diyala – Iraq
E-mail:1[email protected], 2[email protected], 3[email protected]
ABSTRACT
Human ears have shown significant robustness and distinctiveness in human biometric applications. Thus, many techniques have been proposed to recognize humans, based on the shape of their ears. In this research, Speeded-Up Robust Feature (SURF) technique is employed in an ear recognition method, which measures the similarity between the input ear image and the ear images of known individuals in a database. The performance of this method is optimized using Particle Swarm Optimizer (PSO), which is used to reduce the size of the descriptors generated by the SURF method, before used in similarity measurements. Any descriptor value that has negative or no influence on the similarity measurements is removed. The approach (SURF-PSO) has been able to improve the performance of the SURF method, by increasing the recognition accuracy and reducing the time required of measuring the similarities. The evaluation results using three datasets, show that the recognition accuracy of the SURF-based method is improved by 2.41%, while the average time per each similarity measurement has been reduced by 43.72%. The performance of the optimized method is compared to the performance of ear recognition using Feed-Forward Neural Network (FFNN) and Convolutional Neural Network (CNN) techniques, which are designed and implemented. Although the use of CNN has shown better performance, the classification approach is difficult to implement in real-life applications, according to the need to retrain the classifier upon any modification to the database of the known individuals, and also the topology of the classifying neural network is relevant to the number of individuals that it can recognize. However, the proposed method has shown better performance than the other techniques in the literature that are used for the same applications. where the performance optimization has reduced the gap between the SURF-PSO method and the CNN classification method , where the gap between CNN method and SURF method is 6% and decreased to 3.59% between CNN method and SURF-PSO .
Keywords:Ear Recognition, Cnn, Ffnn, Surf, Pso .
1. INTRODUCTION
There are several identification verification schemes that exist today but the most accurate identification schemes are in the area of biometrics. [1]. Biometric features are widely used in human recognition according to their high security measures. These features can be extracted from the characteristics of the human body, which are known as physical biometrics, or by monitoring the human behavior during the execution of a certain action, which are known as behavioral biometrics. Although some concerns have risen about users’ privacy in physical biometric recognition, these
features have shown more robustness and attacks-resistance than behavioral biometric features [2,3].
826 images captured using digital cameras from distance [5].
Many techniques have been proposed for human recognition based on the shape of their ears. Based on the approach they adopt; these techniques are categorized into two main categories, geometric and holistic. Despite the resistance of geometric category to noise and illumination variation, the dependency on certain features in the ear to extract the required geometric measures causes loss of information in parts out of the interest of these methods. Holistic methods, on the other hand, rely on the overall appearance of the ear in order to recognize the person, i.e. features are extracted according to their distinctiveness, rather than their positions. Thus, holistic techniques have shown better overall performance [6].
[image:2.612.120.267.412.521.2]In spite of the common structure of humans’ ears, the distribution of the different parts in the ear, shown in Figure 1, as well as the shape of these parts in different from one individual to another. Thus, by detecting the distinctive distributions and shapes, it is possible to recognize humans using images of their ears [7].
Figure 1: The structure of humans' ear [7].
The remainder of this paper is organized as follows: Section two illustrates the work related to human recognition based on the shape of their ears and the techniques used to accomplish that goal; Sections three illustrates the method implemented and evaluated in this research; Section four presents the evaluation results of each method; Section five illustrates the conclusions of the research.
2. RELATED WORK
The employment of the ears’ shapes for human recognition has been present for more than a century. The earliest known attempt is dated back
to the year1890, when Alphonse Bertillon [8] noticed the uniqueness of the shape of the ear per each person, and used it for forensics. In 1964, Iannarelli et al. [9] developed a system to recognize individuals based on measurements collected from their ears, which is employed by the government of the United States for more than forty years for forensics and criminal investigations. Moreover, Burge and Burger [10] has proposed the first known computerized ear recognition system, which generates Voronoi diagrams for the curves in the ear images, based on the contours in the image, and use them to match the input image with the ear images of known individuals in a database.
The rapid development in computers, on both hardware and software aspects, the execution of more complex methods has become possible. This development has enabled the use of computer vision techniques to use more points from images to measure their similarity, which produces more accurate measurements [11]. Many of these techniques are employed in ears recognition. Hurley et al. [12] use Force Field Transform, which is field’s source of Gaussian, based on the mutually attracted particles that represent the ear, for ear images matching. Cross-correlation is applied by the proposed method, using Fourier Transform, after the force field is converted into a convergence field. This transformation is then used to implement multiplicative template matching. Despite the resistance of this method, against scaling and initialization, the high complexity of the computations required before the actual matching is conducted makes it inappropriate for real-time recognition.
827 for such applications. However, as this method does not consider the distinctiveness of the extracted features in the vector. Indistinctive features have the same effect on the results as the distinctive one, thus, the results may be affected by different real-life conditions, such as illumination variation and noise in the images.
The employment of artificial neural networks in different applications has shown outstanding performance, compared to other techniques that are used in the same applications. Moreover, Convolutional Neural Networks (CNNs) have the superiority over other types of neural networks, when interacting with images are inputs. and in the past few years have borne witness to the increasing popularity of CNN in many different domains such as image classification [14-16] over many benchmark datasets. This outperformance is caused by the use of convolutional layers, which use two-dimensional filter to detect local two-two-dimensional features in these images. As the positions of the features in an image are more relative to each other than the boundaries of the image, flattening an image loses to convert it into a vector causes the loss of important information [17].
An ear recognition method is proposed by Revaud et al. [18], which uses the Scale-Invariant Features Transform (SIFT) method to detect features and create descriptors for them. These features are extracted for the model ears images in the known individuals’ database, as well as the input images. A convolutional neural network is used to match these descriptors, i.e. predict whether these descriptors are extracted from ear images of the same individual or not. In addition to the limitation added by the use of predefined characteristics of the points that the descriptors are extracted from, in the SIFT method, the features extracted by this technique have shown less robustness than those detected by the Speeded-Up Robust Features (SURF) method. Galdámez et al. [19] illustrate the limitation that the use of features extractor adds to the CNNs performance, while Juan and Gwun [20] and Panchal et al. [21] illustrate the performance of the SURF method, compared to the SIFT.
3. THE PROPOSED MODEL
In this research, the performance of the SURF algorithm is optimized using the Particle Swarm Optimization (PSO) and used to match ear images, in order to recognize individuals. PSO is a heuristic
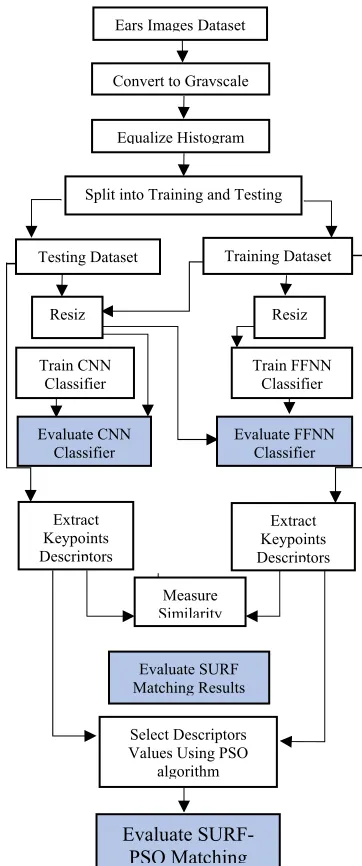
[image:3.612.346.527.183.616.2]optimization method based on the behavior of social insects [22]. The proposed SURF-PSO model is compared to the proposed CNN and NN models. Therefore, the general block diagram of the proposed model is shown in figure 2.
Figure 2: General Block Diagram of the Proposed System
3.1.Preprocessing
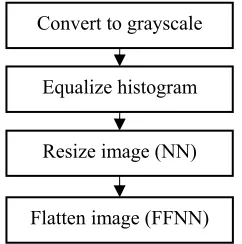
Prior to any recognition processing, the captured ear images are preprocessed, as shown in Figure 3. Each image is converted to grayscale, equalized its color histogram and resized. Images
Extract Keypoints Descriptors Extract
Keypoints Descriptors
Measure Similarity
Evaluate SURF Matching Results
Select Descriptors Values Using PSO
algorithm
Evaluate SURF-PSO Matching
Ears Images Dataset
Split into Training and Testing Convert to Grayscale
Equalize Histogram
Train CNN
Classifier Train FFNN Classifier
Evaluate FFNN Classifier Evaluate CNN
Classifier
Resiz Training Dataset Testing Dataset
828 that are used with (CNN and FFNN) are resized, however those that are used with the FFNN are flattened in addition to resize process. As the recognition relies on the shape of the ear, the color information has no value in that process. Thus, images are converted to grayscale to reduce the complexity of the computations required in the recognition phase.
Figure 3: Images preprocessing procedure
To convert the images to grayscale, a new image with the same dimensions is created, with a single value per pixel, which represents the intensity at that pixel. Using the Red (R), Green (G) and Blue (B) intensities in the original image, the value in the corresponding grayscale pixel (g) is
calculated using Equation 1.
(1)
Next, the color histogram of the pixels in the image is equalized, to reduce the effect of different illumination conditions. To equalize the color histogram of an image, the frequency of the possible intensities, based on the size of the variable reserved for these values, in the image’s pixels is calculated. The probability of each unique intensity value is calculated, based on their frequencies, to calculate their accumulative probability. Each intensity value in the image is replaced with the product of the maximum possible intensity value by the accumulative probability, corresponding to its value.
As the input size of neural networks is fixed, the ear images are resized to the required dimensions before being forwarded to these networks. Linear interpolation is used to resize these images. An empty image is created with the new dimensions, the image is required to be in. The intensity value of a pixel with coordinates (x, y), in
the new image is calculated by mapping its position
in the original image. If the mapping falls on an exact pixel in the original image, the intensity value in that image is used. Otherwise, the intensity values in the nearest pixels, with coordinates (x1,
y1) and (x2, y2), in the original image are used to
calculate the new intensity value. Depending on the orientation of the nearest pixels, to be horizontal by Equation 2 or vertical by Equation 3, their intensities are used in equations to calculate the intensity value in the new image.
(2)
(3)
where v is the new value calculated for the resized
image, while v1 and v2 are the values in the pixels
nearest to the mapped position in the original image.
3.2.Feed-Forward Neural Network (FFNN)
Classifier
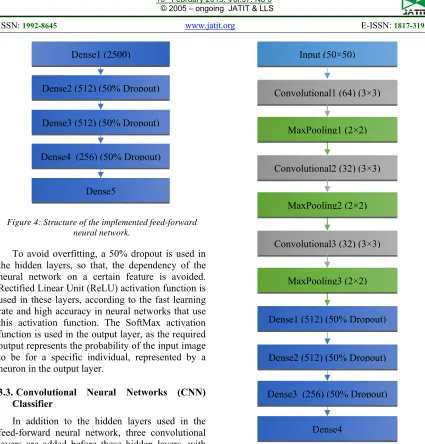
A feed-forward neural network is implemented to classify the input images into a number of classes equal to the number of individuals that the method is required to recognize. The implemented neural network includes three hidden layers, in addition to the input and output layers. The number of neurons in the input layer is set to 2500, so that, the network is capable of a flattened 50×50 pixels image. The hidden layers consist of 512, 512 and 256 neurons, sequentially. The number of neurons in the output layer is controlled by the number of individuals that the network is required to recognize. Figure 4 shows the structure of the implemented feed-forward artificial neural network.
Convert to grayscale
Equalize histogram
Resize image (NN)
829 Figure 4: Structure of the implemented feed-forward
neural network.
To avoid overfitting, a 50% dropout is used in the hidden layers, so that, the dependency of the neural network on a certain feature is avoided. Rectified Linear Unit (ReLU) activation function is used in these layers, according to the fast learning rate and high accuracy in neural networks that use this activation function. The SoftMax activation function is used in the output layer, as the required output represents the probability of the input image to be for a specific individual, represented by a neuron in the output layer.
3.3.Convolutional Neural Networks (CNN)
Classifier
In addition to the hidden layers used in the feed-forward neural network, three convolutional layers are added before these hidden layers, with 64, 32 and 32 filters with dimensions of 3×3 pixels, sequentially. Each convolutional layer is followed by a Max-Pooling layer with 2×2 filters size, as shown in Figure 5.
[image:5.612.325.503.69.498.2]The use of 2×2 Max-Pooling layers after each convolutional layer allows the reduction of the complexity of the computation in the neural network, without losing the important positioning information. Moreover, the use of three convolutional layers, with 3×3 filter size allows the detection of flexible complex features, compared to larger filters in fewer layers. Thus, this topology balances the complexity and detection accuracy.
Figure 5: Structure of the implemented convolutional neural network.
3.4.Using SURF Algorithm
This method employs the SURF algorithm to detect interest points in the ear images and create 64-byte vectors to describe these points. Using these vectors, the similarity between two images is calculated, where the ratio of the matching interest points to the total number of interest points in the input image is used as the similarity measure. By measuring the similarity between the input image and each model image of known individuals, the highest match is considered as the recognized person. The similarity measure is also compared to a threshold value, to ensure only significantly matching images are accepted. Figure 6 illustrates the block diagram of this method.
Dense1 (512) (50% Dropout)
Dense2 (512) (50% Dropout)
Dense3 (256) (50% Dropout)
Dense4 MaxPooling3 (2×2) Convolutional3 (32) (3×3)
MaxPooling2 (2×2) Convolutional2 (32) (3×3)
MaxPooling1 (2×2) Convolutional1 (64) (3×3)
Input (50×50) Dense1 (2500)
Dense2 (512) (50% Dropout)
Dense3 (512) (50% Dropout)
Dense4 (256) (50% Dropout)
830 Figure 6: Block diagram of the SURF-based method.
3.5.Using SURF-PSO Technique
The Particle Swarm Optimization (PSO) algorithm is used to optimize the performance of the SURF-based ear recognition method. The optimization is achieved in two aspects, increase the recognition accuracy and reduce the execution time. Both goals are achieved by removing the descriptor values that have negative or no effect on the recognition process. The removal of values of that have negative influence increases the recognition accuracy, by relying on distinctive values in the descriptors. The values that have no influence on the recognition process are removed to reduce the complexity of the similarity measurement, which reduces the execution time.
The PSO is set to control 64 values, within a range between zero and one. Each of these parameters corresponds to a value in the vector created by the SURF algorithm. A threshold value of 0.5 is set per each of these parameters, where values that receive a parameter value that equals to or larger than this threshold are included in the similarity measurement process. Values that have corresponding parameters with values less than 0.5
are eliminated from the similarity measurement. As the recognition accuracy is not affected by values in the vector that have no influence on the similarity measurement but still required to be removed, to reduce the execution time, the fitness function that measures the performance of the recognition process is shown in Equation 4. This formula ensures that the recognition accuracy has the highest priority, i.e. more emphasis, while maintaining the influence the number of values removed from the vector, to minimize the execution time.
(4)
4. RESULTS AND DISCUSSION
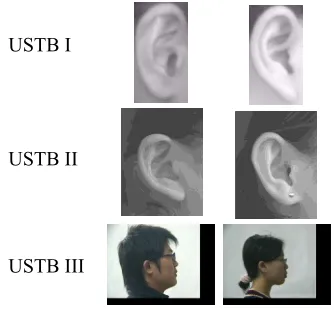
Three ears images datasets are used in the evaluation of the methods proposed in this research, which are the USTB1,USTB2 and USTB3[23]. The USTB ears images dataset consist of 180 images from 60 participants, with 80×150 pixels dimensions. The USTB2 consists of ear images collected from 77 participants, four images per each participant. The dimensions of each image are 200×280 pixels. The USTB3 dataset includes 10 ear images, per each of the 78 participants. Each image has dimensions of 100×120 pixels. Figure 7 shows sample images from the datasets used in the conducted experiments. Images are split sequentially into training and testing sets, i.e. the first images are used for training and the remainder is for testing.
Figure 7: Sample images from the datasets used in the evaluation.
All experiments are conducted using a Windows 10 computer with a 1.8GHz Intel® Core™ i7-4500HQ CPU and 8GB memory. An Nvidia GTX1050 GPU is used to accelerate the
USTB I
USTB II
USTB III Read model
images
Preprocess images
Read ear image
Preprocess image
Measure similarity between the input image and every image in the model
images using SURF
Select the person in the model image with highest similarity.
Similarity>Threshold
Recognized person No match found
[image:6.612.337.504.482.637.2]831 training and prediction of the artificial neural networks, with 2GB of memory. Images are preprocessed using the OpenCV library before delivered to the artificial neural networks, which implemented using Keras library in Python programming language. The SURF-based method is implemented and optimized using Matlab’s built-in computer vision libraries.
[image:7.612.311.518.229.440.2]First, the performance of the feed-forward neural network is evaluated. For each dataset, the ear images of each individual are split into training and testing sets. The testing dataset is used to calculate the recognition accuracy, after training the neural network using the training dataset. The average time required to recognize the individual per each ear image is also measured. The performance of this neural network is illustrated in Table 1.
Table 1: Evaluation results of the feed-forward artificial neural network.
USTB
Image/Individ. Accuracy
(%)
Recognition time ( µSec/image)
Train Test
1 2 1 88.33 37.67
2 3 1 89.61 39.45
3 8 2 92.31 34.94
Average: 90.08 37.35
The performance of the convolutional neural networks is evaluated next. For accurate comparisons, the same splits that are used in the previous experiment are employed for the evaluation of the CNN in this experiment. The same performance measures are collected for this type of artificial neural networks, as shown in Table 2.
Table 2: Evaluation results of the Convolutional artificial neural network.
USTB
Image/Individ. Accuracy
(%)
Recognition time (µSec/image)
Train Test
1 2 1 96.67 118.3
2 3 1 98.7 98.7
3 8 2 100 101.92
Average: 98.4567 106.307
These results illustrate the ability and flexibility of convolutional neural networks in detecting local features in images, compared to feed-forward neural networks. However, the addition of the convolutional and Max-Pooling layers have increased the complexity of the computation in these networks, which increased the time required to recognize an individual, based on the ear image.
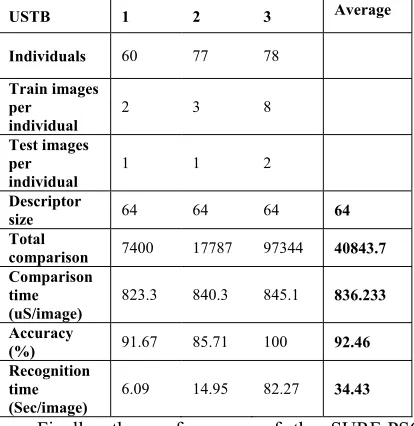
The performance of the SURF-based method, prior to any optimization is also measured. These performance measures are used as control values to evaluate the enhancement that the optimization function introduces. The same splits are used in this experiment. However, instead of training the method, the training images are used as model images for similarity measures. These results are illustrated in Table 3.
Table 3: Evaluation results of the SURF-based method.
USTB 1 2 3 Average
Individuals 60 77 78
Train images per
individual
2 3 8
Test images per individual
1 1 2
Descriptor
size 64 64 64 64
Total
comparison 7400 17787 97344 40843.7
Comparison time (uS/image)
823.3 840.3 845.1 836.233
Accuracy
(%) 91.67 85.71 100 92.46
Recognition time (Sec/image)
6.09 14.95 82.27 34.43
Finally, the performance of the SURF-PSO method is evaluated. The PSO is set to execute 100 iterations using 50 particles in the swarm. The performance measures of the optimized method are illustrated in Table 4.
Table 4: Performance measures of the optimized SURF-based method.
USTB 1 2 3 Average
Individuals 60 77 78
Train images
per individual 2 3 8
Test images
per individual 1 1 2
Descriptor size 20 28 14 20.67
Total
comparison 7400 17787 97344 40843.7
Comparison time (µSec/image)
357.3 427.6 284.9 365.6
Accuracy (%) 95 89.61 100 94.87
Recognition time (Sec/image)
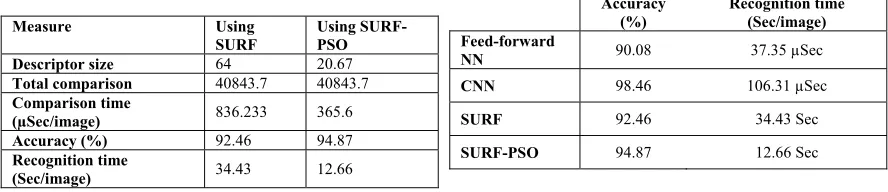
[image:7.612.310.517.230.443.2]832 Table 5 shows the enhancement of SURF-PSO technique in comparison with SURF algorithm using average performance.
Table 5: Average performance measures of the SURF-based method, before and after optimization.
Measure Using
SURF
Using SURF-PSO
Descriptor size 64 20.67
Total comparison 40843.7 40843.7
Comparison time
(µSec/image) 836.233 365.6
Accuracy (%) 92.46 94.87
Recognition time
(Sec/image) 34.43 12.66
The comparison shows the significant improvement in the SURF-based method, when optimized using the PSO algorithm. An average reduction in the descriptor size of 43.33 has been able to reduce the time required to measure the similarity between two images down to 43.72%. The removal of the values in the descriptor that have negative influence on the similarity measure has been able to improve the accuracy by 2.41%. The optimization of the SURF-based method’s performance has also been able to reduce the time required to recognize a single individual, based on the ear image, down to 36.77%.
As the average performance of the optimized SURF-based method has shown significantly better measures, these measures are compared to the performance measures of the evaluated artificial neural networks. Table 6 summarizes the average
accuracy and recognition time per each of the evaluated techniques.
Table 6: Summary of the average performance measure for the evaluated techniques.
Accuracy (%)
Recognition time (Sec/image) Feed-forward
NN 90.08 37.35 µSec
CNN 98.46 106.31 µSec
SURF 92.46 34.43 Sec
SURF-PSO 94.87 12.66 Sec
The comparison shows that the SURF-PSO method has been able to reduce the gap between the performance of the convolutional neural networks and the SURF-based method. The CNN has been able to outperform the SURF-PSO method with only 3.59%, compared to 6% for SURF method. Moreover, despite the shorter recognition time of the CNN, the use of such approach for ears recognition requires retraining the classifier every time a model image is added or removed. Such implementation is not applicable in real-life applications, as the devices used in runtime normally lack the resources required by the complex computations of the training. In the SURF-based methods, model images can be added and removed without any retraining, and their effect is applied immediately. Moreover, Table 7 compares the performance measure of the proposed methods with methods proposed in earlier studies.
Table 7: Comparison of the performance measures with earlier studies.
Study (Year) USTB Recognition accuracy (%)
Previous FFNN CNN SURF SURF-PSO
Yaqubi et al. [24] (2008) 1 75 88.33 96.67 91.67 95
Zhang and Mu [25] (2008) 1 91.67 88.33 96.67 91.67 95
Hai-Long and Ahi-Chun [26] (2009) 2 85.91 86.19 97.07 85.86 89.63
Zhang et al. [27] (2013) 3 100 89.49 98.46 98.72 99.23
Tian and Mu [4] (2016) 3 98.27 89.49 98.46 98.72 99.23
The comparison shows that the SURF-PSO method has outperformed most of the other techniques that exist in the literature. Although the method proposed by Zhang et al. [27] has perfect recognition accuracy and outperformed the optimized SURF-PSO method, the difference is marginal, with only 0.77% and SURF-PSO method has outperformed the convolutional neural network in the USTB3 dataset. Moreover, the images split conducted by Zhang et al. [27] is not illustrated in
the study, where images are selected randomly. Such selection approach may affect the confidence in the evaluation of the performance.
5. CONCLUSION
833 biometric authentication and forensics. Despite the good results achieved by the methods proposed based on artificial neural networks, the employment of these networks has two limitations. The first limitation is imposed by the use of other techniques that are used to extract features from the ear images, in order to deliver them to the classifier to make a recognition decision. The other limitation is imposed by the use of these networks without any other techniques, which are normally used for classification. Classification is not an appropriate approach for such application, according to the need of retraining the model every time a model image is added or removed. Devices that are used for human recognition in runtime do not have enough resources to handle the complex computations required to train such classifiers. Moreover, the topology of the classifying neural network is relevant to the number of individuals that it can recognize. Thus, to allow the neural network to recognize more individuals, more complex networks are required, which also requires more resources from the hardware.
The use of matching technique is more suitable for this application, where the similarity between the input image and each model image of the known individuals is calculated, in order to recognize that individual. Adding or removing model images requires no retraining and their effect is applied immediately. These modifications also require no change to the topology of the similarity measurement technique, so that, the required resources for the recognition hardware never changes. However, in the recent years, the employment of neural networks has shown significantly better performance, according to their ability to measure and weight the distinctiveness of the features detected in the inputs.
In this research, an ear recognition method is proposed based on the SURF computer vision algorithm. This method relies on matching using the descriptors created by the SURF algorithm, for the detected interest points. The similarity measure is calculated as the ratio between the numbers of matching interest points between two images to the total number of interest points in the input image. The performance of the proposed method is optimized using PSO algorithm, by removing any values in the descriptors that have negative or no influence on the similarity measurements. This optimization has been able to improve the performance of the proposed method significantly,
by increasing the recognition accuracy and the execution time. The accuracy is improved according to the removal of the values that have negative influence on the similarity measurements, while the execution time is improved according to the reduction of the descriptor size.
The results show that the SURF-PSO algorithm has been able to improve the average recognition accuracy by 2.41%, which has reduced the gap between the SURF-based method and the CNN classification method to 3.59%, from 6%. SURF-PSO has also been able to reduce the time required to calculate the similarity between two images down to 43.72%. The overall time required to recognize an individual based on the inputs ear image has also decreased to 36.77% of the time required before the optimization is applied.
In future work, the performance of the SURF-based method is going to be evaluated, when the optimization function is used to select a subregion from the image, instead of using the entire images, in addition to the descriptor optimization. Such an approach reduces the number of interest points extracted from the image, which reduces the computations required to measure the similarity between the images.
REFERENCES:
[1] Z. T. M. Al-Ta’i and O. Y. A. Al-Hameed,
“Comparison between pso and firefly
algorithms in fingerprint authentication,”
Int. J. Eng. Innov. Technol., vol. 3, no. 1, 2013.
[2] J. C. Joshi and K. Gupta, "Face Recognition Technology: A Review," IUP Journal of Telecommunications, vol. 8, p. 53, 2016.
[3] A. S. Anwar, K. K. A. Ghany, and H. ElMahdy, "Human ear recognition using SIFT features," in Complex Systems (WCCS), 2015 Third World Conference on,
2015, pp. 1-6.
[4] L. Tian and Z. Mu, "Ear recognition based on deep convolutional network," in Image and Signal Processing, BioMedical Engineering and Informatics (CISP-BMEI), International Congress on, 2016, pp.
437-441.
834 [6] L. Yuan, Z. Mu, and Z. Xu, "Using ear
biometrics for personal recognition," in
Advances in Biometric Person Authentication, ed: Springer, 2005, pp.
221-228.
[7] Ž. Emeršič, V. Štruc, and P. Peer, "Ear recognition: More than a survey,"
Neurocomputing, vol. 255, pp. 26-39, 2017.
[8] A. Bertillon, La photographie judiciaire: avec un appendice sur la classification et l'identification anthropométriques:
Gauthier-Villars, 1890.
[9] A. V. Iannarelli, Ear identification:
Paramont Publishing Company, 1964. [10] M. Burge and W. Burger, "Ear biometrics
for machine vision," in 21st Workshop of the Austrian Association for Pattern Recognition, 1997, pp. 275-282.
[11] J. Howse, OpenCV computer vision with python: Packt Publishing Ltd, 2013.
[12] D. J. Hurley, M. S. Nixon, and J. N. Carter, "Force field energy functionals for image feature extraction," Image and Vision computing, vol. 20, pp. 311-317, 2002.
[13] A. Basit and M. Shoaib, "A human ear recognition method using nonlinear curvelet feature subspace," International Journal of Computer Mathematics, vol. 91, pp.
616-624, 2014.
[14] B. Pandya, G. Cosma, A. A. Alani, A. Taherkhani, V. Bharadi, and T. M. McGinnity, “Fingerprint classification using a deep convolutional neural network,” in
2018 4th International Conference on Information Management (ICIM), 2018, pp.
86–91.
[15] A. A. Alani, G. Cosma, A. Taherkhani, and T. M. McGinnity, “Hand gesture recognition using an adapted convolutional neural network with data augmentation,” in 2018 4th International Conference on Information Management (ICIM), 2018, pp. 5–12.
[16] A. A. Alani, “Arabic Handwritten Digit Recognition Based on Restricted Boltzmann Machine and Convolutional Neural Networks,” Information, vol. 8, no. 4, p. 142, 2017.
[17] S. S. Kruthiventi, K. Ayush, and R. V. Babu, "Deepfix: A fully convolutional neural network for predicting human eye fixations,"
IEEE Transactions on Image Processing,
vol. 26, pp. 4446-4456, 2017.
[18] J. Revaud, P. Weinzaepfel, Z. Harchaoui, and C. Schmid, "Deep convolutional
matching," in Computer Vision & Pattern Recognition, 2015, pp. 1164-1172.
[19] P. L. Galdámez, W. Raveane, and A. G. Arrieta, "A brief review of the ear recognition process using deep neural networks," Journal of Applied Logic, vol.
24, pp. 62-70, 2017.
[20] L. Juan and O. Gwun, "A comparison of sift, pca-sift and surf," International Journal of Image Processing (IJIP), vol. 3, pp.
143-152, 2009.
[21] P. Panchal, S. Panchal, and S. Shah, "A comparison of SIFT and SURF,"
International Journal of Innovative Research in Computer and Communication Engineering," vol. 1, pp. 323-327, 2013.
[22] I. R. MOHAMMAD and Z. T. M. AL-TA’I, “IMAGE STEGANOGRAPHY BASED THE BEHAVIOR OF PARTICLE SWARM OPTIMIZATION.,” J. Theor. Appl. Inf.
Technol., vol. 96, no. 12, 2018.
[23] USTB. (2005). University of science and technology beijing USTB database. Available:
http://www1.ustb.edu.cn/resb/en/index.htm
[24] M. Yaqubi, K. Faez, and S. Motamed, "Ear recognition using features inspired by visual cortex and support vector machine
technique," in Computer and
Communication Engineering, 2008. ICCCE 2008. International Conference on, 2008,
pp. 533-537.
[25] H. Zhang and Z. Mu, "Compound structure classifier system for ear recognition," in
Automation and Logistics, 2008. ICAL 2008. IEEE International Conference on, 2008, pp.
2306-2309.
[26] Z. Hai-Long and M. Zhi-Chun, "Combining wavelet transform and orthogonal centroid algorithm for ear recognition," in Computer Science and Information Technology, 2009. ICCSIT 2009. 2nd IEEE International Conference on, 2009, pp. 228-231.
[27] B. Zhang, Z. Mu, C. Jiang, and J. Dong, "A robust algorithm for ear recognition under partial occlusion," in Control Conference (CCC), 2013 32nd Chinese, 2013, pp.
![Figure 1: The structure of humans' ear [7].](https://thumb-us.123doks.com/thumbv2/123dok_us/8900405.954669/2.612.120.267.412.521/figure-structure-humans-ear.webp)