IJPSR (2013), Vol. 4, Issue 2 (Research Article)
Received on 20 October, 2012; received in revised form, 27 November, 2012; accepted, 29 January, 2013
DEVELOPMENT AND VALIDATION OF STABILITY INDICATING HPTLC METHOD FOR DETERMINATION OF PHENOBARBITONE AS BULK DRUG AND IN PHARMACEUTICAL FORMULATION
P.R. Mhatre*, S.H. Gatkal, V.V. Chopade and P.D. Chaudhari
Department of Quality Assuranse Techniques, Modern College of Pharmacy Nigdi, Pune-411044, Maharashtra, India
ABSTRACT
A sensitive, selective, precise and stability indicating high performance thin layer chromatographic method of analysis of Phenobarbitone both as a bulk drug and in formulations was developed and validated in pharmaceutical dosage form. The method employed TLC aluminium plates precoated with silica gel 60F-254 as the stationary phase. The solvent system consisted of dichloromethane: ethyl acetate: glacial acetic acid (9.5:0.5:0.1 v/v/v/v). This system was found to give compact spots for Phenobarbitone (Rf value of 0.70). Phenobarbitone was subjected to acid and alkali hydrolysis, oxidation, photodegradation and dry heat treatment also the degraded products were well separated from the pure drug. Densitometric analysis of Phenobarbitone was carried out in the absorbance mode at 244 nm. The linear regression
data for the calibration plots showed good linear relationship with r2=/0.998/
in the concentration range of 200-/600 ng/band. The method was validated for precision, accuracy, ruggedness and recovery. The limits of detection and quantitation were 5.82 and 14.60 ng per spot, respectively. The drug undergoes degradation under acidic, alkaline conditions, oxidation and dry heat treatment. Peaks of degraded product were resolved from the standard drug with significantly different Rf values. This indicates that the drug is susceptible to acid hydrolysis/alkaline hydrolysis, oxidation, dry heat degradation. Statistical analysis proves that the method is reproducible and selective for the estimation of the said drug. As the method could effectively separate the drug from its degradation products, it can be employed as a stability indicating one.
INTRODUCTION: Barbiturates have been popular hypnotics and sedatives of the last century upto 1960s, but are not used now to promote sleep or to calm patients. They are prototype of CNS depressants. Barbiturates are substituted derivative of barbituric acid 1.
Chemically phenobarbitone is
5-ethyl-5-phenylbarbituric acid or 5-ethyl-5-phenyl-2,4, 6 (1H,
3H, 5H) pyrimidinetrione or phenobarbituric acid (figure 1).
Keywords:
Phenobarbitone, HPTLC, Validation, Stability-indicating, Degradation
Correspondence to Author: P.R. Mhatre
Department of Quality Assuranse Techniques, Modern College of Pharmacy Nigdi, Pune-411044, Maharashtra, India
FIGURE 1: STRUCTURE OF PHENOBARBITONE
Changes in chemic structure of barbituric acid increases lipid solubility speed up the onset of action,
and increses the hypnotic potency of the compound 2.
Phenobarbital is called a barbiturate that acts by slowing down the activity of the brain. It has sedative and hypnotic properties, which will help patients to relax before surgery or help to sleep. It also reduces or controls seizures or convulsions, except for absence (petit mal) seizures. Generic Phenobarbital oral elixir is available containing a high amount of alcohol which can increase possible unpleasant Effects 3, 4. Literature survey further revealed that the analytical method available for determination of drug phenobarbitone by
modified conductometric analysis.5.
MATERIALS AND METHODS: Phenobarbitone sample was obtained from Abbott Healthcare, Mumbai. The solvent used methanol (AR grade), dichloromethane (AR grade), ethyl acetate (AR grade), glacial acetic acid
(AR grade), NaOH (AR grade), HCl (AR grade) and H2O2
(AR grade). These chemicals were purchased from Merck Chemicals (Mumbai, India).
Equipment: Camag HPTLC system consisting Linomat 5 applicator, camag TLC scanner 3 and WinCATS software V-1.4.4 was used for chromatographic separation. Spotting of samples was done by using Hamilton microliter syringe.
Preparation of Standard stock solution: Standard stock solution of Phenobarbitone was prepared by dissolving 10 mg of drug in 100 ml of methanol to get concentration 100µg/ml. 2 ml standard stock solution of Phenobarbitone was then diluted in 10 ml methanol to get working standard solution 20 µg/ml (100 ng/5µl). From the stock solution 2, 4, 6, 8 and 10µl
were applied on TLC plate, at a distance 10mm from both x-axis and y-axis.
Validation of Analytical Method 6-8:
[image:2.612.311.586.265.423.2]Linearity: A stock solution of Phenobarbitone (100μg/ml) was prepared in methanol. Different volumes of stock solution as 2, 3, 4, 5 and 6μl were spotted on TLC plate to obtain concentration of 200, 300, 400, 500 and 600ng/band of Phenobarbitone, respectively. The data of peak area versus drug concentration were treated by linear least-square regression analysis. The response for the drug was found to be linear in the concentration range 200– 600ng/band. The calibration curve is shown in fig. 2.
FIG. 2: CALIBRATION CURVE FOR PHENOBARBITONE Regression Equation: y = 28.13x + 1288
Coefficient of correlation: 0.998.
Precision: The precision of the method was demonstrated by intra-day and inter-day variation studies. In the intraday studies, 3 different concentrations 200, 400 and 600ng/band of standard stock solution were spotted in triplicate and were analyzed. The percentage RSD was calculated.
TABLE 1: INTRA-DAY PRECISION STUDIES FOR PHENOBARBITONE
Conc. (ng/band) PEAK AREA MEAN SD %RSD
Trial 1 Trial 2 Trial 3
200 6850 6839 6759 6816 49.66 0.7285
400 12,792 12,716 12,781 12,763 41.07 0.3218
[image:2.612.43.566.689.753.2]600 18,066 18,403 18,090 18,186 188.02 1.0338
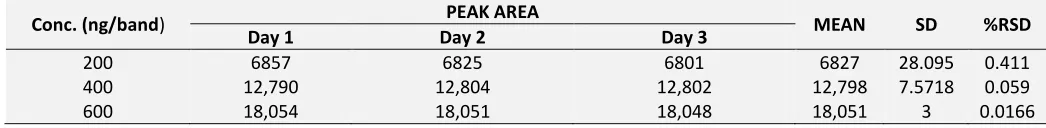
TABLE 2 : INTER-DAY PRECISION STUDIES FOR PHENOBARBITONE
Conc. (ng/band) PEAK AREA MEAN SD %RSD
Day 1 Day 2 Day 3
200 6857 6825 6801 6827 28.095 0.411
400 12,790 12,804 12,802 12,798 7.5718 0.059
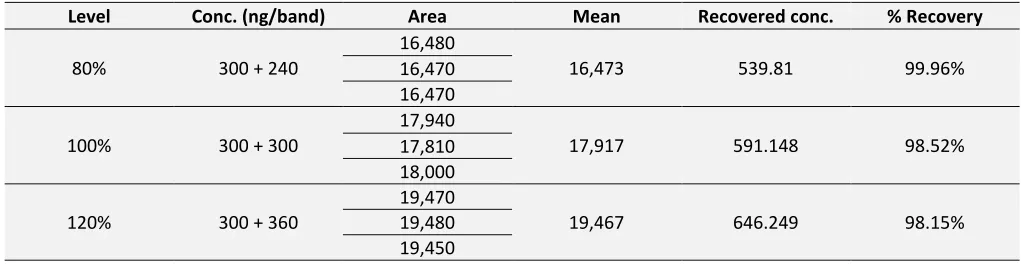
Accuracy: To check the accuracy of the method, recovery studies were carried out by over spotting standard drug solution to pre-analyzed sample solution at three different levels 80, 100 and 120 %. Basic concentration of sample chosen was 300 ng/band of Phenobarbitone bulk drug to which 240, 300 and 360
ng/band of Phenobarbitone tablet were added by over spotting. The areas were noted after development of plate. The drug concentrations of Phenobarbitone were calculated by using regression equation. The results obtained are shown in Table 3.
TABLE 3: RECOVERY STUDIES OF PHENOBARBITONE
Level Conc. (ng/band) Area Mean Recovered conc. % Recovery
80% 300 + 240
16,480
16,473 539.81 99.96%
16,470 16,470
100% 300 + 300
17,940
17,917 591.148 98.52%
17,810 18,000
120% 300 + 360
19,470
19,467 646.249 98.15%
19,480 19,450
Limit of Detection (LOD): LOD is calculated from the formula: -
3.3
DL = S
Where, σ = the standard deviation of the response for the lowest conc. in the range, S = the slope of the calibration curve.
LOD = Phenobarbitone: 5.82 ng/band
Limit of Quantification (LOQ): The quantitation limit (QL) may be expressed as:
10 QL =
S
LOQ = Phenobarbitone: 14.60 ng/band
Range: Phenobarbitone: 200 – 600 ng/band.
Specificity: The densitogram was studied for interference at the Rf of Phenobarbitone. Lack of interfering peaks in the blank at the Rf of the Phenobarbitone drug was taken as indication of the specificity of the method. The spectra of standard and sample at corresponding Rf matched exactly, indicating absence of other interference at that Rf.
[image:3.612.50.562.166.298.2]Robustness: Robustness of the method was determined by carrying out the analysis under conditions during which mobile phase ratio, dimensions of chamber were altered and the effects on the Rf values and area were noted. In case of mobile phase ratio, the percentage change in Rf was not more than 0.4 % & the percentage change in area was not more than 0.06 %. In case of Chamber change, percentage change in Rf value was not more than 0.01 % & the percentage change in area was not more than 0.06 %. The method was found to be robust since, the monitored parameters were not significantly affected.
TABLE 4 : SUMMARY OF VALIDATION PARAMETERS
SR.NO. VALIDATION PARAMETER PHENOBARBITONE
1 Linearity Equation Y= 28.13x +1288 , R2=0.998 2 Accuracy (% mean recovery) 98.15% - 99.96%
3 LOD 5.82 ng/band
4 LOQ 14.60 ng/band
5
Precision (% RSD) Intra day Inter day
0.6947% 0.1622%
Stress degradation Studies 9-11:
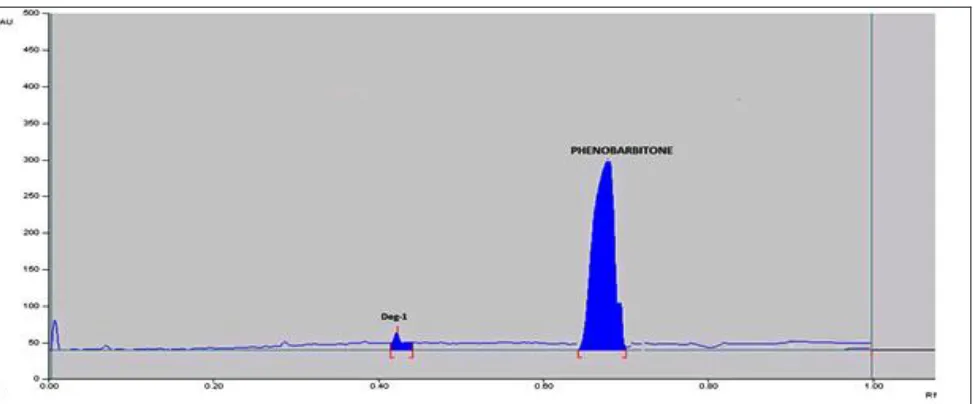
Densitogram of Phenobarbitone: Methanol was used as a solvent for solution preparation. Stationary phase was aluminium HPTLC plate (20×10cm) precoated with silica gel F254. dichloromethane : ethyl acetate : glacial
[image:4.612.52.566.147.376.2]acetic acid (9.5:0.5:0.1 v/v/v/v) was used. Standard stock solution of Phenobarbitone 5µl (300ng/band) was applied on TLC plate. The retention factor of Phenobarbitone was 0.70 ± 0.05. The typical densitogram of working standard solutions is as shown in fig. 3.
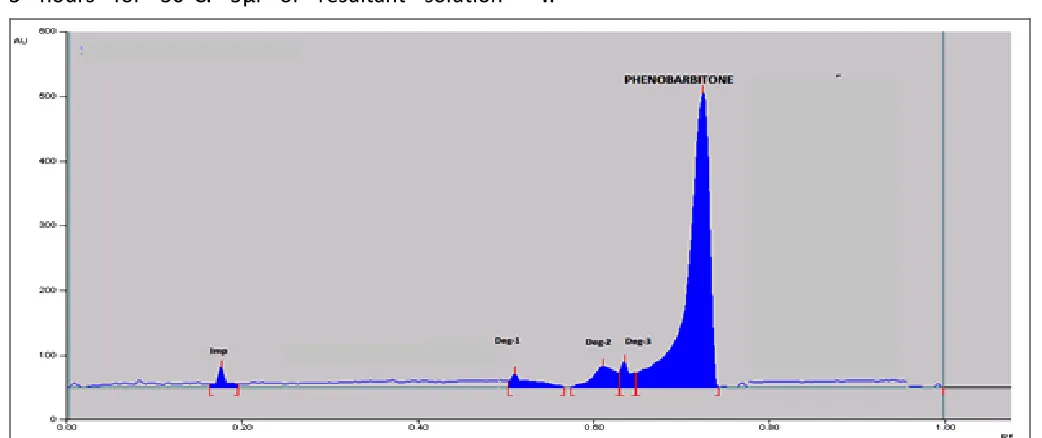
FIG. 3: THE TYPICAL DENSITOGRAM OF WORKING STANDARD (300 ng/band) Acidic hydrolysis: To 6 ml of stock solution, 1 ml of 2.5
N HCl was added. The volume was made up to 10 ml with methanol (0.3µg/5µl). This mixture then was kept for 3 hours for 30ᵒC. 5μl of resultant solution
(300ng/band) was then applied on TLC plate along with respective blank in adjacent track and the densitogram were developed. The results obtained are shown in fig. 4.
FIG. 4: DENSITOGRAM OF PHENOBARBITONE (300ng/band, at Rf = 0.70) AFTER ACID HYDROLYSIS DEGRADATION OF PHENOBARBITONE WAS OBSERVED AT RF 0.76 AND DEGRADED PRODUCTS WAS FOUND AT Rf 0.55, 0.63, 0.66.
Alkaline hydrolysis: To 6 ml of stock solution, 1 ml of 3 N NaOH was added. The volume was made up to 10 ml with methanol (0.3µg/5µl). This mixture then was kept
[image:4.612.46.567.451.670.2]were developed. The results obtained are shown in fig. 5.
FIG. 5: DENSITOGRAM OF PHENOBARBITONE (300ng/band, at Rf= 0.70) AFTER A HYDROLYSIS DEGRADATION OF PHENOBARBITONE WAS OBSERVED AT RF 0.64 AND DEGRADED PRODUCTS WAS FOUND AT Rf 0.80.
Oxidation: 6 ml of stock solution, 2 ml of 6 % H2O2 was added. The volume was made up to 10 ml with Methanol (0.3µg/5µl). This mixture then was kept for 3 hours at RT. 5μl of resultant solution (300 ng/band)
was applied on TLC plate along with respective blank in adjacent track and the densitogram were developed. The results obtained are shown in fig. 6.
FIG. 6: DENSITOGRAM OF PHENOBARBITONE (300ng/band, at Rf= 0.70) AFTER OXIDATIVE DEGRADATION OF PHENOBARBITONE WAS OBSERVED AT RF 0.70 AND DEGRADED PRODUCTS WAS FOUND AT Rf 0.63,0.72,0.77.0.82.
Degradation under Dry Heat 12: Dry heat studies were
performed by keeping drug sample in oven (500 C) for a
period of 120hours. 10mg of exposed drug was weighed accurately and transferred to a 100 ml of volumetric flask and dissolved in methanol, the volume was made up with methanol to get conc. of 100µg/ml. 6 ml standard stock solution of Phenobarbitone was
[image:5.612.55.556.383.613.2]FIG. 7: DENSITOGRAM OF PHENOBARBITONE (300ng/band, at Rf= 0.70) AFTER DRY HEAT DEGRADATION OF PHENOBARBITONE WAS OBSERVED AT RF 0.68 AND DEGRADED PRODUCT WAS FOUND AT Rf 0.43.
Photo-degradation studies:
Long UV-Degradation at 366 nm: The photochemical stability of the drug was studied by exposing the drug sample to long UV (366nm) light for 48 hour 10 mg after exposure, accurately weighed 10 mg of drug in 100 ml of methanol to get concentration 100µg/ml. 6 ml standard stock solution of Phenobarbitone was then diluted in 10 ml methanol to get working standard solution (0.3µg/5µl). 5μl of resultant solution (300ng/band) was then applied on TLC plate.
Short UV-Degradation at 254 nm: The photochemical stability of the drug was studied by exposing the drug sample to short UV (254nm) light for 48 hour 10 mg after exposure, accurately weighed 10 mg of drug in 100 ml of methanol to get concentration 100µg/ml. 6 ml standard stock solution of phenobarbitone was then diluted in 10 ml methanol to get working standard solution (0.3µg/5µl). 5μl of resultant solution (300ng/band) was then applied on TLC plate .
TABLE 5 : SUMMARY OF STRESS DEGRADATION STUDIES OF BULK DRUG
Sr. no. Stress degradation parameter Peak area % degradation Rf of degraded product
1 INITIAL 9650 - 0.70
2 ACID DEGRADATION 6620 31.4% 0.76
3 ALKALI DEGRADATION 7514 22.14% 0.64
4 OXIDATIVE DEGRADATION 6571 31.91% 0.70
5 DRY HEAT DEGRADATION 6369 34% 0.68
6 LONG UV 9651 no degradation 0.70
7 SHORT UV 9655 no degradation 0.71
RESULTS AND DISCUSSION: HPTLC method was validated as per ICH guidelines. The developed method was found to be linear within the range of 200 –
600ng/band with R2=0.998. The accuracy of method
was determined at 80, 100, 120% level. The % recoveries were found to be 99.96%, 98.52%, and 98.15% within the limit of 98% to 102%.
The LOD and LOQ were found to be 5.82 ng/band and 14.60 ng/band indicating the sensitivity of the method.
The developed method was found to be precise as the % RSD values for intraday and inter-day were found to be less than 2%. The method was also found to be robustness indicated by the % RSD values which are less than 2 %. The summary of validation parameters of proposed HPTLC method is shown in table 4.
[image:6.612.32.586.482.602.2]Summary of the results of stress degradation studies of phenobarbitone are shown in table 5.
CONCLUSION: The proposed methods are precise, specific, accurate, robust and stability-indicating ones. Phenobarbitone can be determined in bulk and
pharmaceutical formulation and percentage
degradation. ICH guidelines were fallowed throughout the study for method validation and stress testing, and the suggested method can be applied for quality control and routine analysis.
ACKNOWLEDGEMENT: Authors are gretful to the Ayushakti Ayurved Pvt. Ltd., Palghar for providing instrumentation and necessary facilities to carry out the research work.
REFERENCES:
1. Tripathi KD: Essentials of Medical Pharmacology. Jaypee Brothers Medical Publishers (P) Ltd. Sixth Edition 2010: 390-391 2. Barar fsk :essentials of pharmacotherapeutics. S. Chand &
company Ltd. Sixth edition 2011:84-85
3. Jelveghari1 M, and Nokhodchi A : Development and Chemical Stability Studies of Alcohol-Free Phenobarbital Solution for Use in Pediatrics: a Technical Note, American Association of Pharmaceutical Scientists, 2008; 939.
4. Burchell R, Geoffrey I and Nemeth M : Development of phenobarbital-sensitive control mechanisms for uridine
diphosphate Glucuronyltransferase activity in chick embryo liver, The Journal of Cell Biology 1972; 55, 448-452.
5. Celina M. and Mario R.: Phenobarbital in pharmaceutical tablets by modified conductometric analysis, journal of the argentine chemical society 2008; 96, 101-110
6. Sethi P.: High performance thin layer chromatography, quantitative analysis of pharmaceutical formulations. CBS publishers and Distributors. Second edition 1996: 56-63 7. Kumar A., Sinha S., Agarwal S. and Ahuja A. : validation stability
indicating thin layer chromatographic determination of nadifloxacin in microemulsion and bulk drug formulations, Journal of Food and Drug Analysis 2010;18,358-365
8. Patel D and Patel N.: validated stability indicating HPTLC method for the determination of Tamsulosin hydrochloride in pharmaceutical dosage forms, International Journal of ChemTech Research 2010; 2,646-652
9. Gandhi S., Dewani M., Borole T. and Damle M. : Development and validation of stability Indicating HPTLC Method for Determination of Ofloxacin and Ketorolac Tromethamine in Combination, Journal of Advanced Scientific Research 2011;2,77-82
10. Borole T., Mehendre R.,Damle M. and Bothra K.: Development and validation of stability Indicating HPTLC Method for Determination of prasugrel, Journal of Chemical and Pharmaceutical Research 2010;2,907-913
11. Rao J. , Sathiyanarayanan L. and Yadav S. : stability Indicating HPTLC method for Trandolapril estimation in the bulk drug and tablet dosage form, Indian Journal of Pharmaceutical Education and Research 2010; 44, 341-344
12. Henawee M., Ibraheim M. and Ayad M. : stability indicating methods for the determination of rofecoxib, Journal of Chinese Chemical Society 2006; 53, 619-625.
How to cite this article: