http://dx.doi.org/10.4236/eng.2014.61006
Distributed Generation Effects on Large-Scale
Distribution Networks
*
Anastasia S. Safigianni#, George N. Koutroumpezis, Anastasios I. Spyridopoulos Electrical and Computer Engineering Department, Democritus University of Thrace, Xanthi, Greece
Email: #[email protected]
Received June 12,2013; revised July 12, 2013; accepted July 19, 2013
Copyright © 2014 Anastasia S. Safigianni et al. This is an open access article distributed under the Creative Commons Attribution License, which permits unrestricted use, distribution, and reproduction in any medium, provided the original work is properly cited. In accordance of the Creative Commons Attribution License all Copyrights © 2014 are reserved for SCIRP and the owner of the intellectual property Anastasia S. Safigianni et al. All Copyright © 2014 are guarded by law and by SCIRP as a guardian.
ABSTRACT
This paper examines the results of the distributed generation penetration in large-scale medium-voltage power distribution networks. The network examined as a study case consists of twenty one lines fed by three power substations. The injected power comes mainly from photovoltaic units. Specifically, the influences of distributed generation on the network branch currents, losses and voltage profile as well as on the short-circuit level at the medium voltage busbars of the infeeding substations are examined according to international and national stan- dards. The arising problems are explored and technical solutions are proposed. This paper is a pilot application as general conclusions concerning the extended distributed generation penetration in real power distribution networks are set out.
KEYWORDS
Distributed Generation Effects; Extended Penetration; Technical Constraints; Thermal Current; Losses; Short-Circuit Level; Voltage Profile
1. Introduction
In recent years, increasing amounts of distributed genera-tion (DG) have been connected to distribugenera-tion networks. Environmental, technical, and economic issues are play-ing an important role in the development of DG.
A general definition for DG was suggested in [1] and is now widely accepted: “Distributed generation is an electric power source connected directly to the distribu-tion network or on the customer site of the meter”. This definition does not determine the rating of the generation sources or the DG technologies used. Furthermore, it does not cover power delivery area, penetration, owner-ship, or treatment within the network operation.
As a result of DG penetration at distribution level, dis-tribution systems are facing the challenge of evolving from passive networks with unidirectional power flow supplied by the transmission grid to active networks with
bidirectional power flows. A number of steps should be followed concerning, on the one hand, best use of the existing distribution network by optimal allocation of the DG resources and, on the other hand, optimal planning of the development from passive to active, by taking ac-count of all the relevant technical and commercial con-siderations. The technical issues include the adequacy of the network’s and associated plant’s thermal rating, fault levels, and sufficient voltage support to ensure both the security and quality of electricity supply [2-7]. The com- mercial issues include the cost of the DG, installation charges, operating costs, revenue expectations, and the value of reduced losses in the network [8-12].
The challenge is to identify suitable DG locations and ratings in distribution networks with respect to technical or economic constraints, which will enable a high DG penetration and avoid network sterilisation which results when capacity is allocated to bus/buses whose voltage and/or short-circuit levels (SCLs) are most sensitive to power injections. Thus, no more generation can be con-nected as the buses are constrained [4,7].
*This paper contains the final processed results concerning the
ex-amined subject. Relevant early results were presented in the 11th Euro PES 2012, June 25-27, Napoli, Italy.
Although the optimal DG allocation on distribution networks is the most interesting research point, the most common practical question is whether DG resources of a particular type and rating can be connected at predeter-mined network positions without causing technical prob-lems [6] and, if possible, without changing the network structure. This is determined by the specific requirements of independent producers.
In Greece, during the last years, a huge number of in-dependent producer applications were submitted for ap-proval, mainly concerning the connection of photovoltaic (PV) units to the Public Power Corporation (PPC) Me-dium Voltage (MV) distribution network. The Greek Government subsidises the production of these “green” kWhs in order to meet the environmental constraints es-tablished by the Kyoto Protocol and other government initiatives primarily concerning fuel saving. The afore-mentioned applications are very difficult to be examined in detail. So, there is a possibility that the existing MV networks will not be able to accommodate the new gen-eration, operating in parallel, in a technically and eco-nomically acceptable manner.
In light of the above situation, this paper investigates the results of DG penetration in a large-scale MV distri-bution network as a pilot application. The network is fed by three power substations and it consists of twenty one MV lines. The DG resources to be connected are mainly PV units, with a total capacity of about 32 MW. Their locations are predetermined. Specifically, the influence of these units on the network branch currents, voltage profile, power flow, short-circuit level (SCL) at the MV busbars of the infeeding power substations, and losses are examined using a commercial-grade software pack-age. The results arising from this real-world case study can be used as a pilot for the relevant analysis required for every relative network.
2. Network Description
The network examined in this paper is the rural MV network of the prefecture of Xanthi, Greece. This pre-fecture has an area of 1793 square kilometers and a population of 100,000 inhabitants.
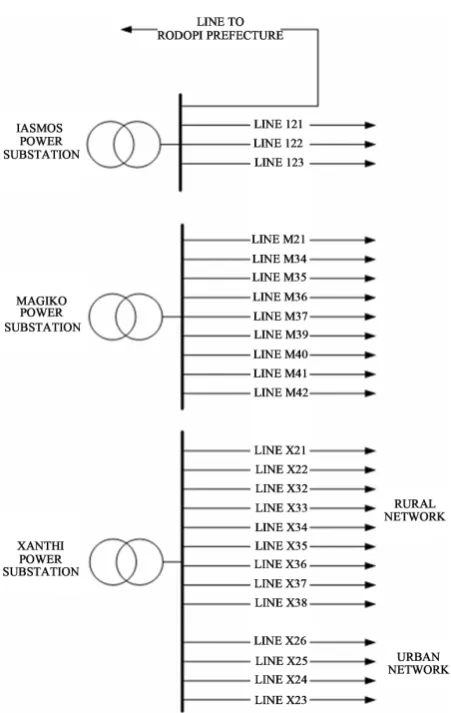
[image:2.595.310.536.78.435.2]The total MV network of the prefecture of Xanthi is illustrated in Figure 1. It is fed by the three power sub-stations, 150/20 kV, of Xanthi, Magiko, and Iasmos. The substation of Xanthi has a rated capacity equal to 100 MVA (2 × 50 MVA) and a short-circuit level SCLmax = 138 MVA, the substation of Magiko has a rated capacity equal to 100 MVA (2 × 50 MVA) and a short-circuit level SCLmax = 129 MVA, and the substation of Iasmos has a rated capacity equal to 50 MVA (2 × 25 MVA) and a short-circuit level SCLmax = 230 MVA. The substation of Iasmos feeds, in part, Xanthi prefecture and, in an-other part (one line), the neighbouring Rodopi prefecture.
Figure 1. Sketch of the power substations and the MV lines of the examined network.
In this paper, only the lines belonging to the prefecture of Xanthi are examined. The substation of Xanthi feeds with four lines the town of Xanthi (urban network). These lines are not examined in this paper because they do not have DG units connected. So, the twenty one lines examined constitute the rural network of Xanthi, and their allocation to the three power substations is outlined
in Figure 1 and Table 1. The types of conductors used in
these lines are:
• ACSR 3 × 95 mm2 and ACSR 3 × 50 mm2 for the main feeders, and
• ACSR 3 × 35 mm2 and ACSR 3 × 16 mm2 for the secondary branches.
The total length per line is given in Table 1.
The nominal voltage of the MV buses is 20 kV, while their operating voltages are:
• For the maximum load: 21.4 kV
• For the daily minimum (evening) load: 21 kV • For the absolutely minimum (night) load: 20.5 kV.
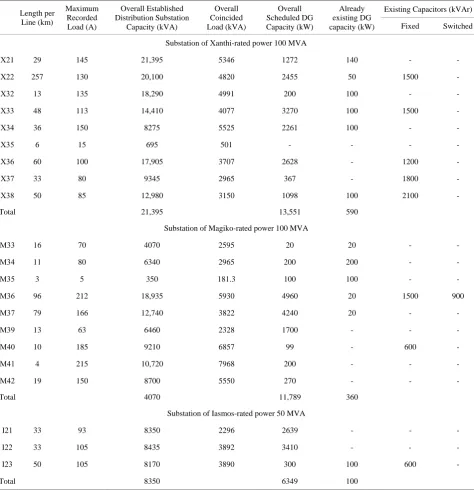
Table 1. Data of the rural MV network of the prefecture of Xanthi.
Length per Line (km)
Maximum Recorded Load (A)
Overall Established Distribution Substation
Capacity (kVA)
Overall Coincided Load (kVA)
Overall Scheduled DG Capacity (kW)
Already existing DG capacity (kW)
Existing Capacitors (kVAr)
Fixed Switched
Substation of Xanthi-rated power 100 MVA
Χ21 29 145 21,395 5346 1272 140 -
-Χ22 257 130 20,100 4820 2455 50 1500
-Χ32 13 135 18,290 4991 200 100 -
-Χ33 48 113 14,410 4077 3270 100 1500
-Χ34 36 150 8275 5525 2261 100 -
-Χ35 6 15 695 501 - - -
-Χ36 60 100 17,905 3707 2628 - 1200
-Χ37 33 80 9345 2965 367 - 1800
-Χ38 50 85 12,980 3150 1098 100 2100
-Total 21,395 13,551 590
Substation of Magiko-rated power 100 MVA
Μ33 16 70 4070 2595 20 20 -
-Μ34 11 80 6340 2965 200 200 -
-Μ35 3 5 350 181.3 100 100 -
-Μ36 96 212 18,935 5930 4960 20 1500 900
Μ37 79 166 12,740 3822 4240 20 -
-Μ39 13 63 6460 2328 1700 - -
-Μ40 10 185 9210 6857 99 - 600
-Μ41 4 215 10,720 7968 200 - -
-Μ42 19 150 8700 5550 270 - -
-Total 4070 11,789 360
Substation of Iasmos-rated power 50 MVA
Ι21 33 93 8350 2296 2639 - -
-Ι22 33 105 8435 3892 3410 - -
-Ι23 50 105 8170 3890 300 100 600
-Total 8350 6349 100
taken as equal to 70% of the maximum load, while the absolutely minimum (night) load is taken as equal to 20% of the maximum load, following relevant PPC sugges-tions.
Table 1 also shows the overall installed distribution
substation capacity per line. This capacity concerns both the PPC distribution substations and the distribution sub-stations of the individuals. Since annual peak load mea-surements per PPC distribution substation are not availa-ble, the rated power of each substation is coincided with the maximum recorded load per line, following relevant
power factor equal to 0.9 with the exception of the loads of line M36 which, according to PPC suggestions, is considered to operate with a common inductive power factor equal to 0.89.
The total DG power per line (existing or scheduled to be connected) is also shown in Table 1. This power comes mainly from PV units, which operate with a ca-pacitive power factor equal to 0.99, except for the line X22, where two small hydroelectric plants are connected, having a rated power equal to 2.36 MW and operating with a power factor equal to unit. The already existing DG power per line is shown in a separate column of
Ta-ble 1. This power is taken into account in the
computa-tions for the existing situation.
Fixed and switched capacitors connected to the lines are also given in Table 1.
The network was captured and examined using the NEPLAN software package [13].
3. Technical Constraints
The following technical constraints are taken into ac-count throughout the investigation of the DG penetration in the examined network:
1) SCL Constraint: a basic requirement for permitting the interconnection of DG is to ensure that the resulting SCL remains below the network design value (SCLrated). The SCL is highest at the MV busbars of the infeeding substation (SCLmax). The following relation describes the constraint:
max rated
SCL <SCL (1)
2) Transformer Capacity: the amount of generation connected minus the minimum load must not exceed the rating of the transformer at the higher voltage.
3) Thermal Constraint: the rated current of the lines,
Iirated, must not be exceeded:
i irated
I <I (2)
where Iiis the current flowing at each network branch. 4) Voltage Variation Constraint: A critical considera-tion concerning the interconnecconsidera-tion of DG sources to the grid is their effect on the slow voltage variations. There-fore the utility operators should impose certain limits within which the voltage variations should lie during normal network operation. The statistical nature of volt-age variations is now recognised and relevant norms have been issued, such as the European Norm EN 50160 [14], which impose statistical limits, where a small probability of exceeding them is acceptable. However, checking the conformity against statistical limits at the planning stage requires elaborate procedures, such as probabilistic load flow techniques. Such an approach is relatively difficult to apply because it requires data usu-ally unavailable in practice, which completely defeats the
objective of simplicity and efficiency in the evaluation. For this reason, utility directives for the connection of DG adopt simpler and more straightforward procedures while also differentiating their requirements from those imposed by EN 50160 [15].
According to [14], and for the public MV networks, the 10-minute mean rms voltage values are between 90% and 110% of the nominal voltage UN during 95% of a period of one week.
As mentioned above, while EN 50160 gives general limits for public supply networks, various European countries have additional rules governing supply condi-tions. So, in Greece and for the PPC MV networks, the following requirements are set for the steady-state node voltages, according to [15,16]:
• The median voltage of any node i should lie within ±5% of the nominal voltage UN, a requirement dictated by the off-load tap changer of the MV/LV distribution transformers (±5% regulation, in steps of 2.5%):
(
max min)
10.95 1.05
2
N i i N
U ≤ U +U ≤ U (3)
where Umaxi and Umini are the maximum and minimum voltage values in the node i, determined by solving the load flow for all combinations of max/min load/genera- tion (usually, minimum load/maximum generation yields maximum voltage values and maximum load/minimum generation yields minimum voltage values).
• The variation of the voltage around its median value should not exceed ±3% of the nominal, so that the LV network voltage deviations remain within ±8% (plan- ning limit), after the median deviation is corrected by the fixed taps:
max min 0.03 2
i i
N
U U
U
−
≤ (4)
4. Network Study
According to the data of Table 1, the total DG rated power in the lines stemmed from Xanthi substation is 13.55 MW, in the lines stemmed from Iasmos substation is 6.4 MW, and in the lines stemmed from Magiko subs-tation is 11.8 MW.
For the SCL computation, the IEC60909 [17] was used. In particular, the computation of the contribution of the PV units to SCL was made using the following equation given in [18]:
''
over interval
k rG
I =kI =ct ∆t (5)
where: '' k
I the initial symmetrical short-circuit current k = 1.5 - 2.0 and Δt is the duration of the contribution
rG
I the rated current of the PV unit.
The fault current contribution of all the PV units is sim-ply added algebraically to the total fault level of all other sources, which provides a result slightly on the safe side. The PPC takes the negligible fault current contribution of the PV units as zero.
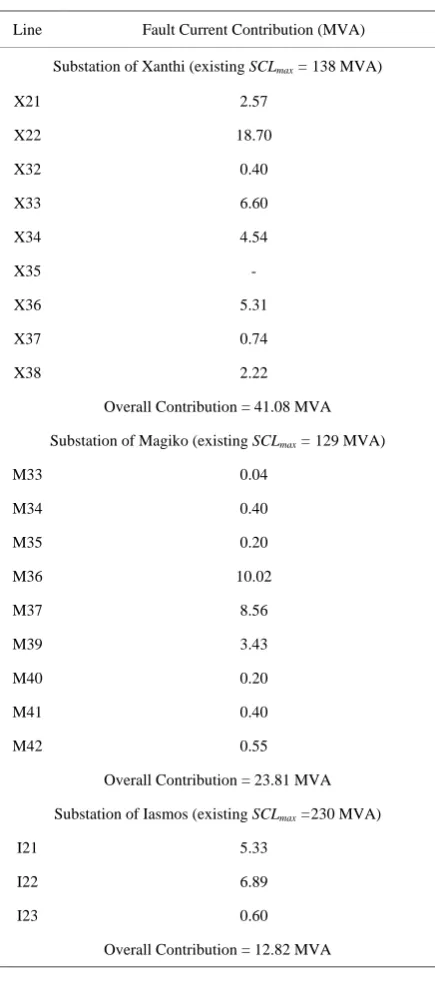
Table 2 shows the fault current contribution of the DG
units to SCLmax for each one of the three power substa-tions. From the data of Table 2, it is obvious that the SCL constraint outlined in Section 3 is not breached. Only the substation of Iasmos has an SCLmax very close to its design value (SCLrated = 250 MVA), which must be
Table 2. Fault current contribution of the DG units to the SCLmax.
Line Fault Current Contribution (MVA)
Substation of Xanthi (existing SCLmax = 138 MVA)
X21 2.57
X22 18.70
X32 0.40
X33 6.60
X34 4.54
X35
-X36 5.31
X37 0.74
X38 2.22
Overall Contribution = 41.08 MVA
Substation of Magiko (existing SCLmax = 129 MVA)
M33 0.04
M34 0.40
M35 0.20
M36 10.02
M37 8.56
M39 3.43
M40 0.20
M41 0.40
M42 0.55
Overall Contribution = 23.81 MVA
Substation of Iasmos (existing SCLmax =230 MVA)
I21 5.33
I22 6.89
I23 0.60
Overall Contribution = 12.82 MVA
seriously considered, as there is an additional MV line departing from this substation towards the Rodopi pre-fecture. Additional DG units may be connected to this line, which will increase the SCLmax of Iasmos substation even further.
The power flow, voltage profile, currents, and losses of the network lines were examined through power flow analysis using the NEPLAN software package. Specifi cally, the following limit network operating situations were examined in order to find the worst scenario:
S1. Maximum load, zero DG penetration (PV and hy-droelectric units out of service).
S2. Maximum load, maximum DG penetration (full operation of PV and hydroelectric units).
S3. Daily minimum load, zero DG penetration. S4. Daily minimum load, maximum DG penetration. S5. Absolutely minimum (night) load, zero DG pene-tration.
S6. Absolutely minimum (night) load, maximum night DG penetration (full operation of the hydroelectric units only).
The last situation S6 concerns only the line X22, which has two small hydroelectric units of a total power equal to 2.36 MW. These units continue to contribute to the load during the night, when the absolutely minimum load exists and the PV units do not produce power.
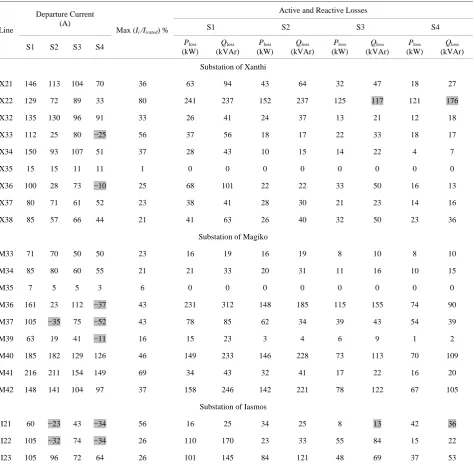
Table 3 shows the results of the power flow analysis
concerning the departure current, the maximum recorded ratio Ii /Iirated of the branch current Ii as a percentage of the rated current Iirated of the conductor used in this branch, and the total active Plossand reactive Qlosslosses per line, for the first four of the above mentioned limit operating situations.
The DG penetration reduces the departure current. The greater the DG penetration, the greater this reduction is. In the S4 case, there is an inverse power flow for the lines X33, X36, M36, M37, M39, I21, and I22, as shown by the negative sign of the departure current in the shaded cells of Table 3. Even in the case of coincided reverse currents, the total reverse current per power sub-station corresponds to a reverse power flow much smaller than its capacity. So the second technical con-straint (Transformer Capacity) is satisfied. The third technical constraint (Thermal Constraint) is also satisfied, as shown by the values of the ratio Ii /Iirated %in Table 3, which are mostly much smaller than 100%.
Table 3. Line currents and losses for the limit network operating situations.
Line
Departure Current (A)
Max(Ii /Iirated)%
Active and Reactive Losses
S1 S2 S3 S4
S1 S2 S3 S4 Ploss
(kW)
Qloss
(kVAr)
Ploss
(kW)
Qloss
(kVAr)
Ploss
(kW)
Qloss
(kVAr)
Ploss
(kW)
Qloss
(kVAr)
Substation of Xanthi
X21 146 113 104 70 36 63 94 43 64 32 47 18 27
X22 129 72 89 33 80 241 237 152 237 125 117 121 176
X32 135 130 96 91 33 26 41 24 37 13 21 12 18
X33 112 25 80 −25 56 37 56 18 17 22 33 18 17
X34 150 93 107 51 37 28 43 10 15 14 22 4 7
X35 15 15 11 11 1 0 0 0 0 0 0 0 0
X36 100 28 73 −10 25 68 101 22 22 33 50 16 13
X37 80 71 61 52 23 38 41 28 30 21 23 14 16
X38 85 57 66 44 21 41 63 26 40 32 50 23 36
Substation of Magiko
M33 71 70 50 50 23 16 19 16 19 8 10 8 10
M34 85 80 60 55 21 21 33 20 31 11 16 10 15
M35 7 5 5 3 6 0 0 0 0 0 0 0 0
M36 161 23 112 −37 43 231 312 148 185 115 155 74 90
M37 105 −35 75 −52 43 78 85 62 34 39 43 54 39
M39 63 19 41 −11 16 15 23 3 4 6 9 1 2
M40 185 182 129 126 46 149 233 146 228 73 113 70 109
M41 216 211 154 149 69 34 43 32 41 17 22 16 20
M42 148 141 104 97 37 158 246 142 221 78 122 67 105
Substation of Iasmos
I21 60 −23 43 −34 56 16 25 34 25 8 13 42 36
I22 105 −32 74 −34 26 110 170 23 33 55 84 15 22
I23 105 96 72 64 26 101 145 84 121 48 69 37 53
work operating situation. The active losses of the other M37 line branches are reduced.
The reactive losses Qlossare also reduced when the DG units are connected, except for two cases (lines X22 and I21), shown with shaded cells in Table 3, where the daily minimum load in combination with considerable DG penetration causes an increase in the reactive losses.
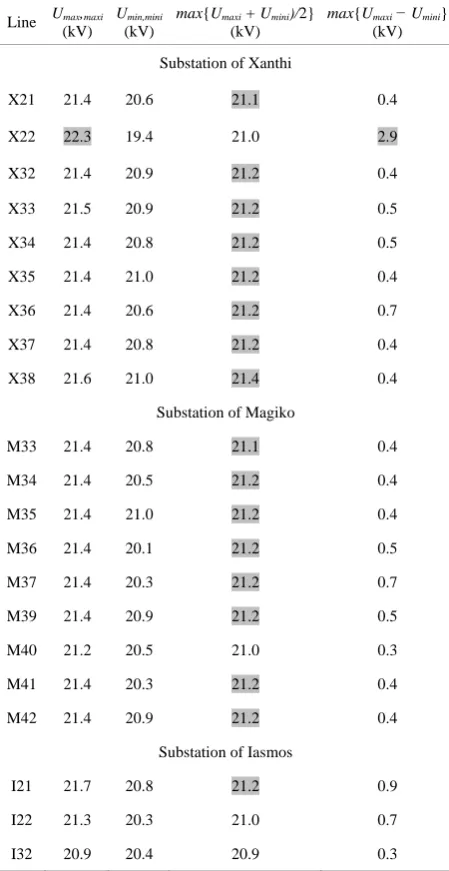
Table 4shows the results of the power flow analysis
concerning the limit values of the node voltages of the examined network. Specifically, the absolutely maximum node voltages Umax,maxi, the absolutely minimum node voltages Umin,mini, the maximum value of the median voltage, and the maximum value of the quantity Umaxi
-Umini per line are recorded.
Taking into account that the nominal voltage of the examined network is 20 kV, the EN 50160 [14] is satis-fied if the node voltages remain inside the range 18 kV ≤ Ui ≤ 22 kV. This does not apply only for the line X22, where the possible operation of the hydroelectric units during the night (operating situation S6), in combination with the fixed capacitors, causes voltage rise exceeding the acceptable limits in some nodes.
Table 4. Limit values of the node voltages.
Line Umax,maxi
(kV)
Umin,mini
(kV)
max{Umaxi + Umini)/2}
(kV)
max{Umaxi − Umini}
(kV)
Substation of Xanthi
X21 21.4 20.6 21.1 0.4
X22 22.3 19.4 21.0 2.9
X32 21.4 20.9 21.2 0.4
X33 21.5 20.9 21.2 0.5
X34 21.4 20.8 21.2 0.5
X35 21.4 21.0 21.2 0.4
X36 21.4 20.6 21.2 0.7
X37 21.4 20.8 21.2 0.4
X38 21.6 21.0 21.4 0.4
Substation of Magiko
M33 21.4 20.8 21.1 0.4
M34 21.4 20.5 21.2 0.4
M35 21.4 21.0 21.2 0.4
M36 21.4 20.1 21.2 0.5
M37 21.4 20.3 21.2 0.7
M39 21.4 20.9 21.2 0.5
M40 21.2 20.5 21.0 0.3
M41 21.4 20.3 21.2 0.4
M42 21.4 20.9 21.2 0.4
Substation of Iasmos
I21 21.7 20.8 21.2 0.9
I22 21.3 20.3 21.0 0.7
I32 20.9 20.4 20.9 0.3
upper limit, but the excess, although concerning enough nodes, is marginal. Only the line X22 has a remarkable problem, according to the second requirement, concern-ing many nodes near the connection point of a 1.08 MW hydroelectric plant and the simultaneous existence of a 900 kVAr fixed capacitor near it. Several alternative scenarios were examined in order to overcome the prob-lem, and the operation of the network was significantly improved by replacing the fixed capacitor with switched capacitors. Otherwise, the above mentioned hydroelectric plant is not permitted to be connected, in order to avoid exceeding the technical constraints.
5. Conclusions
The purpose of this paper was to investigate the impacts
of DG penetration in a real rural MV power distribution network. The network is very extensive, consisting of twenty one overhead lines fed by three power substa-tions.
Power flow and short-circuit analysis were carried out using a commercial-grade software package to determine the changes caused by the DG penetration to the currents, losses, voltage profile, and short-circuit level of the ex-amined lines. The majority of the DG units to be con-nected are PV units, the penetration is not very high, and the connection points are at sublateral branches with small cross sections.
The results of the analysis are as follows:
• The losses are reduced in all the lines when the DG units are connected.
• There is not any extension of the conductor rated currents, since the DG penetration remains small compared to the load and there is also no significant reverse power flow.
• The short-circuit level at the MV busbars of the in-feeding substation, where it has the highest value, remains below the network design value, as the DG units are connected at remote sites and the lines have many kilometres of conductors with small cross sec-tion (high resistance).
• The main impact of the connected DG units is on the voltage profile of the examined lines, particularly for the daily minimum load (voltage rise) and for lines with fixed capacitors. In these cases, except for the appropriate regulation of the transformer tap changer, solutions should be sought, such as the replacement of the fixed capacitor with switched capacitors. The general conclusion is that the arbitrary DG ac-commodation leads to network sterilisation, as recorded in [6,7], and perhaps to violation of important technical constraints. So, every new DG penetration in any net-work must be examined using the appropriate tools in order to find solutions to the problems that arise.
The extended accommodation of PV resources in a distribution network reduces the losses, because of their close vicinity to the network loads. However, as the PV units operate with a capacitive power factor, they cause impermissible voltage rise during the low load periods. So, either a differentiation in the power factor of the PV units or an integration of voltage control methods is ap-propriate in order to avoid problems relating to the net-work voltage profile.
6. List of Symbols
Ii: current of the branch i
Iirated: rated current of the branch i ''
k
I : initial symmetrical short-circuit current
rG
Qloss: reactive losses
SCL: short-circuit level
SCLmax: maximum short-circuit level
SCLrated: short-circuit level network design value
Ui: voltage value in the node i
UN: nominal voltage value
Umaxi: maximum voltage value in the node i
Umax,maxi: absolutely maximum node voltage value in the node i
Umini: minimum voltage value in the node i
Umin,mini: absolutely minimum node voltage value in the
node i
REFERENCES
[1] T. Ackermann, G. Andersson and L. Soder, “Distributed Generation: A Definition,” Electric Power Systems Re-search, Vol. 57, No. 3, 2001, pp. 195-204.
http://dx.doi.org/10.1016/S0378-7796(01)00101-8
[2] A. Wallace and G. Harrison, “Planning for Optimal Ac-commodation of Dispersed Generation in Distribution Networks,” Proceedings of the CIRED 17th International Conference on Electricity Distribution, Barcelona, May 2003, 6 p.
[3] A. Bhowmik, A. Maitra, S. M. Halpin and J. E. Schatz, “Determination of Allowable Penetration Levels of Dis-tributed Generation Resources Based on Harmonic Limit Considerations,” IEEE Transactions on Power Delivery, Vol. 18, No. 2, 2003, pp. 619-624.
http://dx.doi.org/10.1109/TPWRD.2003.810494
[4] A. Keane and M. O’Malley, “Optimal Allocation of Em-bedded Generation on Distribution Networks,” IEEE Transactions on Power Systems, Vol. 20, No. 3, 2005, pp. 1640-1646.
http://dx.doi.org/10.1109/TPWRS.2005.852115
[5] G. Celli, E. Ghiani, S. Mocci and F. Pilo, “A Multi-Ob- jective Evolutionary Algorithm for the Sizing and Siting of Distributed Generation,” IEEE Transactions on Power Systems, Vol. 20, No. 2, 2005, pp. 750-757.
http://dx.doi.org/10.1109/TPWRS.2005.846219
[6] G. N. Koutroumpezis, A. S. Safigianni, G. S. Demetzos and J. G. Kendristakis, “Investigation of the Distributed Generation Penetration in a Medium Voltage Power Dis-tribution Network,” International Journal of Energy Re-search, Vol. 34, No. 7, 2010, pp. 585-593.
[7] G. N. Koutroumpezis and A. S. Safigianni, “Optimum Allocation of the Maximum Possible Distributed Genera-tion PenetraGenera-tion in a DistribuGenera-tion Network,” Electric
Power Systems Research, Vol. 80, No. 12, 2010, pp. 1421-1427.http://dx.doi.org/10.1016/j.epsr.2010.06.005
[8] B. Kuri, M. Redfern and F. Li, “Optimization of rating and positioning of dispersed generation with minimum network disruption,” Proceedings of theIEEE Power En- gineering Society General Meeting, Denver, June 2004, pp. 2074-2078.
[9] K. Nara, Y. Hayashi, K. Ikeda and T. Ashizawa, “Appli-cation of Tabu Search to Optimal Placement of Distrib-uted Generators,” Proceedings of the IEEE Power Engi-neering Society Winter Meeting, 2001, pp. 918-923. [10] G. Celli and F. Pilo, “Optimal Distributed Generation
Allocation in MV Distribution Networks,” Proceedings of the 22nd IEEE PES International Conference on Power Industry Computer Applications PICA, Sydney, 20-24 May 2001, pp. 81-86.
[11] K. H. Kim, Y. J. Lee, S. B. Rhee, S. K. Lee and S. K. You, “Dispersed Generator Placement Using Fuzzy-GA in Distribution Systems,” Proceedings of the IEEE Power Engineering Society Summer Meeting, Chicago, 21-25 July 2002, pp. 1148-1153.
http://dx.doi.org/10.1109/PESS.2002.1043458
[12] W. El-Khaltam, K. Bhattacharya, Y. Hegazy and M. M. A. Salama, “Optimal Investment Planning for Distributed Generation in a Competitive Electricity Market,” IEEE Transactions on Power Systems, Vol. 19, No. 3, 2004, pp. 1674-1684.
http://dx.doi.org/10.1109/TPWRS.2004.831699
[13] http://www.neplan.ch/html/e/e_home.htm
[14] European Norm EN 50160: Voltage Characteristics of Electricity Supplied by Public Distribution Systems, CENELEC, 1999.
[15] S. A. Papathanassiou, “A Technical Evaluation Frame-work for the Connection of DG to the Distribution Net-work,” Electric Power Systems Research, Vol. 77, No. 1, 2007, pp. 24-34.
http://dx.doi.org/10.1016/j.epsr.2006.01.009
[16] Technical Requirements for the Connection of Independ-ent Generation to the Grid, Public Power Corporation (PPC), Greece, 2004.
[17] IEC 60909-0: Short-Circuit Currents in Three-Phase a.c. Systems, Parts 0-4, 2002.
[18] T. Boutsika and S. A. Papathanassiou, “Short Circuit Calculations in Networks with Distributed Generation,” Electric Power Systems Research, Vol. 78, No. 7, 2008, pp. 1181-1191.