Analysis of Social Network: A Community Oriented Case
Study
Devyanshu Pal
University of Information and Communication Technology, GGSIPU
Sec-16 C Dwarka, Delhi
Rahul Johari
University of Information and Communication Technology, GGSIPU
Sec-16 Dwarka, Delhi
ABSTRACT
To begin with, the network that enables millions of people to remain connected with each other irrespective of the caste, color and creed online is the Social Network. Social network is the boundary less network which had gained immense popularity in the last couple of years as more and more people are becoming wired. Interest of people is increasing in social networks and so is the usage of it. All this has resulted in manifold increase in the network traffic thereby draining network resources such processing power, server storage space and bandwidth and has also posed big challenge in terms of security of the naïve users on the web. In the current work analysis of the issues in the Social network and the relationships between the users of a social network in terms of network theory is done. Investigation on how one can form relations among different communities, explore property of connectedness -among and within them, impact of mobility of users (active nodes/passive nodes), betweeness and centrality etc is shown. The objective of the work is also to analyze how different communities are fractioned on the social network, what are the relationships between them, on what factors are they connected? Further it is also shown how a message reaches from user of one community to user of another community taking minimum distance and time. Whether is it possible for the message to reach from a particular community to another community and if it is then what route it takes, how much nodes it covers, in how much time it reaches and what number of nodes are affected by this. To achieve it various Social network analysis tools were explored such as GraphInsight, Gephi, Social Network Visualizer (SOcNetV) and NetMiner etc. and the proposed work/simulation is exhibited using the Gephi tool [1].
General Terms
Nodes, Edges, Connectedness, Graph Analysis
Keywords
Social Network Analysis, Graph, Relationships, Communities.
1. INTRODUCTION
Social Network is a network where people are connected to each other through several devices and it becomes very convenient to remain in contact with each other with the help of technologies available today such as accessing social networking websites through mobile phones, laptops, PDA et al. People carry these devices with them almost all the time and it becomes easier to deliver a message from one human being to another. Social network is proving to be very useful for everyone. Be it youth, middle ages and senior citizens, everybody is using and getting advantage of the giant network all around the world. Social networking websites such as Facebook, Twitter, and LinkedIn etc. provides a platform to users to remain in contact constantly with their friends/peer
groups, relatives, teachers and all. It provides a platform to express views to the whole world openly without any restriction. It acts like a social forum which keeps check on the administration, the platform where everyone has his/her say without fearing anyone. Impact of social media on Politics and Bureaucracy is also increasing day by day and hence the quality of services is increasing. Anyone can raise any issue and when the issue reaches at its peak that is, many users comes to know about it the same issue comes in the eyes of the concerned authorities and actions are taken very soon as compared to past decade. Growing impact of social network has direct or indirect effect on everyone’s life. Social impact is leading to good relationships within user. Political impact is leading to good governance and administration of the country. Educational impact where students can interact with experts and other experienced students from their home. Motivating people for good cause and hence trying to incorporate values.
1.1 SNA (Social Network Analysis)
Social Network Analysis is the analysis in which one studies the graph and the relationships between the nodes of the graph of a social network. In the work by analyzing social network inferences were drawn such as how the communities formation took place, distinction between communities, status and activeness of users, comparison of communities- which are major communities and which are minor communities and optimization on the number of communities in network.
Social Network is comprised of Nodes, Ties and Communities. Nodes represent users on social network. Ties represent relationships between the users and communities represents groups of users of a particular interest (socio-economic-political- religious). People, online belongs to different groups. This division can be on basis of the interest of people. Such as users from same school/college will form a group, colony members’ society will form another group; politically active people will for different group, interest based on entertainment-movies, music, rock bands, in books etc. Each particular group forms one community and one user can be a member of one or more community at a time. What is shown in this paper is the possibility of delivery of a message from one community to another, nodes through which the message will travel, total distance it will take to reach the destination and whether the message will take the optimal path or will travel through a deviated path. The paper shows 3 real time case studies to demonstrate this.
1. A Facebook User Account Analysis
2. Rajya Sabha (Indian Parliament) Committees analysis.
3. Empirical Study of GGSIPU Cultural Society
from the complex datasets of above case studies. The graphs clearly showed distinct communities and members. Comparison of all the case studies was done.
1.1.1
Facebook User Account Analysis
In Facebook account analysis, one of the author’s accounts was analyzed. The account demonstrated is of Author – Devyanshu Pal.1.1.2
Rajya Sabha Committees’ Analysis
In Rajya Sabha Committee’s Analysis, analysis of different committees of The Indian Parliamentary Upper House – The Rajya Sabha was done. Sample data of seven communities was selected and operated with the tool.1.1.3
Empirical Study of GGSIPU Cultural
Society
In this study an online survey was done to get the data of Guru Gobind Singh Indraprastha University’s Cultural Society. The data was operated with the tool and different communities were formed.
1.2 Terminologies Related to our Study
Degree Centrality- It tells the number of nodes connectedto a particular node. Higher the centrality, higher will be the connections; the node will perform more activity than others and is a better utility to the social network.
Betweenness Centrality – The node having more connections in a particular community has a powerful role and performs a great influence on other nodes within the community.
Network centralization – The network is divided into sub communities and these communities are connected by mediating nodes. These nodes form the basis of connection between two different communities and if these are removed then we will be left with disconnected sub-networks.[2]
1.3 Social Network: Advantages, Benefits,
Issues, Problems
Social network has become an agent to create global awareness and has become a good source of general knowledge with all the happenings of today’s world being posted at one place and along with the views of person from every community just at one place and of course which is easy accessed through our cell phones or laptops/pcs.
Everything has its disadvantages too and so has social network. It can be seen from recent examples that social media can be used to provoke mass easily. This may lead to violence such as communal violence. As there is practically no possibility of checking of almost each and everything on the social network, completely controlling the giant network is practically not possible! Yes, there are ways of reporting illegal activities but the speed of spreading of any message/post/activity is very fast that such thing can’t be stopped. Mischief-makers find it easy to achieve their goal with the social media. No check provides them boundary less platform to perform their activities. Another disadvantage is there is no moral code of conduct for the network. Anybody, however he/she likes writes/post and there is hardly anything that one can do or take action against him/her. Yes there is freedom of speech but that too has to come with moral code of conduct which if not taken into care can harm the harmony of society. There is always a possibility that the trouble maker
will escape from the e-platform. Election campaigning too is done without a code of conduct on social media.
Such examples do count in for issues related to social networking websites but the benefits of the giant is too vast that it can be to an extent tolerated. In addition there are stringent laws coming in to check these issues by government of many countries. Overall, at this point of time we can’t imagine our life without social media and the effect of it on society.
1.4 Tool Used
Many tools are available for the analysis. Some of the tools are: Gephi[1], Social Network Visualizer[7], NetMiner[8], Egonet[9], GraphStream[10], Netlytic[11] etc.
In the study, a tool named Gephi was used to analyze the data. Gephi is an interactive visualization and exploration platform for all kinds of networks and complex systems, dynamic and hierarchical graphs. Visual representation is done as it is a powerful method for channeling complex information into simple visual format and results can be inferred easily as will be shown further.
The visualization is done through exhibiting nodes and connections in various layouts examples:
1. ForceAtlas: The layout attracts nodes connected to each other and repels nodes that are disconnected.
2. Label Adjust: Adjusts the labels for easy reading and prevents overlapping of labels.
3. Expansion: This layout expands the graph so that it is easier to see all the nodes distinctly.[3]
Above three layouts are used in the case studies. Further, nodes can be assigned different colors, sizes, which define the centrality and belongingness of nodes to the communities.
1.4.1
Methodology Adopted
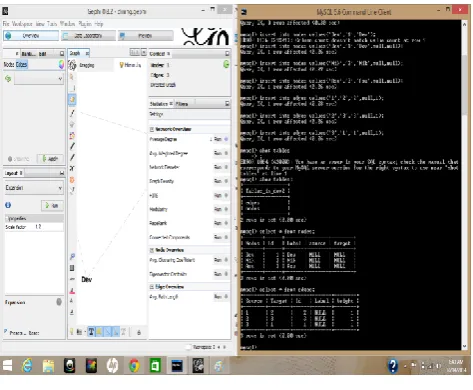
Database import from Excel/SQL:
The databases from Excel/SQL were imported in the tool, and were worked, building communities from the data and drawing inferences from the simplified output.
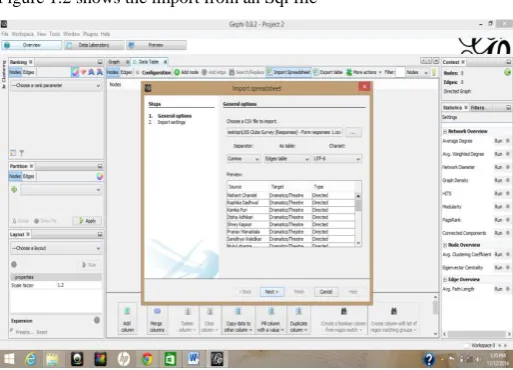
[image:2.595.317.574.554.739.2]Figure 1.1 shows the import from an excel file. The file format is .csv(comma separated) file. Import from excel was used in the proposed work.
Figure 1.2 shows the import from an Sql file
Figure 1.2 Import of database from SQL
2. EXPERIMENTAL DATASETS
2.1 acebook Account Dataset
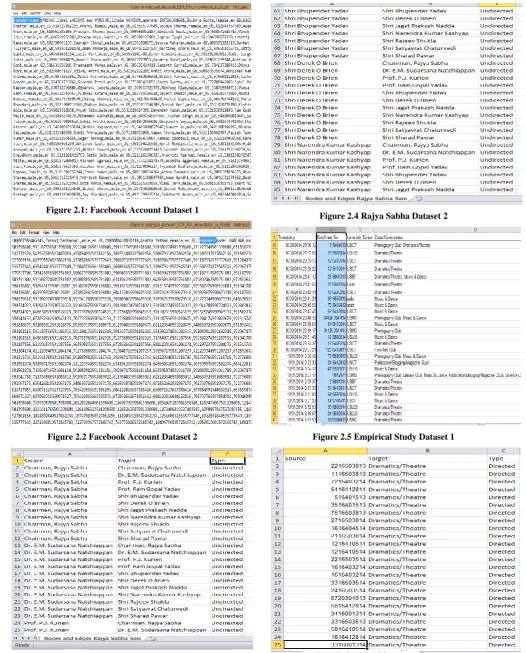
Facebook account dataset was provided by the Facebook application Netvizz. It provided a .gdf file. This file can be easily imported in the tool and can be worked upon to prepare a graph out of the complex data. [1],[4]. Figure 2.1 and Figure 2.2 shows the dataset file. The file is a notepad file. Figure 2.1 shows the nodes and Figure 2.2 shows the edges
2.2 Rajya Sabha Committees Dataset
The Rajya Sabha Committees’ data is directly taken from the website of Rajya Sabha [5]. The data is available on the public domain. Raw data was analyzed, a sample was taken from it and an excel file was prepared of source and target nodes and imported into the tool. The sample taken was of 7 communities namely
1. Business Advisory Committee.
2. General Purposes Committee.
3. Govt. Assurances Committee,
4. House Committee.
5. MPLADS Committee.
6. Papers laid on the table Committee.
7. Ethics Committee.
The data from the website was organized into a new excel file of source and target nodes. Figure 2.3 and Figure 2.4 shows the dataset of this case study.
2.3 Empirical Study of GGSIPU Cultural
Society
For this case study an online survey [6] was done to get the empirical data regarding the members of the communities/clubs present in GGSIPU Cultural Society SRIJAN. SRIJAN is Indraprastha Society for Creative Expression, is constituted for co-curricular clubs. Data obtained from survey was examined and imported into the tool. Again, the data was organized into an excel file of source and target nodes. Figure 2.5 shows the original survey datasets and Figure 2.6 shows the excel file of source and target nodes.
3.
PROCEDURE
1. Firstly, a file with extension .gdf was directly imported into the tool. This methodology was used in case study of Facebook Account Analysis. [4]
2. Secondly, Data was imported into the tool with help of spreadsheets saved in .csv(comma separated). These files have source nodes and target nodes. Additional attributes too can be added such as weight, type etc. For case study.
Rajya Sabha and Empirical Case Study this type of import was used.
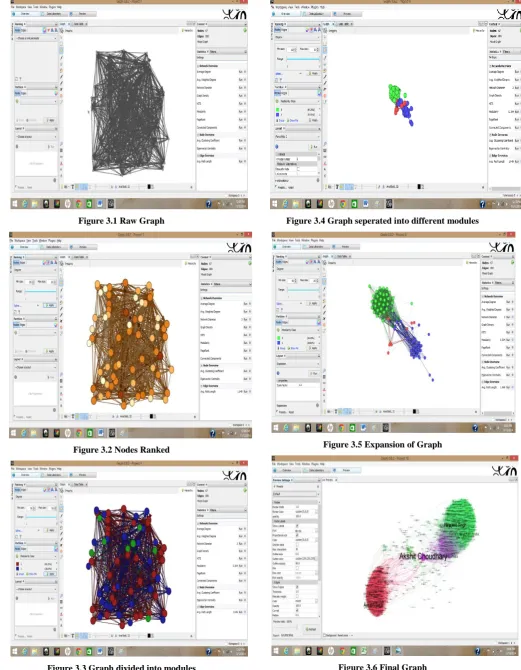
3. After the import, a raw graph was created through the tool. The graph forms a complex structure with no distinction between the members and communities they belong to. Figure 3.1 shows the raw graph being formed in the tool.
4. After this, nodes were ranked on the basis of their number of connections. The nodes were given different sizes. Nodes having more connections are bigger in size as compared to the nodes having less number of connections. Figure 3.2 shows ranked nodes with different sizes.
5. The graph was further divided into different modules. Each module represents different communities. Each module was given a different color so that communities are shown distinctly. For example, blue green red color coded communities. Figure 3.3 shows that graph is been divided into modules with each module having a different color.
6. To further clearly differentiate the layout ForceAtlas was applied. Figure 3.4 shows the separated communities
7. Now, Expansion layout was acted upon the graph. The graph reaches to almost final stage. The nodes were further rearranged and were given labels. Figure 3.5 shows the graph after expansion.
8. The final graph formed is shown in Figure 3.6
4.
OBSERVATIONS
1. Communities can be classified on the basis of two categories.
A. Connectivity: Differentiating communities on the basis of their connectivity
i. Connected: The communities are said to be connected if there is a common node between both the communities. There can be one or more common nodes for two communities to remain connected
ii. Isolated: The communities are said to be isolated if there is no connection between two communities. That is there is no common member of the communities.
B. Size: Differentiating communities on the basis of their sizes.
i. Major: The communities having high number of nodes as compared to other communities are major communities.
ii. Minor: The communities having less number of nodes as compared to other communities.
Figure 2.1: Facebook Account Dataset 1
Figure 2.2 Facebook Account Dataset 2
[image:4.595.316.569.81.405.2]Figure 2.3 Rajya Sabha Dataset 1
Figure 2.4 Rajya Sabha Dataset 2
Figure 2.5 Empirical Study Dataset 1
Figure 3.1 Raw Graph
[image:5.595.316.573.73.282.2]Figure 3.2 Nodes Ranked
Figure 3.3 Graph divided into modules
Figure 3.4 Graph seperated into different modules
Figure 3.5 Expansion of Graph
[image:5.595.45.567.74.745.2]3. The edges coming out of each node member to the committee are directed edges. The edges are among the members of the same communities are undirected edges which represents that they shares a common interest.
4. The distance travelled will be equal to number of hops/nodes the message travelled and is dependent on the connectivity of nodes and route to the destination.
5. RESULTS OBTAINED
5.1 Graph Analysis – Before
The graph of all the case studies before showed a complex version of graph of nodes and edges. Nodes represent the members of the clubs/communities/committees, and the Edges represent the relationships between the members of the clubs/ communities/ committees. The graph doesn’t give any distinction between clubs/communities/committees and members. And neither represents the relationships clearly.
Figure 4.1 – Raw Graph, Facebook Account
Figure 4.2 – Raw Graph, Rajya Sabha Committees
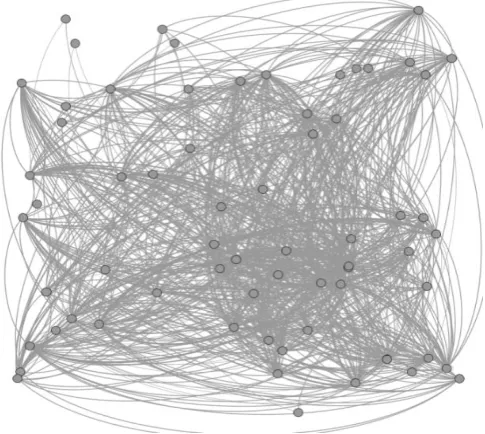
Figure 4.3 – Raw Graph, Empirical Study
It is to be noted that the crux of analysis is on the divided communities and not all nodes in particular. The mediating nodes were clearly visible in the graphs which were required for performing function. The analysis of all the 3 case studies is shown as below
5.2 Graph Analysis – After
Later on, graph showed a clear distinction between the clubs/communities/committees and the members. In all three case studies the final graph obtained is a much simpler graph and inferences can be drawn easily from them. Delivery of message is shown from one of the community to another taking each of the case study separately.
1. Case study 1- Facebook Account Analysis
2. The graph divides itself into two major communities, namely Community1 and Community 2, i.e. School Friends and College Friends respectively. Figure 4.4
3. One major node identified was Akshit Choudhary in this example. That is, it has the maximum number of connections to both the communities, Community1 and Communtiy2.
4. A message from one node of Community1 to another node Community2 can be delivered to these mediating nodes.
5. For example, A message is to be from Aakash Garg of Community2 to Niripjeet in Community1. This message will travel through the mediating node Akshit Coudhary (largest node as inferred from the graph).
a. Aakash garg will send the message to a node which is connected to Akshit Choudhary in Community2 (Distance travelled = 1).
b. The second node will then pass the message to Akshit Chodhary (Distance travelled = 2).
c. Akshit will then pass the message to Community1. If he is directly connected to the destination node the message will reach destination in Distance 3.
d. If he is not directly connected to the destination node then he will send the message to another node in the route to the destination. And then the message will reach to destination taking distance = 4.
6. Above message took 3/4 hops to reach from source to destination.
5.2.1
Casestudy2–RajyaSabha Committees’
Analysis
1. The graph divides itself 7 different committees. Fig4.5
2. 5 communities are connected with each other through one or more than one common members. Communities connected with each other namely Business Advisory Committee, General Purposes Committee, Govt. Assurances Committee, MPLADS, and Ethics Committee.
3. A message from one committee can be delivered to any of the other committee through the mediating nodes. If the committee is not connected to any other committee via mediating nodes then it is an isolated community. Two identified isolated committee in this case are House committee and Papers laid on the table Committee.
4. There are 3 major and 4 minor committees identified
I. MAJOR COMMITTEES
i. Business Advisory Committee.
ii. General Purposes Committee.
iii. Govt. Assurances Committee.
II. MINOR COMMITTEES
i. House Committee.
ii. MPLADS Committee.
iii. Papers laid on the table Committee.
iv. Ethics Committee.
5. Four major nodes identified are:
i. Sh. S C Misra
ii. Chairman, Rajya Sabha
iii. Dr. E.M Sudarsana Natchiappan
iv. Prof P.J Kurien
6. A message is to be delivered from Sh. Avinash Khanna from Govt. assurance commitee to Sh. Rajiv Shukla in Business advisory committee.
i. Sh. Avinash khanna can pass the message to Sh. S C Mishra as he is one member that belongs to most of the committees (inferred by side of the node). Distance travelled = 1.
ii. Sh S C Mishra then can contact to another node having connections with Business advisory club and with S C Mishra. In this example node identified is Dr. E.M Sudarshana. Distance travelled = 2.
5.2.2
Case Study 3 – Empirical Study Cultural
Societies’ Graph Analysis
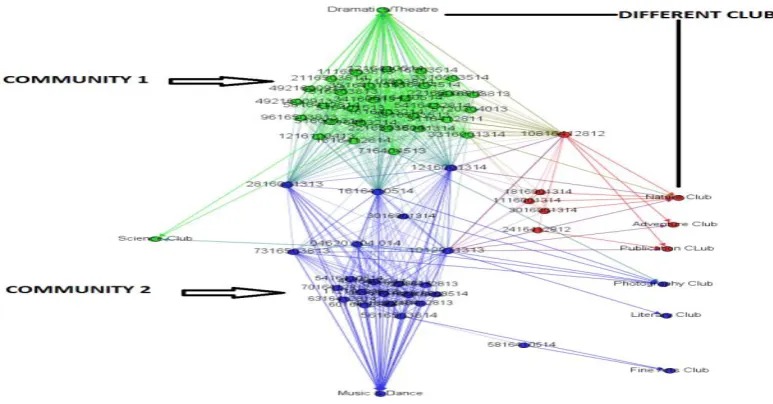
1. The graph divides itself into 9 different clubs/communities. Figure 4.6
2. Two major communities identified, namely
i. Community1 - Dramatics/Theatre Club
ii. Community 2 - Music& Dance Club respectively.
3. 7 minor communities identified, namely
i. Nature club
ii. Adventure club
iii. Publication club
iv. Photography club
v. Fine arts club
vi. Literary club
vii. Science club
4. All other minor communities (7 clubs), are connected with each other and with the two identified major communities through 8 mediating nodes.
[image:7.595.61.592.52.754.2]Figure 4.1 Facbook Account Raw Graph
[image:7.595.320.563.77.294.2]Figure 4.2 Rajya Sabha Committees’ Raw Graph
[image:7.595.321.576.433.734.2]Figure 4.3 Empirical Study Raw Graph
Figure 4.4 Facebook Account Final Graph
Figure 4.6 Empirical Study Clubs’ Final Graph Table 1.1 Analysis of Graphs obtained
S.no. Graph Fractions/
Communities Formed
Communities’ Names Mediating Node(s) Total number
of nodes and edges
1 Facebook Account
2 Major Communities
1. School Friends
2. College Friends Akshit Choudhary
Nodes- 616
Edges- 16725
2
Rajya Sabha Committe
es
3 Major 4 Minor Communities
Major Committees
1. Business Advisory
2. General Purposes
3. Govt. Assurances
Minor Committees
1. House Committee.
2. MPLADS Committee.
3. Papers laid on the table Committee.
4. Ethics Committee.
1. Sh. S C Misra
2. Chairman, Rajya Sabha
3. Dr. E.M Sudarsana Natchiappan
4. Prof P.J Kurien
Nodes-67
Edges-895
3
Empirical Study of Cultural Society
2 Major 7 Minor Communities
Major communities
1. Dramatics/Theatre Club
2. Music& Dance Club
Minor communities
1. Nature club
2. Adventure club
3. Publication club
4. Photography club
5. Fine arts club
6. Literary club
7. Science club
1. 10816412812
2. 1012971313
3. 1416101411
4. 1616410514
5. 2816001313
6. 04620 304 014
7. 7316503813
8. 04120304014
Nodes – 66
[image:8.595.47.551.312.757.2]5. These mediating nodes are identified as : 10816412812, 1012971313, 1416101411, 1616410514, 2816001313, 04620304014, 7316503813, 04120304014
6. A message from one community can be delivered to any of the other community through these mediating nodes.
7. For example, A message is to be delivered through 12016412811( in Fine Arts Clubs) to 1216100413 in Dramatics club. It can be reached through the following path.
i. Message from 12016412811 to 5616503814(Both common to Fine Arts Club). Distance = 1.
ii. 5616503814 being the member of Music & Dance can reach to any of the mediating node say 1616410514. Distance = 2
8. As 1616410514 is a member of Dramatics club so he can directly deliver the message to the respective node that is 1216100413 for whom the message was destined to. Distance travelled = 3.
9. Total distance travelled = 3
Similarly, other messages can be delivered from one community to another and the same process can be used to find the number of hops it takes to reach to the destination.
6. CONCLUSION AND FUTURE WORK
The objective to form the communities from a raw data, fraction them according to their interest and show relations and connectedness among them( betweeness, centrality) is achieved. To analyze the graph to find whether the message can be reached from one community to another is achieved and number of nodes it takes in how much time is easily calculated in the proposed work. The data used in the graph is static. Dynamic data can be used according to the expiry of the membership and thus graph can be updated with respect toa time interval (Yearly). The time the message will take depends on the speed of the node and environment and type of relationship which is not yet represented in this graph can be included further. The type of relationships between the nodes can be set, very-good/good/moderate/bad/very-bad, which can
be used to determine the time and speed with which the message will reach to the destination node. And if relationship is very-bad it can reach to the destination with a deviated route.
7.
ACKNOWLEDGEMENT
We would like to thank administration of USIT, GGSIPU, Dwarka, Delhi for providing good academic environment for the current work.
Disclaimer: All data used is only for academic and research purposes. No further misusage is done of the data from our side. The data was taken from official websites and we do not take any responsibility of authenticity of data.
8.
REFERENCES
[1] www.gephi.org, the official website of the tool.
[2] www.orgnet.com/sna.htm
[3] https://gephi.github.io/users/
[4] https://persuasionradio.wordpress.com/2010/05/06/using-netvizz-gephi-to-analyze-a-facebook-network/
[5] www.rajyasabha.nic.in,
[6] https://docs.google.com/forms/d/1gCTPWNq1UGqMyrC Sy5ehJmYRve3Z9hyBcNLB_ZCHeeI/viewform,
[7] http://socnetv.sourceforge.net/
[8] http://www.netminer.com/index.php
[9] http://sourceforge.net/projects/egonet/
[10]http://graphstream-project.org/