RELATIONSHIP BETWEEN ENTRY QUALIFICATIONS
AND PERFORMANCE IN GRADUATE STUDIES
MAIZAM ALIAS
RELATIONSHIP BETWEEN ENTRY QUALIFICATIONS
AND PERFORMANCE IN GRADUATE STUDIES
"Maizam Alias and
2Ahmad Faizal Mohd. Zain
uCentre for Graduate Studies, Kolej Universiti Teknologi Tun Hussein Onn, Batu Pahat, Johor Darul Ta'zim
ABSTRACT
Quality of students' intakes is one of the factors that contribute to quality of graduates. Where post-graduate studies is concerned undergraduate CPAs has always been the strong basis for either rejecting or accepting an applicant. For a course of study of the same discipline, it is a accepted believe that, high CPA at degree level is associated with good performance at graduate level. Less known is how good the undergraduate CPA at predicting performance in graduate studies. Much less known is how good CPA in one discipline at predicting CPA in another discipline. In this study, we attempted to discover the relationship between undergraduate CPAs, field of study at undergraduate level, and graduate performance in technical teacher training programme. Our sample was 612 students from five cohorts of the Masters in Technical and Vocational Education programme. Our data were based on students' academic records. Using Pearson product Moment correlations method, we found that overall; the correlations between undergraduate and graduate CPAs are weak but statistically significant (r=0.35, p<0.01). Our analyses on the outlier cases indicate an association between active participations in co-curricular activities at the undergraduate level and high graduate CPA. We therefore recommend that in addition to undergraduate CPA, other variables could be looked into for selection of students into graduate studies.
INTRODUCTION
Having students that graduate with flying colours is the aim of every university. Graduation qualification which is the product of university education however has been said to depend not only on the learning process in the university itself but also on the quality of input i.e., the quality of undergraduate students.
One quality indicator of undergraduate students that have been consistently used for entry into graduate programmes is academic achievement at the undergraduate level which has been narrowed down to their undergraduate Cumulative Point Average (CPA). Similarly, the CPA has also been generally accepted as the indicator of graduating quality. The question is how good really is the undergraduate CPAs at predicting graduate CPAs? In this article we are going to present to you our findings on a preliminary study that we did on one of our graduate programmes, the Masters in Technical and Vocational Education (MTVE) programme.
M T V E P R O G R A M M E DESCRIPTION
The MEd in Technical and Vocational education is a programme for training graduate teaching staff in post secondary technical institutions under the Ministry of Education, namely, polytechnics and community colleges. The MTVE programme is a pre-service post-graduate teacher training programme. As such, the students that are enrolled into this programme are fresh graduates that have neither teaching experience nor professional certificate in teaching. All students have been selected and sponsored by the Ministry of Higher Learning.
To meet the educational needs of these students, the programme is designed with two major components, the professional training component and the master's component. As a consequence students in this programme are required to take more credits compared to the usual Masters in Education programme. Therefore, it could be said that the programme is quite a demanding one.
Students for the MTVE programme come from varied disciplines which could be anything from engineering to business to fashion design. The number of students enrolled into this programme and their corresponding undergraduate disciplines is determined by "market needs"; as identified by the relevant authorities. The multi-discipline background of our students poses a great challenge not only to the academic staff involved but also to the university management in general. We are therefore, extremely interested to determine the factors that contribute to successful completion of the course.
PREDICTOR V A R I A B L E S F O R GRADUATE SUCCESS
The literature provides wide array of studies that attempts to identify the one best predictor variable for success in graduate studies. Variables studied include Graduate Record Examination (GRE) scores, Graduate Management Aptitude Test (GMAT), class of undergraduate degree (first / second-upper etc.), academic ability as rated by academic advisors as well as scores on non-cognitive measures. The indicators for graduate performance also vary from one study to another which may include first year grades, mid-programme grades, subjects' grades at advanced levels and graduate CPAs.
The results on GRE studies appear to vary from one discipline to another. Within the same discipline, the correlation also varies from one subject to another. For example, House and Johnson (2002) found that the correlation coefficients between GRE scores and subject grades in advanced psychology range from 0.24 - 0.58.
Studies on GMAT show that the correlation between GMAT scores and mid-programme grades is about 0.48 (Graduate Management Admission council, 2005). A validity range of 0.30 to 0.40 is generally considered good for standardized admissions tests, making the GMAT an outstanding predictor.
Correlations between class of undergraduate and graduate performance is also weak as shown by Lane et al., (2003) who did a study on hospitality students and found that the correlation between class of undergraduate degree and graduate CPA is about r=0.24, p<0.01. They also found that students with first class honours down to upper second class do consistently well in graduate studies while those below varies in their performance. Their study covers all the class of the undergraduate degree, from the third class to first class degree.
correlations between undergraduate performance and graduate performance are weak, i.e., between 0.24-0.38 and standardised admission test correlate better to graduate performance.
M E T H O D S
The samples consist of 612 students from the first five cohorts of the MTVE students beginning with the June 2001 intake. Data were gathered on undergraduate CPAs, gender, graduating CPAs, previous university attended and undergraduate disciplines based on students' application forms and academic records that are available to us.
Data were keyed-in by a member of staff and verified by the author on a random basis. SPSS version 13 was used for the analyses.
DATA ANALYSES A N D RESULTS
The results of the data analyses are divided into three parts, demography, descriptive statistics on CPAs, relationships between undergraduate and graduate CPAs and cases studies.
Demography
We analysed complete data sets of 612 students from five cohorts. Out of these, 214 and 398 i.e., 35% and 65% are males and females respectively. Females make the larger proportion of every cohort (M:F -30:70) except in cohort five where male students constitutes a larger proportion (M=56% and F=44%).
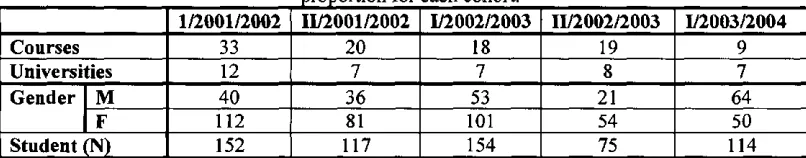
[image:4.595.87.490.504.583.2]The top four largest group based on academic disciplines are electrical engineering (21.6%), mechanical engineering (21.1%) and accountancy (11.8%) and mechanical engineering (11.1%). The top feeder universities are Kolej Universiti Teknologi Tun Hussein Onn (47.2%), Universiti Utara Malaysia (19.8%), Universiti Teknologi Malaysia (11.4%) and Universiti Teknologi Mara (9.6%). Table 1 shows the numbers of undergraduate disciplines, feeder universities, students according to gender for each cohort that are involved in the study. The type of undergraduate disciplines for each cohort is in line with the needs of the recipient institutions based on projections by the relevant authority.
Table 1: The number of undergraduate courses, feeder universities, students and gender proportion for each cohort.
1/2001/2002 11/2001/2002 1/2002/2003 11/2002/2003 1/2003/2004
Courses 33 20 18 19 9 Universities 12 7 7 8 7 Gender M 40 36 53 21 64 Gender
F 112 81 101 54 50 Student fN) 152 117 154 75 114
The percentage of students that did not finish their studies within the minimum three semesters duration is given in Table 2. Data on these students are excluded from our analyses.
Table 2: The percentage of students that fail to complete within the three semester duration specified.
1/2001/2002 11/2001/2002 1/2002/2003 11/2002/2003
The slightly higher number of incompletion rate in the second cohort is mainly due to students failing to complete their masters projects on time.
Descriptive statistics on CPAs
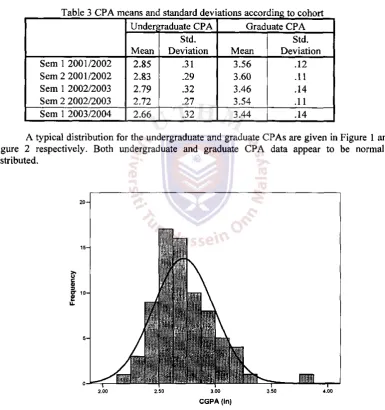
[image:5.594.99.485.236.646.2]The undergraduate CPAs that we are dealing with in this study range from 2.05 to 3.86 i.e. from the third class to the first class degree and the graduate CPAs range from 3.05 to 3.94. The means and standard deviations for the five cohorts are given in Table 3. The undergraduate CPAs appear to be getting lower over the years. This is due to some high achievers who fail to enrol in the programme for various reasons.
Table 3 CPA means and standard deviations according to cohort
Undergraduate CPA Graduate CPA
Std. Std.
Mean Deviation Mean Deviation
Sem 1 2001/2002 2.85 .31 3.56 .12
Sem 2 2001/2002 2.83 .29 3.60 .11
Sem 1 2002/2003 2.79 .32 3.46 .14
Sem 2 2002/2003 2.72 .27 3.54 .11
Sem 1 2003/2004 2.66 .32 3.44 .14
A typical distribution for the undergraduate and graduate CPAs are given in Figure 1 and Figure 2 respectively. Both undergraduate and graduate CPA data appear to be normally distributed.
CGPA (in)
[image:6.594.193.424.125.341.2]
25-CGPA (out)
Figure 2 Distribution of graduate CPAs
Relationships between undergraduate and graduate CPAs
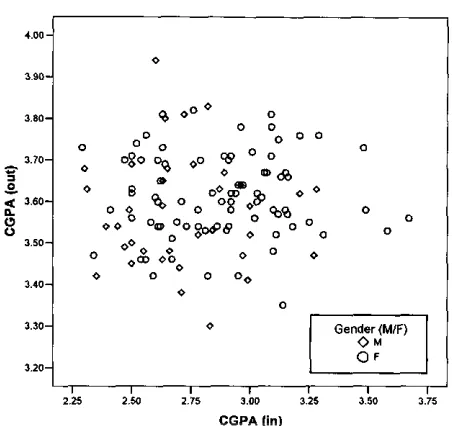
Scatter diagrams were drawn to see the type of relationship (if any) between the undergraduate and graduate CPAs. A typical example of such a scatter diagram is shown in Figure 3. From these diagrams it could be seen that the relationship between undergraduate and graduate CPAs are linear. Such as relationship observed in the second cohort however as shown in Figure 4.
[image:6.594.101.466.350.677.2] [image:6.594.169.401.448.680.2]4.00 3.90 3 80 3.70 P 3 O,
< 3 60
[image:7.596.157.383.124.337.2]Q. (9 O 3.50 3.40 3.30 3.20
Figure 4 Scatter diagram for the second cohort (intake semester II2001/2002)
There appears to be something untypical about cohort 2 and we will try to provide some explanations later on.
Correlations according to session
At this stage we know that the distributions are normal and the relationships are linear, therefore the next step is to estimate the strength of the relationships. We computed the correlation coefficients for the two sets of CPAs using the Product Moment correlations coefficient method which are shown in Table 4. Except for the second cohort, the correlation coefficients for each cohort are found to be weak but nevertheless statistically significant. The statistically significant correlations indicate that there is a definite trend, whereby those with high undergraduate CPAs tend to have high graduate CPAs.
The weak correlations are caused by outliers which, can be identified from the scatter diagrams. For example, for cohort 5, we found that removing two outliers increases the coefficient from r=0.44, (n = 114) to 7=0.59, («= 112). However, we feel that we cannot simply discard the outliers. A study of these outliers in itself could be useful for it may highlight other variables that are associated to graduate performance which we will show in the case study section. The results on the outlier analysis will be given under the case studies section.
Table 4 The correlations between undergraduate CPA and graduate CPA
Cohort 1 Cohort 2 Cohort 3 Cohort 4 Cohort 5
With outliers r=0.31*, 7?= 152 7=0.03, «=117 7=0.40* 72=154 7=0.39*, 72=75 7=0.44*, 77=114 ""Statistically significant at the 0.01 level (two-tailed)
We paid special attention to the second cohort in an attempt to understand the poor correlation. We did not find any explanation for the difference that can be attributed to distributions of discipline or feeder universities. However, we noticed one thing that may provide
o o
« e
o
° o
° o ° % «< 9 9 u o 0° o f O
oo J3
o o ®
o
o
o O*
1 c9>
o o o Gender (M/F) O M O F —I
2.25 2.50 1 —I 3.25
[image:7.596.85.490.608.659.2]an explanation for the absence of correlations. We notice that the range of data for the undergraduate CPAs within the second cohort is relatively small i.e., 1.38, (min.=2.29, max.= 3.67) as compared to the other cohorts which are, 1.53, 1.60, 1.61, and 1.69. Therefore, most probably the limited range of undergraduate CPA data in cohort 2 is the cause of the zero correlation.
Correlations according to class of undergraduate degree
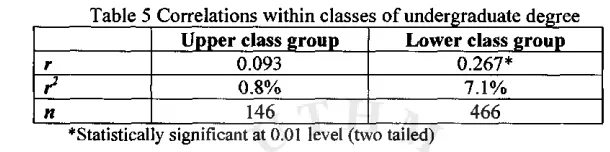
[image:8.596.125.430.290.366.2]To determine if class of undergraduate degree is associated with graduate CPA, we group the CPAs into two, 'upper second class and above' and 'lower second class and below' and compute the correlation coefficients. The results are shown in Table 5. Our findings contradict that of Lane et al. (2003). Their upper group performs consistently well as expected while ours is the reverse where the correlation between undergraduate and graduate CPA seems to be none-existing in the upper group.
Table 5 Correlations within classes of undergraduate degree Upper class group Lower class group
r 0.093 0.267*
r2 0.8% 7.1%
n 146 466
* Statistically significant at 0.01 level (two tailed)
Lane et al.'s students are Master of Arts Degree in Human Management and our students are Master in Technical and Vocational Education which are of similar nature because both programmes lean towards the social sciences. Gender proportion in both studies is also similar. We assume that the disciplines of their undergraduate discipline would have been similar to their graduate discipline because this is usually the norm. Assuming that it is so, it is quite easy to understand why the upper group tends to perform consistently well. However, when the field of study is very different, as what we have in KUiTTHO where students from technical disciplines go into education, high undergraduate performance may not be such a good predictor of graduate performance.
Next, we looked at the engineering and none-engineering distributions within the two class groups to explain our finding. For the upper group, 43.2% and 56.8% are engineering non-engineering students respectively. In contrast, for the lower group, 69.3% is from the non-engineering discipline while only 20.1% is none-engineering. Clearly the two groups are different in terms of engineering and non-engineering distributions. However, without additional analyses we are not sure if the high proportion of none-engineering students is a source of the low correlation in the upper class group.
We also notice that the upper group has smaller data range of undergraduate CPAs (range = 0.85) while the lower group have larger range of CPAs (range = 0.95). A limited data range could be the reason for the near non-existent correlation that we have here, because limited data range could definitely cause zero correlation.
Correlations according to undergraduate courses
Correlation coefficients according to undergraduate courses were also calculated using the Pearson method. Only the coefficients that are statistically significant and come from groups that are sufficiently large (n>30) are displayed in this table (Table 6). There are however, other statistically significant correlations that involve smaller samples which are not displayed in the table. For example, for Building, the correlation is 0.95 and statistically significant but the group
Table 6 Correlation coefficients between undergraduate and graduate CPAs according to courses
Undergraduate studies r r1 n
Civil engineering 0.42 17.6% 129
Electrical Engineering 0.25 6.3% 132
Mechanical Engineering 0.60 36% 69
Accountancy 0.60 36% 72
Note: All correlations shown are statistically significant at the 0.01 level (two-tailed)
The r2 indicates that the shared variance between the two sets of CPAs. Our coefficients are comparable and in some cases better than those found in other studies. For example, Lane et al (2003) only found a correlation of 0.24 while Kuncel, Hezlett, and Ones, (2001) found a correlation of 0.3. Therefore, in this case the predictive ability of undergraduate CPAs appears to be quite good especially for mechanical engineering and accountancy.
Associations between gender and graduate CPAs
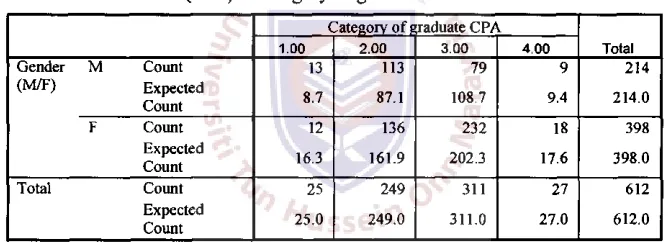
In this study we were also interested to see if there is any association between gender and graduate performance. We did cross-tabulations for expected and observed counts for male and female students according to category of their graduate CPAs as presented in Table 7.
Table 7 Gender (M/F) * Category of graduate CPA Cross tabulation
Category of graduate CPA
Total
1.00 2.00 3.00 4.00 Total
Gender M Count
(M/F) Expected Count 13 8.7 113 87.1 79 108.7 9 9.4 214 214.0 F Count Expected Count 12 16.3 136 161.9 232 202.3 18 17.6 398 398.0 Total Count Expected Count 25 25.0 249 249.0 311 311.0 27 27.0 612 612.0
If we look at category 2 and 3 in Table 7, we will see that an association is indicated between gender and class of graduate CPAs. For example, the observed male counts is higher than expected with female's the reversed in category 2 and in contrast observed female counts is higher than expected with male's the reverse in category 3. Association between gender and performance is supported by the results of the test of independence which is statistically significant.
Case studies
[image:9.595.127.461.366.487.2]Upon revisiting their records, we discovered that, 14 out of 18 cases (78%) in the LH group are males and only four are females. We also discovered that the LH males participated actively in sports and co-curricular activities during their undergraduate studies. One possible explanation for their poor performance in their undergraduate studies is an overemphasis on co-curricular activities at the expense of their studies. For admission into graduate studies therefore, we may need to look beyond the undergraduate CPA especially if it involves male, engineering students. Other variables such as active involvement in co-curricular activities at the undergraduate level may be added to the selection criteria.
For the HL group, 11 out of 12 cases (92%) are females. We have no explanation for this except maybe they got "tired" after studying so hard at the undergraduate level and they decide to relax their efforts. This is not something that is unheard of. However what surprises us more with this group is the fact that five out of the female students took geoinformatics at their undergraduate level. Nevertheless, we could not offer any explanation for this trend based on the academic records or our knowledge and understanding of geoinformatics and education. However, such scenario where doing a certain undergraduate course is negatively correlated to graduate performance has been observed in other studies.
CONCLUSION
This study attempted to determine if there is a relationship between undergraduate qualifications and graduate performance in the Technical and Vocational Education programme using CPA as performance indicators. The results show that in general, there is a statistically significant correlation between undergraduate CPAs and graduate CPAs. Nevertheless the correlations in many cases are quite weak. It was found that undergraduate CPAs for specific disciplines are better correlated to graduate CPAs compared to others with the highest being r =
0.60, (p<0.01).
Outliers' analyses indicate that those with low undergraduate CPA but exceptionally high graduate CPAs tend to be males, following the electrical engineering disciplines, very active in co-curricular activities at the undergraduate level and older compared to the others. Therefore, other variables such as undergraduate participations in co-curricular activities and age could be additional criteria that can be looked into for admission into graduate studies.
In conclusion, the finding from this study is similar to others which indicate that undergraduate CPAs are only weakly correlated to graduate CPAs. In other words, CPA alone may not be a good predictor of graduate performance. In cases where applicants with less than excellent CPAs, maybe we should look at other criteria in addition to CPAs, such as age, work experience, participations in co-curricular activities at undergraduate level, etc. before we actually reject or accept the students. Future studies could look at a combination of predictors for graduate success.
REFERENCE
Micceri, T. (2002), "An Extensive Exploratory Study of Graduate Students and Their Retention at a Major Public Metropolitan University", Paper Presented at the AIR Forum 2002
Toronto, Canada, June 2-6.
Wardlow, G. (1989), "International Students of Agriculture in U.S. Institutions Precursors to Academic Success". Journal of Agriculture Education, Spring, pp.17-22.
Graduate Management Admission Council® (2005) Fact Sheet: GMAT® Validity. Online at http://www.gmac.com/gmac/NewsCenter/Resources/FactSheetGMATValiditv.htm. [Accessed on April 15 2005]
House J. D., Johnson J. J. (2002). "Predictive validity of the graduate record examination advanced psychology test for grade performance in graduate psychology courses -Statistical Data Included", College Student Journal, March 2002.