© 2017, IRJET | Impact Factor value: 6.171 | ISO 9001:2008 Certified Journal | Page 1253
ANALYSIS OF PEDESTRIAN VEHICLE INTERACTIONS AND DELAY
INTERACTION ON TRAFFIC FLOW AT NTR NAGAR
B.VENKAT PRANAY
1, JAVEDALI M JALEGAR
21
Post graduate Student Department of Civil Engineering AVNIET, Ibrahimpatnam, India
2
Assistance Professor, Department of Civil Engineering AVNIET, Ibrahimpatnam, India
.
---***---ABSTRACT -
Several studies are there to understand the pedestrian movement and all the studies are based on fundamental diagrams only. These studies construct a base to characterize pedestrian flow. Several experiments have conducted to understand the pedestrian flow, likewise some field observations have done to represent fundamental diagrams. Therefore, before going to analyze the data from the observation, it is necessary to note down the pedestrian flow parameters carefully.The aim of the paper is to build up the base to fundamental diagrams and for characterization of pedestrian. And derive the required flow diagrams and results from the field observations. Field survey is conducted to know the vehicle pedestrian interaction, and this field data with respect to pedestrian crossing at signalized, unsignalized or at midblock sections is aimed to be observed. And the impact of vehicle pedestrian interaction at several intersections/ midblock sections is to be studied.
To do this, some places are chosen from Hyderabad. It is aimed to be observing whether the pedestrian fundamental diagram is different in alternate locations or not. In this study it is found that fundamental diagrams are different in different locations of Hyderabad.
Keywords: Disturbed and undisturbed pedestrian crosswalk movement, signalized unsignalized and midblock sections, fundamental diagrams, vehicle pedestrian interactions.
1. INTRODUCTION
Walking has always been the primary means of human motion. And that’s why we considered the pedestrians are the basic elements of transportation. Coming to the pedestrian crosswalks there were several cross walks like zebra crossing are designed for a road, provide gainful work to assist the pedestrians to move from one side to the other side of road, and which plays a significant role in the mobility and safety mode of un signalized intersections. In some other places like where the busy traffic takes place, pedestrian choose the mid blocks to cross the road. But there is no safety as compared to signalized and unsignalized intersections. Even many pedestrian crosswalks are taking place in these unsignalized crossing sections.
Depend on the vehicular pedestrian motion demand cross walk width is defined. Some existing manuals are published about the crosswalk width, but they do not provide clear specifications for the required crosswalk width, regarding
different pedestrian demand volumes and properties. Pedestrian flow consists of two types, unidirectional (single file motion) and bidirectional. In unidirectional flow, pedestrian motion is in one direction only, whereas in bidirectional pedestrian can walk from the both direction and interact with each other. Pedestrian road safety is one of the major aspects of transportation engineering in urban areas. The illegal crossing behavior of the pedestrian is a major fact in the road safety issue.
Traffic density is a fundamental macroscopic characteristic of traffic flow, and is used in assessing traffic performance from the point of view of users and system operators. It is also employed as the primary control variable in freeway control and surveillance systems. Traffic density(k) can be defined as the number of vehicles occupying in a unit length of roadway at a given section. Density is also an important measure of the quality of traffic flow, as it is a measure of the proximity of other vehicles, a factor which influences freedom to manoeuvre and the psychological comfort of drivers. For these reasons, the Highway Capacity Manual used the traffic density as the primary measure of level of service (LOS).
Thetechnique is to calculate density from speed and flow measurements. This calculation technique requires two detectors, count and speed or two closely spaced detectors with software to convert elapsed travel time to speed. The density can then be calculated as the division of flow by speed. One problem with this approach is that it uses the time-mean-speed at this measurement station instead of the space-mean-speed
The VIP(Video image processing) is multiple lane detection system which requires higher mounting camera position allowing for better angle and wider view of lanes on the road. In this case, the video image processing recognizes overlapped vehicles as single objects. There are also concerns regarding accuracy of VIP results when processing video images with lane changes, light variation, shadows, vibration due to wind, and/or trucks that obscure full view of vehicles.
© 2017, IRJET | Impact Factor value: 6.171 | ISO 9001:2008 Certified Journal | Page 1254 This model is more realistic than the commonly used simple
exponential model.
1.1 Objectives of the Study
The thesis here is focused on developing pedestrian motion which can describe the vehicular pedestrian interaction at the anti crossing zone and location was chosen to collect the data from Ntr Nagar, Hyderabad.
To provide the best design spaces for pedestrian motion is studied empirically.
To analyze the basic flow parameters like speed, density of pedestrian motion at microscopic level.
To develop fundamental diagrams between flow and density parameters.
To provide mobility and safety mode at signalized intersections.
To analyze the pedestrian characteristics under mixed traffic conditions.
To reduce the vehicle pedestrian interaction at signalized and un signalized sections.
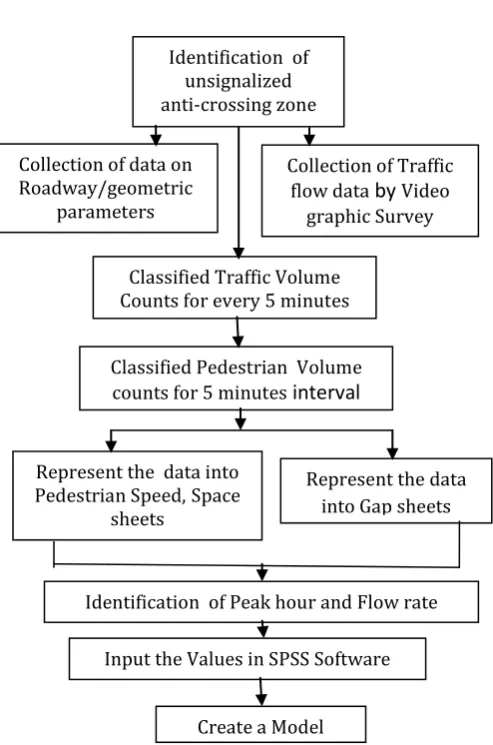
[image:2.595.28.275.362.735.2]2. METHODOLOGY
Figure 1: Flowchart showing the research methodology
2.1 Statistical Package for the Social Sciences
(
SPSS
)SPSS Modeller is a data mining and text analytics software application. It is used to build predictive models and conduct batched and non-batched statistical analysis. It has a visual interface which allows users to leverage statistical and data mining algorithms without programming.
SPSS Statistics places constraints on internal file structure, data types, data processing, and matching files, which together considerably simplify programming. SPSS datasets have a two-dimensional table structure, where the rows typically represent cases (such as individuals or households) and the columns represent measurements (such as age, sex, or household income). Only two data types are defined: numeric and text (or "string"). All data processing occurs sequentially case-by-case through the file (dataset). Files can be matched one-to-one and one-to-many, but not many-to-many. In addition to that cases-by-variables structure and processing, there is a separate Matrix session where one can process data as matrices using matrix and linear algebra operations.
here dependent variable is total time taken to cross i.e. clearance time and waiting time and independent variables are Percentage of gaps accepted, heavy vehicles, average speed, age factor etc.
m.y= a1x1+a2x2+a3x3+...+an xn
where a1,a2 are independent coefficients; m,y are
dependent variable.
x1,x2 are variables
The graphical user interface has two views which can be toggled by clicking on one of the two tabs in the bottom left of the SPSS Statistics window. The 'Data View' shows a spreadsheet view of the cases (rows) and variables (columns). Unlike spreadsheets, the data cells can only contain numbers or text, and formulas cannot be stored in these cells. The 'Variable View' displays the metadata dictionary where each row represents a variable and shows the variable name, variable label, value labels, print width, measurement type, and a variety of other characteristics. Cells in both views can be manually edited, defining the file structure and allowing data entry without using command syntax. This may be sufficient for small datasets. Larger datasets such as statistical surveys are more often created in data entry software, or entered during computer-assisted personal interviewing, by scanning and using optical recognition . These datasets are then read into SPSS. Statistical output is to proprietary file (supporting pivot tables) for which, in addition to the in-package viewer, a stand-alone reader can be downloaded. The proprietary output can be exported to text or Microsoft Word, PDF, Excel, and other formats. Alternatively, output can be captured as data (using the OMS command), as text, tab-delimited text, PDF, XLS, HTML, XML, SPSS dataset or a number of variety of graphic image formats like (JPEG, PNG, BMP and EMF).
Collection of data on Roadway/geometric
parameters
Collection of Traffic flow data
by
Videographic Survey
Classified Traffic Volume Counts for every 5 minutes
interval
Classified Pedestrian Volume counts for 5 minutes
interval
Represent the data into Pedestrian Speed,Space
sheets
Represent the data into Gap sheets
Identification of Peak hour and Flow rate
Input the Values in SPSS Software
Create a Model Identification of
unsignalized
© 2017, IRJET | Impact Factor value: 6.171 | ISO 9001:2008 Certified Journal | Page 1255 Multiple regression is an extension of simple linear
[image:3.595.44.282.166.308.2]regression. It is used when we want to predict the value of a variable based on the value of two or more other variables. The variable we want to predict is called the dependent variable (or sometimes, the outcome, target for further comparison with the disturbed pedestrian crossings
.
Figure: 3.2.2 flow diagram of undisturbed pedestrians at NTR Nagar Road
Most of the pedestrian used this section of the road and the variation is different with respective the time period. Weaving, merging and diverging was observed from left to right and right to left in the field while crossing the road section. The flow observed was equal to 628, 492 and 483ped/hr respectively.
4. ANALYSIS:
4.1 Relationship analysis for Pedestrian flow:
a) Flow Vs Density
[image:3.595.315.552.291.447.2]In a hypothetical case, when flow approaches to zero at very high speeds, the density also approaches zero. With an increase in speed, the flow increases up to a certain limit and then decreases. Thus, at the optimum values of speed and density, the flow is maximum achievable capacity flow.
Figure: 4.1.1 fundamental relationships between flow and density
The above figure shows the flow and density relationship in Ntr Nagar. When the speed of the traffic flow decreases the density attains the maximum value. Whereas flow decreases, then becomes zero.
b) speed-density relation:
The relation between speed and density is linear. And speed is the basic input for the fundamental diagram. Practically it is not possible in all cases like zero density and free speed on the road.
From the beginning, the data was taken from NTR Nagar to set the fundamental diagrams of pedestrian flow.
Linear Regression Analysis is a well-known technique for fitting a straight line between dependent and independent variables.
Y = a + bX
Similarly speed and density are related in a linear form, i.e. u = a + bk
Figure: 4.1.2 fundamental relationships between speed and density
To improve the test results number of experiments were conducted. The above graph which show the linear relationship between speed and density of pedestrian flow.
[image:3.595.60.263.564.705.2]The data were collected in the peak hour period. From the figure with increase in speed of a stream of vehicles on a roadway, the density per unit length decreases. This is because gap or spacing between vehicles is increasing with increase in speed.
c) Flow vs Speed
© 2017, IRJET | Impact Factor value: 6.171 | ISO 9001:2008 Certified Journal | Page 1256
5. RESULT
5.1 Description
In this study, data was analyzed and the result shows the fundamental relation between the density and speed-distance headway of pedestrian flow. And the differences between the disturbed and undisturbed pedestrian flow is shown by hypothesis testing. Regression analysis has been conducted to get the statistical results. Simple linear regression analysis is well known statistical technique for fitting mathematical relationship between dependent and independent variables.
From the manual count method pedestrian flow is calculated for every 5minutes. From this, it is noted down that the pedestrian flow varies from section to section and from place to place also. The size of the data collection depends on the length of the counting period, The type of count being performed, crosswalks being observed and the road conditions.
6. CONCLUSION
Pedestrian crosswalk data is recorded at particular location to get the speed and flow of that particular pedestrian stream.
Undisturbed data is useful to compare with disturbed data for determining the difference in hypothesis test.
This study intended to find the fundamental relationship between speed, flow and density by using IRC 2012 code.
Pedestrian flow rate, peak hour composition was determined by using HCM manual and IRC 2012 (Guidelines for Pedestrians)
In this study, i represented 372 data points, included all these data points in Statistical Package for Social Sciences(SPSS) software.
Linear Regression analysis is done by using these data points and a 'Model' is developed.
Linear regression analysis is done in order to predict the value of the dependent variable for individuals for concerning the explanatory/independent variable is available.
R2 is a measure of goodness of fit linear regression
and the value is 0.265 and "T ratio" value as 2.067 and the test results are significant.
Better and easy way for pedestrian crossing is implementing pedestrian safety interventions for road geometry.
Reduce pedestrian exposure to vehicular traffic Example: The interventions like providing sidewalks install and upgrade traffic and pedestrian signals, constructing the pedestrian refuge islands, raised medians, enhanced marked crossings, overpasses/underpasses and improving the mass transit route design
Reduce vehicle speed
Examples of interventions like reduce speed limit, implementing area wise lower speed limit, install speed management measures at intersections
REFERENCE
1. Chattaraj U and Chakrobroty P (2014), ‟ Comparision of Pedestrian Fundamental Diagram Across Cultures". Advances in complex systems pp. 393-405
2. C. Raj, Shetty (2014). Understanding Pedestrian Motion: Experiments and Modelling. Ph.D. Thesis. IIT Kanpur, India.
3. U Chattaraj, Chakroborty, P. and Seyfried, A. (2013). Empirical Studies on Pedestrian Motion through Corridors of Different Geometrics. In proceedings of the 89th Annual Meeting of the Transportation
Research Board, Washington, D.C, USA. Model Un
standardized Coefficients
Standar dized Coefficie nts
T Sig.
B Std.
Error Beta
Constant 30.28 1.828 0.31 16.5 Gaps
accepted 0.52 0.034 0.31 2.14 0.02 Heavy
vehicles 0.176 0.094 0.121 3.87 0.04 % of
accepted Gaps
0.017 0.152 0.06 5.10 0.05
Average speed= distance/ tim
e
-0.077 -0.035 -.114 -4.98 5
0.03
© 2017, IRJET | Impact Factor value: 6.171 | ISO 9001:2008 Certified Journal | Page 1257 4. Older, S.J. (2013). Movement of Pedestrians on
Footways in the Shopping Streets. The Traffic Engineering and Control, 10 (4), pp. 160–163.
5. Navin Faul. Partner .D. and Wheeler, R.J. (2013). Pedestrian Flow Characteristics. Traffic Engineering, 39 (9), pp. 30–36.
6. Polus, Atlander John (2009). Pedestrian Flow and Level of Service. Journal of Transportation Engineering, ASCE, 109 (1), pp. 46–56
7. Henderson, L.F. and Lyons, D.J. (2008). Sexual Differences in Human Crowd Motion. Nature, 240 (5380), pp. 353–355
8. Young, S.B. (2012). Evaluation of Pedestrian Walking Speeds inside the Airport Terminals. Transportation Research Record, Transportation Research Board, National Research Council, Washington, USA, pp. 20–26.