www. ijraset.com Volume 2 Issue X, October 2014 ISSN: 2321-9653
International Journal for Research in Applied Science & Engineering
Technology(IJRASET)
Optimization and Modelling of End Milling
Process Parameters by Using
Taguchi Method
Dimple Rani#1, Dinesh Kumar*2,
#
PG student,* Assistant Professor at Department of Mechanical Engineering,JCDM College of Engineering, Sirsa
Abstract—Surface roughness is an index which determines the quality of machined products and is influenced by the cutting parameters. The aim is prediction of surface roughness by using artificial neural systems. The neural network model can be efficiently find the best cutting parameters value for a specific cutting condition in milling operation and achieve minimum surface roughness. In machining operations, achieving desired surface quality features of the machined invention, is really a exciting job. Because, these quality structures are highly correlated and are expected to be influenced directly or indirectly by the direct effect of process parameters or their interactive effects (i.e. on process environment). However, the amounts of major influence of the process parameters are different for different reactions. Therefore, optimization of surface roughness is a multi-factor, multi-objective optimization difficulty. Thus, to solve such a multi-objective optimization problem, it is sensed necessary to classify optimal parametric combination, following which all purposes could be optimized instantaneously. In this context, it is important to convert all objective functions into an equivalent single objective function or overall representative function to meet desired multi-quality features of the machined surface. The mandatory multi-quality features may or may not be contradictory in nature. The representative single objective function, thus designed, would be optimized finally. In the present work, Design of Experimentation (DOE) with Taguchi L9 Orthogonal Array (OA) has been explored. Finally, Taguchi method has been adopted for searching optimal process condition to yield desired surface quality. In the present work an experimental investigation of the end milling of AISI D2 steel with carbide tool by varying feed, speed and depth of cut and the surface roughness was measured using Surface Roughness Tester. The neural network design and development was done using MATLAB. The training data set has been used to train ANN model for data prediction.
Keywords- Taguchi Method, Surface Roughness, Artificial Neural networks, Orthogonal Array.
I. INTRODUCTION
Milling is the process of machining smooth, curved, or uneven surfaces by feeding the work piece against a rotating cutter containing a number of cutting edges. Milling machine is one of the important machining processes. In this operation, work piece is fed against a rotating cylindrical tool. The rotating apparatus consists of many cutting edges (multipoint cutting tool). Normally axis of rotation of feed is given to work piece. Milling operation is illustrious from other machining operations on the basis of orientation between the tool axis and the feed track; however, in other processes like drilling, turning, etc. the tool is fed in direction parallel to axis of rotation.
Figure 1: End Milling Operation on AISI D2 Steel
Among different types of milling procedures, end milling is one of most vital and common metal cutting operations used for machining parts because of its capability to remove materials at faster rate with a reasonably good surface quality (see figure 1). Also, it is capable of producing a variety of configurations using milling cutter. In end milling, the cutter, called end mill, has a diameter less than the work piece width. The end mill has helical cutting edges passed over onto the cylindrical cutter surface. End mills with smooth ends are used to produce pockets, closed or end key slots, etc. In end milling an end mill makes either peripheral or slot scratches, determined by the step-over distance, across work piece in order to machine a specified feature such as a profile, slot, pocket, or even a composite surface contour. The penetration of the feature may be machined in a single pass or may be reached by machining at a smaller axial depth of cut and making multiple passes.
End milling operation produces flat upright surfaces, flat horizontal surfaces and other flat surfaces making an angle from table surface using milling cutter named as end mill. This operation is preferably carried out on vertical milling mechanism. This operation is illustrated in Figure 2.
Figure 2: End Milling Operation
The paper is well-organized as follows. In section II, we discuss correlated work with end milling process. In Section III, It defines the complete experimental work and setup. After this, it designates the main results of this system.Finally, conclusion is explained in Section V.
II. RELATED WORK
In literature, authors studied the performance of multilayer coated carbide insert in the machining of hardened AISI D2 steel (53 HRC) using Taguchi design of experimentation. The experiment was calculated based on Taguchi L27 orthogonal array to predict surface roughness. The S/N ratio and optimal parametric situation are analysed. The examination of variance had also been passed out to predict the significant factors affecting surface roughness. Based on Taguchi S/N value and ANOVA, feed was the most manipulating parameter for surface roughness followed by cutting speed whereas depth of cut has least significant from the experiments. In regression model, the value of R2 being 0.98 indicates that 98 % of the total deviations were explained by the model [5].
[image:3.612.62.551.303.469.2]improve many solutions of optimization complex problems in many applications. This paper studiedideal selection of cutting parameters in turning operation using GA and its variants. This study deals with GA procedure in different machining aspects in turning operation like surface roughness, production amount , tool lifetime, production cost, machining time and cutting temperature [7].
Authors proposed that CNC End milling is a unique adaption of the conventional milling process which uses an end mill tool for the machining process. CNC Vertical End Milling Machining is a widely accepted material removal process used to manufacture components with complicated shapes and profiles. During end milling process, material is removed by the end mill cutter. The effects of several parameters of end milling process like spindle speed, depth of cut, feed rate have been examined to reveal their Impact on surface finish using Taguchi Methodology. Experimental plan is achieved by a Standard Orthogonal Array. The results of investigation of variance (ANOVA) indicate that the feed Rate is most influencing factor for modelling surface finish [9].
III. EXPERIMENTAL WORK
Experiments are performed by investigators in almost all fields of inquiry, usually to discover something about a particular process or system.
A. Material Used
In this work hardened AISI D2 steel (hardness 50-70 HRC) will be used as the work piece material and Tungsten carbide preferably coated will be used as the tool material. The chemical arrangement of AISI D2 tool steel is given in below Table 1.
Table 1: Chemical Composition of Steel
Carbon 1.55 %
Silicon 0.30 %
Manganese 0.35 %
Chromium 12 %
Molybdenum 0.75 %
Vanadium 0.90
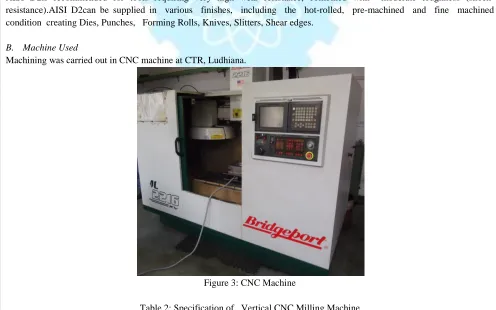
AISI D2is recommended for tools requiring very high wear resistance, combined with moderate toughness (shock-resistance).AISI D2can be supplied in various finishes, including the hot-rolled, pre-machined and fine machined condition creating Dies, Punches, Forming Rolls, Knives, Slitters, Shear edges.
B. Machine Used
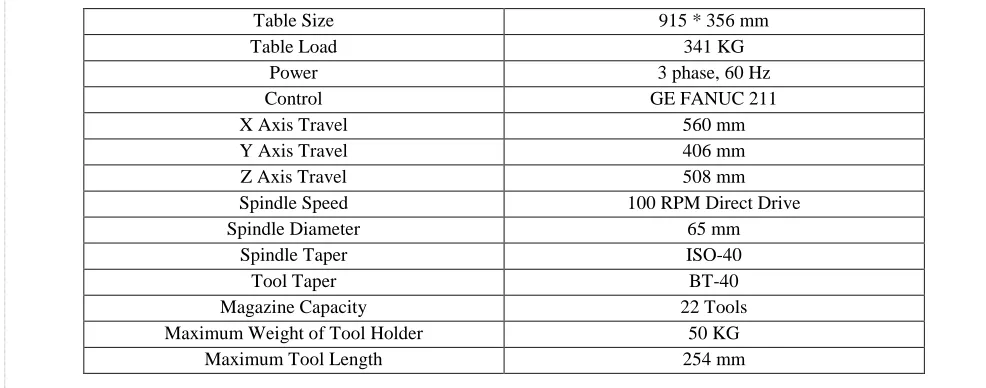
[image:4.612.56.552.405.715.2]Machining was carried out in CNC machine at CTR, Ludhiana.
Figure 3: CNC Machine
Table Size 915 * 356 mm
Table Load 341 KG
Power 3 phase, 60 Hz
Control GE FANUC 211
X Axis Travel 560 mm
Y Axis Travel 406 mm
Z Axis Travel 508 mm
Spindle Speed 100 RPM Direct Drive
Spindle Diameter 65 mm
Spindle Taper ISO-40
Tool Taper BT-40
Magazine Capacity 22 Tools
Maximum Weight of Tool Holder 50 KG
Maximum Tool Length 254 mm
C. Proposed Steps
Use D2 steel as work piece.
Experiments were conducted according to L9 orthogonal array
Independently controllable cutting parameters were (1) cutting speed, (2) feed rate, and (3) depth of cut.
Apply machining operations with the help of CNC machine.
Calculate roughness parameters by machining operations.
Average surface roughness (Ra) of the turned surface was measured using a surface roughness measuring tester.
Apply taguchi technique for optimization and calculating mean and S/N ratio of parameters using MINITAB.
D. Experimental Procedures
Checking and preparing the Centre Lathe ready for performing the machining operation.
Firstly, the work-piece was cut according to above mentioned dimension i.e. 100*100*25 mm by cutter.
For developing models on the basis of experimental data three main machining parameters are considered to predict surface roughness of D2 material using carbide tool. Among the range of spindle speediness, feed, and depth of cut accessible possible in the machine the following three levels are considered as shown in Table 3.
The machining was carried out on end milling machine, the material work piece is clamped on vice mounted on the table of the machine. The machining procedure and work tool motion of end milling process respectively.
The machining is carried out by selecting proper spindle speed and feed rate during each experimentation. Experiment was carried out by varying the depth of cut.
Table 3: Levels of Input Control Parameters
Factors Levels Factor Level
values
Speed (RPM) 3 796,995,1194
Depth of Cut (mm)
3 0.75,0.50,0.25
Feed (mm/min.) 3 500,800,1100
[image:5.612.54.547.39.233.2]Sample No. Spindle Speed (rpm) Feed Rate (mm/min) Drilling Depth (mm)
1 1 1 1
2 1 2 2
3 1 3 3
4 2 1 2
5 2 2 3
6 2 3 1
7 3 1 3
8 3 2 1
9 3 3 2
Taguchi's designs aimed to allow greater understanding of variation than did many of the traditional designs. Taguchi contended that conventional sampling is inadequate here as there is no way of obtaining a random sample of future conditions. Taguchi projected extending experimentation with an "outer array" or orthogonal array should simulate the random atmosphere. Here we use L9 orthogonal array with 3 stages. In this work, L9Orthogonal Array design matrix is used to set the
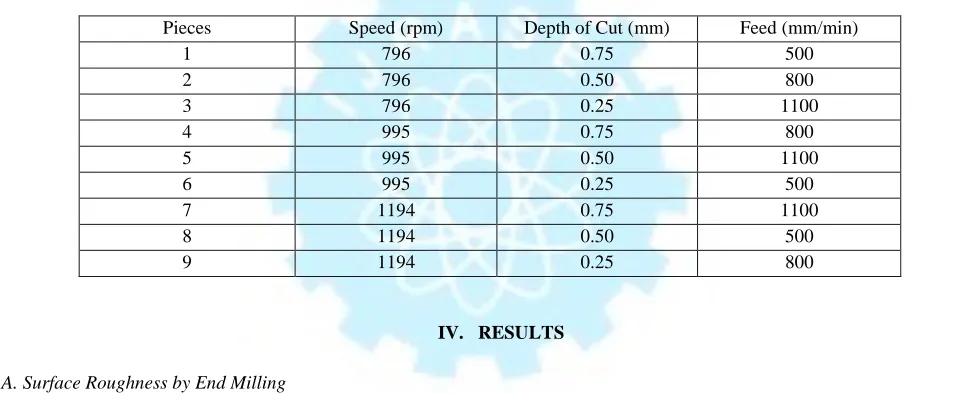
[image:6.612.62.533.42.174.2]control parameters to evaluate the process performance. Taguchi orthogonal array is designed with three levels of turning parameters with the help of software Minitab. Orthogonal Array design of experiment has been found suitable in the present work. It considers three process parameters (without interaction) to be varied in three discrete levels. The experimental design has been shown in Table 5.
Table 5: Process Parameter Design
Pieces Speed (rpm) Depth of Cut (mm) Feed (mm/min)
1 796 0.75 500
2 796 0.50 800
3 796 0.25 1100
4 995 0.75 800
5 995 0.50 1100
6 995 0.25 500
7 1194 0.75 1100
8 1194 0.50 500
9 1194 0.25 800
IV. RESULTS
A. Surface Roughness by End Milling
End milling is one of the most fundamental and commonly encountered chip removal operations occurring in a real manufacturing environment. In this machining process, the surface finish is a key factor in evaluating and determining excellence of a part. In practice, a chosen surface roughness value is usually designated, and suitable cutting parameters are selected to achieve the desired quality of a specified part.
There are various surface roughness amplitude parameters such as roughness average (Ra), Rt, root-mean-square (rms)
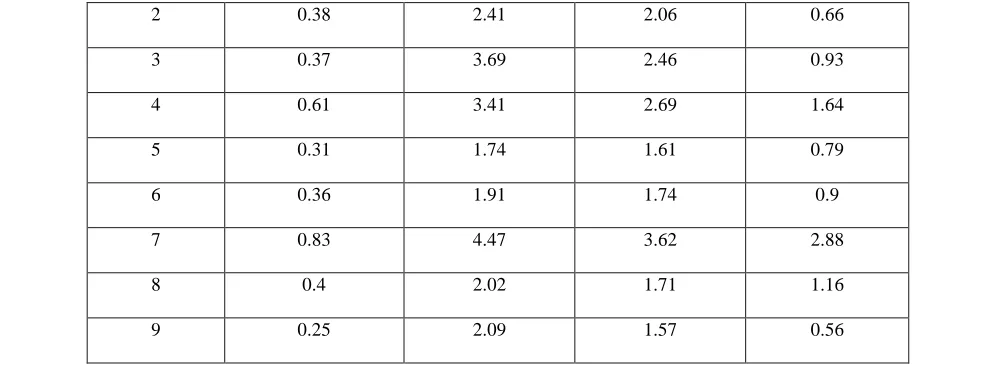
roughness Rqetc. which are used in industries as shown in Table 6. Surface roughness average parameter (Ra) is the most
extended index of product quality and has been used in this study. The average roughness (Ra) can be defined as the area between the roughness profile and its mean line or integral of absolute value of the roughness profile height over the evaluation length.
Table 6: Measured Roughness Parameters
Pieces Ra (µm) Rt(µm) Rz(µm) Rc(µm)
[image:6.612.61.549.303.500.2]2 0.38 2.41 2.06 0.66
3 0.37 3.69 2.46 0.93
4 0.61 3.41 2.69 1.64
5 0.31 1.74 1.61 0.79
6 0.36 1.91 1.74 0.9
7 0.83 4.47 3.62 2.88
8 0.4 2.02 1.71 1.16
9 0.25 2.09 1.57 0.56
[image:7.612.57.548.42.227.2]The main objective of the paper is to optimize the milling parameters (spindle speed, feed rate, depth of cut and cutting tool grade) to achieve low value of the surface roughness. The experimental data for the surface roughness values is shown in table 7.
Table 7: Measured Surface Roughness
Pieces Speed (rpm) Depth of Cut (mm) Feed (mm/min) Surface
Roughness
1 796 0.75 500 0.18
2 796 0.50 800 0.38
3 796 0.25 1100 0.37
4 995 0.75 800 0.61
5 995 0.50 1100 0.31
6 995 0.25 500 0.36
7 1194 0.75 1100 0.83
8 1194 0.50 500 0.4
9 1194 0.25 800 0.25
B. Optimization by Taguchi Method
[image:7.612.60.552.284.459.2]Performance characteristics are first converted into the S/N ratio using the Taguchi method. Using S/N quantity, optimal performance and minimal variance can be designed. A longer tool life generally implies a higher metal removal rate and better cutting performance. Therefore, the wear rate should be at a minimum and the metal removal rate should be at a maximum. Table 8 lists the S/N ratio and means value. The S/N ratio can be used for performance analysis. Moreover, a higher S/N ratio should improve the performance characteristics. The result of S/N ratio analysis for the surface roughness values, which was calculated using taguchi process, is shown in Table 8.
Table 8: Measured SNR & Means by Taguchi Optimization
Pieces Speed (m/rev.) Depth of Cut (mm) Feed (mm/min) Surface Roughness SNR Means
1 796 0.75 500 0.18 14.89 0.18
2 796 0.50 800 0.38 8.40 0.38
5 995 0.50 1100 0.31 10.172 0.31
6 995 0.25 500 0.36 8.873 0.36
7 1194 0.75 1100 0.83 1.618 0.83
8 1194 0.50 500 0.4 7.958 0.4
9 1194 0.25 800 0.25 12.041 0.25
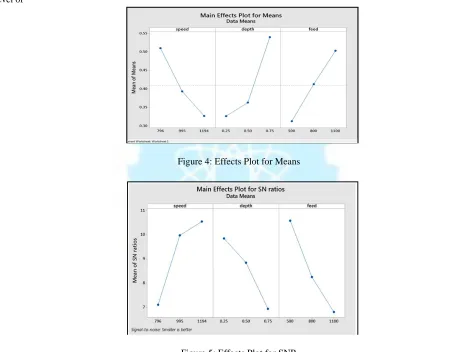
[image:8.612.103.449.42.158.2]Figure 4 & 5 shows graphs, each of which contains a curve representing the mean and a curve representing S/N ratio. The S/N ratio indicates degree of predictable performance of a product or process in the presence of noise factors. Process parameter settings with maximum S/N ratio always yield the optimum quality with parameter on surface roughness are shown in Fig 4 & 5minimum variance. The level that has a higher value determines the optimum level of each factor. The main effects for each level of
Figure 4: Effects Plot for Means
Figure 5: Effects Plot for SNR
The Taguchi method is a simple and effective solution for parameter design and experimental planning [15].In this method, signal-to-noise (S/N) ratio is used to signify a performance characteristic in which the largest value of the S/N ratio is required. The three S/N ratios are the lower-the-better, higher-the better, and the nominal-the-better.
V. CONCLUSION
[image:8.612.67.528.224.576.2] [image:8.612.188.428.232.563.2]demonstrates how to use Taguchi parameter design for optimizing machining performance with minimum cost.This approach can be recommended for continuous quality improvement and off-line quality of any production process. As speed increases surface roughness decreases and feed increases surface roughness also increases. For achieving good surface finish on the D2 work piece, higher cutting speed, lower feed and lower depth of cut are preferred.
REFFERENCES
[1] A.K Sahoo, “Application of Taguchi and regression analysis on surface roughness in machining hardened AISI D2 steel”, International Journal of Industrial Engineering Computations 5 (2014)
[2] K.D Theja, Dr. G.H Gowd, S. Kareemulla, “Prediction & Optimization of End Milling Process Parameters Using Artificial Neural Networks”, Volume 3,
Issue 9, September 2013
[3] A.Jameel, M. Minhat , Md. Nizam, “Using Genetic Algorithm to Optimize Machining Parameters in Turning Operation: A review”, Volume 3, Issue 5,
May 2013
[4] A.Joshi&P.Kothiyal, “Investigating Effect of Machining Parameters of CNC Milling on Surface Finish by Taguchi Method”, Volume-2, Issue-2, 2013 [5] P. Maurya, Dr. P. Sharma, B. Diwaker, “Implementation of Taguchi methodology to Optimization of CNC end milling process parameters of AL6351 –
T6”, Vol. 2, Issue. 5, Sep.-Oct. 2012
[6] R. Rao. S, Padmanabhan. G, “Application of Taguchi methods and ANOVA in optimization of process parameters for metal removal rate in
electrochemical machining of Al/5%SiC composites”, Vol. 2, Issue 3, May-Jun 2012
[7] Md. S.J Hossain and Dr.N.Ahmad, “Artificial Intelligence Based Surface Roughness Prediction Modeling for Three Dimensional End Milling”, Vol. 45, August, 2012
[8] Mahesh. G., Muthu. S. Devadasan. S. R., “A Review of Optimization Techniques, Effect of Process Parameter with Reference to Vibration in End Milling
Processes”, EuroJournals Publishing, Inc. 2012
[9] V V K Lakshmi, Dr K.V Subbaiah,“Modelling and Optimization of Process Parameters during End Milling of Hardened Steel”, Vol. 2, Issue 2,Mar-Apr 2012
[10] A.Behera, S.Behera, R.K Tripathy, S.C Mishra, “Least Square Support Vector Machine Alternative To Artificial Neural Network For Prediction Of
Surface Roughness And Porosity Of Plasma Sprayed Copper Substrates”, December, 2012
[11] T. Thepsonthi& T. Özel, “Multi-objective process optimization for micro-end milling of Ti-6Al-4V titanium alloy”, February 2012
[12] M. Bozdemir& Ş. Aykut, “Optimization of surface roughness in end milling Castamide”, Int J AdvManufTechnol (2012)
[13] R.A Mahdavinejad, N. Khani and M.M.S Fakhrabadi, “Optimization of milling parameters using artificial neural network and artificial immune system”, Journal of Mechanical Science and Technology 26 (12) (2012)