Journal of Chemical and Pharmaceutical Research, 2014, 6(9): 488-493
Research Article
CODEN(USA) : JCPRC5
ISSN : 0975-7384
Clustering analysis of cancerous microarray data
Khalid Raza
Department of Computer Science, Jamia Millia Islamia (Central University), New Delhi, India
_____________________________________________________________________________________________
ABSTRACT
Due to rapid advancement in microarray technology it is possible to measure expression of tens of thousands of genes simultaneously and as a result we have flood of data that need to be analyzed for the discovery of fruitful knowledge. Clustering is a well-known unsupervised learning approach that clubs a set of similar objects in groups that forms clusters. Cancerous microarray data may reveal fruitful information related to underlying mechanisms of cancer at molecular level which can be used for better diagnosis and therapies of cancers. In this paper, we applied four different clustering techniques, such as k-means, hierarchical, density-based and expectation maximization approaches, on five different kinds of cancerous gene expression data (lung, breast, colon, prostate, breast and ovarian cancer) for their analysis.
Key words: Clustering analysis, Microarray, Gene expression, Cancer classification
_____________________________________________________________________________________________
INTRODUCTION
Cancer is a leading cause of death worldwide. The GLOBOCAN 2012 report [1] shows that 14.1 milion new cancer cases occurred, 8.2 million cancer death and 32.6 million people still living with cancer in 2012 worldwide. The data till 2012 are: lung cancer 1.8 million, breast cancer 1.67 million, colorectal cancer 1.4 million and prospate cancer 1.1 million, etc. The detail statistics cancer-wise and country-wise can be seen in GLOBOCAN 2012 report [1]. Formation of tumor and their progression is very complex multistep process consists of many consecutive events such as accumulation of genomic alterations, uncontrolled proliferation, angiogenesis, invasion and metastasis. The causes of cancer are diverse, complex, and only partially understood. The sources of cancerogenesis are environmental factors and genomic DNA aberrations. The risk of disease increases with age [2].
Microarray is a high throughput technique which allow to observe expression of tens of thousand of genes at the same time. This technique is based on the principle of hybridization of known array and genes. The results which we get from the microarray experiment is the expression level of genes. The spots contain thousands of short identical DNA or short stretch of oligonucleotide strands which uniquely represents specific genes [3]. The biggest problem from microarray results is that the processing time of data to take out meaningful results is much higher than to get expression results. To come out from this problem scientists took out many methods to process the expression data in a meaningful manner for further research.
REVIEW OF RELATED WORKS
Clustering is a unsupervised learning technique which classify objects in groups with respect to their similar characteristics. Cluster analysis is traditionally used in phylogenetic research and has been adopted to microarray analysis as well. Traditionally there are various clustering algorithm like k-means, hierarchical, SOM etc. The values of gene expression from microarray experiment is represent in numeric form in a matrix. The ultimate goal of clustering is to find clusters of genes such that observations within a cluster are more similar than observations in different clusters. Cluster analysis may be used as data reduction method in which observations can be represented by mean of the observations in particular cluster [4].
There is a provision of evaluation of distance between two expressed genes so that we get to know whether genes are interrelated or not and placed in same cluster. Commonly used distance measures are Euclidean distance, Manhattan distance and Pearson correlation distance. Euclidean distance consider both the distance and magnitude between two points. In manhattan, the distance is measured parallel along with x and y axis. Pearson correlation distance find whether the two gene expressions are interrelated or not. If expressions increases or decreases with respect to each other on the same time then, the correlation would be high.
K-mean clustering is most simplest and widely used method. It initially takes number of clusters as its input from the user and try to locate that number of centroid for their clusters. Then each point move to their nearest centroid to belongs to that cluster. This process is repeated till no single point move from their relevant cluster to other. As this whole process is very simple but it have their own drawback. The result of this method changes after every iteration and this will affect the quality of the cluster. To know about the quality of the cluster user calculate the average distances between the clusters. Shorter average distances is better than longer one and shows better uniformity. For the verification of quality of the cluster, one can repeat the clustering process and if we get same kind of pattern in the cluster then it means that the specific cluster is trustworthy. For complicated data and to get inter-cluster relationship we prefer to do hierarchical clustering. In this type of clustering we consider all data points as a single cluster and each cluster have only one item in itself. Now the algorithm try to find out the distance between closest similar cluster to a specific choosen cluster and club them to make a single cluster which leads to one less cluster and repeat this step until we get a single cluster in the end. The result will be seen in the form of dendogram in which we can see the inter-relationship between clusters. The distance calculation can be done in various form of linkages i.e. single linkage, average linkage and complete linkage. Average and complete linkage gives better results than single linkage.
Self Organization Map (SOM) is also an another clustering technique which same function as k-means and hierarchal. It also cluster the gene expression on the basis of similarity but in addition it also depict the relationship between the gene expressions in its result plots [5]. It is basically based upon destructive neural networks which is divided into grids and these grids are composed of elements. The computational method connect the grids with each other and reduce the number of connections to predict better classes.
Several earlier attemp has been made to cluster gene expression data for better analysis and knowledge discovery. Hierarchical clustering has been applied on microarray immunostaining data that groups breast cancer into classes with clinical relevance [6]. SOM were applied in cancer class discovery and marker gene identification and appropriate number of clusters has been discovered that helps in marker gene identification [7]. The algoritm was applied on leukemia dataset that contains three leukemia type and result shows SOM was able to identify three major and one minor cluster. Few new clustering algorithm ha been bee proposed and applied for gene expression clustering. In [8], diffraction-based clusering has been applied and shwon to be independent of number of clusters, as algorithm hunts he feature space. In [18], SOM has been applied to analyze supercoiled time-series gene expression data of e. colibacterium by reconstructing gene regulatory networks.Review on analysis of cancer microarray data can be found in [9][10].
EXPERIMENTAL SECTION
3.1 Data Sources
We are considering five different types of cancer data in this paper, i.e. lung cancer, prostate cancer, colon cancer, breast cancer and ovarian cancer. The following cancers datasets are taken from published papers [11, 12, 13, 14, 15].
3.2 Data Normalization and Attribute Reduction
trainer than trainee, then trainee would be trained better. Therefore before training machine learning we have done attribute reduction using t-test and quartile range. The methodologies used in this study are discussed as follows. We applied quartile range statistical techniques for normalization of data. The values before normalization was far scattered but after normalization it converged.
3.2.1 Quartile Range: Quartiles are those values which divides a list of numbers into four equal parts, called
quartiles. For a list of number such as 2, 3, 3, 4, 7, 8 and 9 we have 4 as its mid-quartile (Q2), 3 as first-quartile (Q1) and 8 as third-quartile (Q3). Quartile range is the range between Q3 and Q1 and can be calculated as the different between Q3 and Q1, i.e. (Q3 – Q1).
3.2.2 t-test: t-test is statistical hypothesis test where test statistic follows a student’s t distribution if the null
hypothesisis supported. It can be used to determine if two sets of data are significantly different from each other. The t-test statistics has been widely used to filter differentially expressed genes and/or attribute reduction. The t-test helps us to identify those set of genes expressing differently over two set of samples. As most machine learning techniques suffers from the curse of dimensionality problem (large number of attributes and very less number of samples), so attribute reduction is required before training a machine learning technique.
3.3 CLUSTERING ALGORITHMS
In this paper, we applied five different clustering algorithms with Euclidean distance as proximity measure. These clustering algorithms are discussed as follows:
3.3.1 k-Means:This is one of simplest and most widely used clustering algorithm where number of clusters are
known. It is basically based on the assignment of centroid for each cluster. So, for this it take out random points within the dataset and assign them as centroid and then try to localize and assign the other data points to the nearest centroid. The steps of k-means clustering are :
Step1: Random assignment of K centroid from the data points. Step 2: Place the other data points to the nearest centroid point. Step 3: Now recalculate the centroid point for new centroid allotment. Step 4: Repeat step 2 and step 3 until no data point move to any other cluster.
Given a set of gene expression samples (S1, S2, …,Sn) where each sample contains a m-dimensional real vector of gene expression, the k-means clustering would partition the n samples into k clusters (k≤n) C={c1, c2, …,ck) so that within-cluster sum of squares J can be minimized, as
J = −
∈
(1)
where, µi is the mean of points in ci.
3.3.2 Hierarchical Clustering: In this method genes are connected to each other iteratively based on their similarity
pattern. It builds agglomerative or breaks up (divisive), a hierarchy of clusters. The traditional representation of this type of clustering in the form of dandogram tree which contain each element individually at one end and every individual is connected to each other with the help of branches of tree to form a single cluster at another end. Agglomerative algorithm begin at the top of the tree whereas divisive algorithms begin at the bottom. Steps of Hierarchical clustering are [16]:
Step1: Assigning each data point as a cluster, so that each cluster have only one item in it.
Step 2: Find closest similar pair of clusters and merge them into a single cluster, so that we have one less cluster. Step 3: Compute distance between new cluster and the previous old cluster.
Step 4: Repeat 2 and 3 step until all cluster assign into one single cluster and the end.
The computation of distance between data points can be done in various way in hierarchical clustering. It is based on linkage clustering.
Single linkage: In this method the distance between two cluster is determined by the distance of the two closest
Complete linkage: The distance considered in this distance measure is the longest distance between the farest
member of two different clusters. Complete linkage usually performs quite in cases when the objects actually from naturally distinct data cloudsin multidimensional space.
Average linkage: In this, the distance between two clusters is defined as the average of distances between all pairs of
objects, where each pair is made up of one object from each group. At each stage of hierarchical clustering, the clusters for which the distance is minimum are merged.
3.3.3 Density-based approach:The density-based clustering approach finds clusters using density of data points in
a region. The basic idea of this approach is that for every instance of a cluster, the neighborhood of a given radius has to contain at least a minimum number of instances. The DBSCAN (Density-based spatial clustering of applications with noise) is most popularly used density-based clustering algorithm. The DBSCAN algorithm separates data points into three classes, i) core points, which are at the interior of a cluster, ii) border points, which is not a core point but it falls within the neighborhood of a core point and iii) noise points, which is neigher a core point nor a border point.
To identify a cluster, DBSCAN begins with an arbitrary instance (p) in given dataset (D) and retrieves all instances of D with respect to neighborhood of given radius and minimum number of instances.
3.3.4 Expectation maximization approach:An Expectation Maximization (EM) is an iterative algorithm that finds
maximum likelihood (or maximum a postoriori estimate) about various parameters. The EM works in two steps, Expectation step (Step) and Maximization step (M-step), and iteratively alternates between two steps. In the E-step, it calculates the expectation of the loglikelihood evaluated by applying current estimate for the parameters. In the M-step, it calculates parameters maximiing the expected loglikelihod determined by E-step. These estimates of the paraemters are then applied to compute the distribution of the latest variables in the next E-step [17].
RESULTS AND DISCUSSION
The experiment is performed on five different cancers (lung, colon, breast,prostate and ovarian) which have higher impact on human population now-a-days. Different datasets have varying number of genes and their expression values. Some have higher sample number and some have lower.
The expression data of multiple genes are huge and it also contain expression of non-essential genes. Data preprocessing through data normalization is one of the step in which we try to adjust all the values of gene expression of those genes which are not differentially expressed have similar values across the data. This is because, while doing the microarray experiment there may be imbalance in intensity of gene expression due to technical issues like amount of sample, voltage of photodetector, dye amount etc.
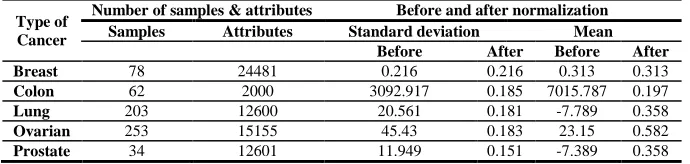
[image:4.595.135.480.586.668.2]Here we are present a table (Table 1) of standard deviation and mean values of all different dataset before and after normalization step with the help of WEKA softwrae tool which we have used in this paper. In our datasets we have large number of attributes rather than their samples. So, after normalizing data we used a two tailed t-test for extracting differentially expressed genes among two types of sample, i.e., normal and tumor, at a significance level of 0.001.
Table 1. Showing number of samples, number of attributes, standard deviation and mean before and after normalization of dataset
Type of Cancer
Number of samples & attributes Before and after normalization Samples Attributes Standard deviation Mean
Before After Before After Breast 78 24481 0.216 0.216 0.313 0.313
Colon 62 2000 3092.917 0.185 7015.787 0.197
Lung 203 12600 20.561 0.181 -7.789 0.358
Ovarian 253 15155 45.43 0.183 23.15 0.582
Prostate 34 12601 11.949 0.151 -7.389 0.358
Table 2.Percentage of instances which is concerned to specific cluster according to respective algorithm
Type of cancer k-means HC Densitybased EM
0 1 0 1 0 1 0 1
Breast 58% 42% 99% 1% 28% 72% 100% 0%
Colon 71% 29% 98% 2% 69% 31% 69% 31%
Lung 33% 67% 100% 0% 34% 66% - -
Ovarian 71% 29% 98% 2% 69% 31% 69% 31%
Prostate 99% 1% 97% 3% 50% 50% 100% 0%
(a) Breast Cancer (b) Colon Cancer
(c) Lung Cancer (d) Ovarian Cancer
(e) Prostate Cancer
CONCLUSION
Clustering is an unsupervised learing techniques that plays a vital role in providing a “class label” to unlablled data. Cancerious microarray data measured over different observed samples may reveal several information related to underlying mechanisms of cancer at molecular level. Here, we clustered five different kind of cancer datasets into different clusters with the help of four popularly used clustering algorithms. As per our analysis there is no such common learning algorithm which can give the best results in all different types of cancer datasets which we are using. Every method predicts cluster on their own calculating equation. Selection of a particular clustering approach depends on the user that what kind of cluster they require to use for the dataset under study.
Acknowledgements
The author acknowledges the funding received from University Grants Commission, Govt. of India through research grant 42-1019/2013(SR).
REFERENCES
[1] GLOBOCAN 2012,International Agency for Research on Cancer, World Health Organization. http://globocan.iarc.fr/
[2] C Federica; et.al.,Int J Mol Sci.,2013, 14(8), 17085–17110.
[3] MM Babu. An introduction to microarray analysis,Computational Genomics (Ed: R. Grant), Horizon Press, U.K, 2013, 225-249.
[4] M Eisen;P Spellman; P Brown;et al.,Proc. Natl. Acad. Sci., 1998, 95, 14863-14868.
[5] A. Ultsch,Proc. of the 6th International Workshop on Self-Organizing Maps (WSOM 2007), 2007, 1-7.
[6] NA Makretsov;DG Huntsman; TO Nielsen;E Yorida; M Peacock;MC Cheang;SE Dunn;M Hayes;M Rijn;C Bajdik;CB Gilks,Clin Cancer Res.,2004,10(18), 6143-6151.
[7] AL Hsu;SL Tang; etal.,Bioinformatics,2003, 19(16), 2131-2140.
[8] SC Dinger;MA Van Wyk; S Carmona; DM Rubin, BioMedical Engineering OnLine,2012, 11(1), 85. [9] J Fan; Y Ren, Clinical Cancer Research,2006, 12(15), 4469-4473.
[10] DS Mc; I Costa; A De;et al.,BMC Bioinformatics,2008, 27(9), 497.
[11] K Raza; R Parveen,Proc. of Confluence 2013: The Next Generation Information Technology Summit (4th
International Conference), 2013, 461-466.
[12] Y Kobyashi; etal., Genomics Res, 2011, 21(7), 1017-1027.
[13] Y Wang;JgKlijn; Y Zhang; et al.,Lancet,2005,365(9460), 671–679.
[14] W Du; Y Sun; Y Wang; etal.,Int. J. Data Mining and Bioinformatics,2013, 7(1), 58-77. [15] K Raza;AN Hasan,arXiv preprint, 2013, arXiv:1307.7050.
[16] SC Johnson, Psychometrika,1967, 2, 241-254
[17] G Celeux; G Govaert, Computational Statistics and Data Analysis,1992, 14, 315–332.
[18] H Hasan; K Raza,International Journal of Computer Sciences, World Academy of Science, Engineering &