2017 2nd International Conference on Computer, Mechatronics and Electronic Engineering (CMEE 2017) ISBN: 978-1-60595-532-2
Evaluation of Aircrafts’ Usage Quality Based on Multi-index Analysis
Xi-long HAN
*and Chen-guang HOU
AVIC China Aero-polytechnology Establishment, Beijing, China
*Corresponding author
Keywords: Aircrafts’ usage quality, Multi-index analysis, Time series prediction, Analytic hierarchy process.
Abstract. Multi-index comprehensive analysis and evaluation method has been widely used in social economy, national strength, military force and other aspects, and has also been widely applied in the field of equipment quality evaluation. Establishing the evaluation index system can help competent departments and factories grasp the equipment quality status in time. In order to analyse and evaluate the aircrafts’ usage process, this paper researched the establishment of dynamic index system of equipment use quality and the key technologies of multi-index comprehensive analysis and evaluation. This paper introduces the trend analysis and forecast of single indicator using time series method, uses Analytic Hierarchy Process method to realize the comprehensive evaluation of multi-index quality, and gives the application of various methods at the same time.
Introduction
Quality of aircraft use process can reflect the quality of equipment in real conditions, it is the most concerned element in the maintenance phase of the aircraft. The quality index data is generally collected monthly to form a set of equal interval time series. An index system is needed in order to conduct analytical evaluation and forecast of equipment quality in the use process. For example, the equipment reliability, maintainability, supportability (RMS) indicators [1]. At present, there are several commonly used methods of multi-index analysis and evaluation. First, the traditional evaluation method, which has some operational research and mathematical foundations, such as analytic hierarchy process [2], expert scoring, evaluation, fuzzy comprehensive evaluation, data envelopment analysis, etc. Second, the new evaluation method, which is based on the grey system and machine learning. Third, the hybrid evaluation and analysis method, which comprehensively utilizes different technologies or improves the traditional evaluation methods by using new methods, such as fuzzy analytic hierarchy process, fuzzy neural network evaluation and so on.
There have been a lot of researches on the problem of multi-index analysis and evaluation. Liu Peng etc. researched the equipment maintenance support capability evaluation method based on AHP and fuzzy comprehensive evaluation[3], Zhang Suping used service assurance indicators and quality indicators to establish quality house for maintenance support evaluation[4], Zhao Qingbin set up a hierarchical model for the quality of aircraft use process, and evaluated the quality of different aircrafts[5]. In this paper, a comprehensive evaluation of equipment quality is taken as the goal, and a dynamic evaluation index system of equipment use quality is established, time series analysis is used to analyze and forecast the trend of single indicators, and the level analysis model is used to evaluate and sort the service quality levels.
Construction of Dynamic Evaluation Index System for Aircrafts’ Usage Quality
the first three indicators refers to the decomposition of RMS indicators by the design department[6], reflecting the assessment requirements of the aircraft quality and RMS level, and the index for service assurance are mainly for assessing the technical service capability of the contractor.
Users can select the appropriate subset from the basic indicators, namely the index system, according to different analysis and evaluation of the problem. In the basic index set, the index can be extended to meet the needs of the forecast of index trend and the comprehensive evaluation of quality. The following table is the basic index set.
Table 1. The basic index set.
First level
index Secondary index application
Service point
Aircraft Type
Airborne system
Airborne equipment
reliability Average fault interval in flight time
Average serious fault interval in flight time
maintainabi lity
Average repair time
Direct maintenance hours per flight hour
supportabili ty
Aircraft intact rate
Dispatch shelf rate
service guarantee
Troubleshooting task completion rate
Average troubleshooting time
Spare part satisfaction rate
Average spare parts supply time
customer satisfaction
Trend Analysis and Forecast of Single Index Based on Time Series
Time series forecasting predictes the future trend of the process based on historical data is by using models. For instance, in [7] the monthly failure rate of the aircraft was regarded as a random time series, which is predicted based on the autoregressive moving average model to verify the feasibility of the time series analysis method in solving the aircraft reliability index forecasting problem. The quality of use data is greatly affected by seasons and belongs to the non-stationary time series. Currently, the combined forecasting can better solve the prediction problems of such data. For example, in predicting the water quality with many kinds of chemical indicators, it is revealed that the final result produced by the hybird model (the gray theory and the neural network) is better than that produced by one of the models alone [8]. Wang Tongsan and Zhang Tao demonstrated the superiority of combined prediction. In summary, combined prediction can integrate the advantages of multiple models and effectively reduce the impact of random effects on the use of individual model.
Time Series Trend Decomposition
Time series decomposition separates data with different influencing factors from timing, and chooses the most suitable method to predict respectively. In this paper, we use the Seasonal and Trend Decomposition using Loess (STL) to achieve the decomposition of the time series, and obtain the long-term trend of low frequency, the seasonal variation of high frequency and the residual term. The long-term trend and seasonal cycle after the decomposition are more regularity. Seasonal variations have complex nonlinear structure. Therefore, we choose BP neural network and Sequential Minimal Optimization regression (SMOreg) to predict the seasonal variation. The long-term trend data are predicted by the gray prediction GM (1,1) model.
Long-term Trend Gray Forecast
medium and long-term prediction. In order to evaluate the prediction accuracy of the indicator GM (1,1) model, according to the trend after decomposition, the samples of different length intervals were intercepted, and half-year and one-year forecasts were made to test the model's posterior difference ratio C and small error frequency P, and to choose the best sample length.
Seasonal Fluctuation BP Neural Network and SVM Prediction
BP neural network model can achieve a highly nonlinear mapping between input and output, which is approximated to any continuous function through training. SVM regression transforms the prediction problem into a linear regression problem in a high-dimensional space (Hilbert space), predicts the seasonal variation item, and compensates for the shortcoming of BP neural network (being easy to learn) to a certain extent. The original seasonal variation entry contains two attributes: the date and the numeric value, the index seasonal variation data was set at the monthly intervals, and the number of lagged variables was set as 12. Set the current output be Out and the lag variables Lag -1, Lag -2 … Lag-12, that is, the value of the past 12 months was taken as the input variable starting from the time node of the current output value. The meaning of Lag -1 is: Create a lagged variable, and use the value of time -1 as input. Date Derived variables include month, quarter, month number in the sample, and the date attribute used to represent the output value. At the same time, the product of the month number and the lagged variable was included in the input variables to enhance the impact of the recent lagged variables on the network weights. The figure below shows the BP network model of the seasonal variables. Hidden nodes are determined based on empirical formula [10], which is:
(
[1,10])
m n
j= + +α α∈ (1) For example, if the number n of input nodes is 27, the output node m is 1, and α is taken as 4, then
the number of hidden nodes j is 10. SVM regression supports that vector machine regression model also need to learn the sample data to find the functional relationship between the two. Suppose the predicted output value is Out and the input value of the influencing factor is input, so we can use the mapping relationship of variables created in BP neural network model to train SVM.
…… …… …… …… Lag Lag Lag Lag----2222 Month number Month numberMonth number Month number****LagLagLagLag----1111
Month number Month numberMonth number Month number****LagLagLagLag----1111
Lag Lag Lag Lag----1111 quarter quarter quarter quarter month month month month Month number Month numberMonth number Month number
…… ………… ……
input hidden layer output layer
Out … … … … … … … …
Figure 1. BP network model of the seasonal variables.
The test samples are taken at the end of the training data, and the learning models are respectively input to calculate the prediction errors so as to quantitatively evaluate the prediction effects of the two models. The average absolute error can be used as a measure, the smaller the error is, the better the training effect is. The average absolute error of the prediction is e1 and e2 respectively, the combined prediction result is Y, the prediction values of the first two models are Y1 and Y2, and the weights are
w1 and w2, w1 = e2 / (e1 + e2), and w2 = e1 / (e1 + e2), thus, Y=w1∗Y1+w2∗Y2.
Single Indicator Trend Analysis and Forecasting Examples
After decomposition of STL trend items, the trend value of the next 12 months are calculated based on the gray forecasting indicators. It is necessary to create and normalize the lag variables and derived variables before neural network training. Six test samples were intercepted, and the average absolute error of the two models was calculated. The combined weights of the two methods were obtained. After the calculation, the prediction weight of BP neural network was 0.6 and the prediction weight of support vector machine was 0.4. Combination Prediction = Gray Prediction + 0.4 * Vector Machine Prediction + 0.6 * BP Prediction. In order to compare with a single prediction model, using the same historical data to perform SVM regression prediction. It turns out that the average absolute error of combined prediction and SVM regression alone was 21% and 45% respectively, in which the former is better.
Figure 2. Forecast of single index based on time series.
Multi-index Evaluation of Aircrafts’ Usage Quality Based on AHP Model
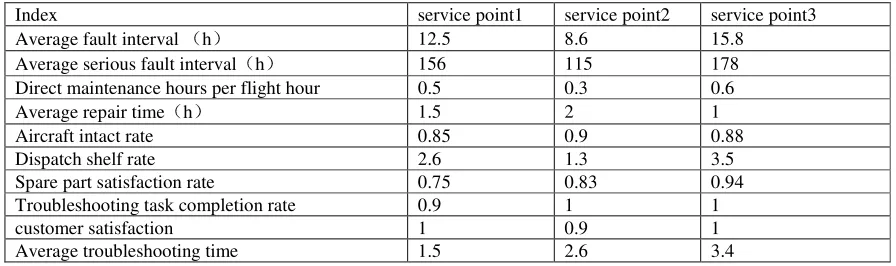
Analytic hierarchy process (AHP) is a systematic method of combining qualitative and quantitative analysis, it can transform a relatively complex evaluation problem into a multi-index evaluation problem with hierarchical structure through layer by layer decomposition [11]. The AHP generally has a three-level structure. The top level is the main objective and task of this evaluation. The middle level is the decomposition of the top level indicators, and the bottom level is all the objects involved in the evaluation [12]. In this paper, we use the index system and AHP model to give the results of the quality of aircraft use, and select the indexes related to the quality of use from the basic indexes. The first-level indexes as the middle tier, including the reliability, maintainability, supportability, service guarantee. The secondary-level indexes as the bottom level, including the RMS parameters of aircraft and service support capacity indicators, the establishment of RMS level evaluation model. The corresponding data are selected as samples from the historical database, and the normalization process is carried out. Table 2 shows the three service points collected by the contractor.
Table 2. Different service points cluster process index data.
Index service point1 service point2 service point3
Average fault interval (h) 12.5 8.6 15.8
Average serious fault interval(h) 156 115 178
Direct maintenance hours per flight hour 0.5 0.3 0.6
Average repair time(h) 1.5 2 1
Aircraft intact rate 0.85 0.9 0.88
Dispatch shelf rate 2.6 1.3 3.5
Spare part satisfaction rate 0.75 0.83 0.94
Troubleshooting task completion rate 0.9 1 1
customer satisfaction 1 0.9 1
Average troubleshooting time 1.5 2.6 3.4
Create a judgment matrix for decomposing index at each level, using the index 1-9 scaling method
[13]
[image:4.612.82.530.542.675.2]Table 3. The first level of the standard judgment matrix.
Judgment matrix reliability maintainability supportability service
guarantee Wi
reliability 1 2 3 3 0.4646
maintainability 0.5 1 0.5 1 0.1573
supportability 0.3333 2 1 2 0.2395
service guarantee 0.3333 1 0.5 1 0.1385
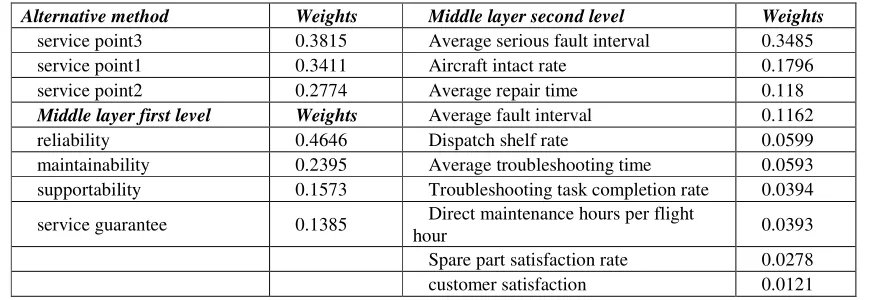
The calculation process of AHP mainly consists of consistency checking, ranking of single level and total ranking of levels, and finally obtaining the ranking result of the underlying plan [14], using the judgment matrix and each service point RMS index data, we can get the relative weight of each level index in RMS level evaluation, as shown in Table 4.
Table 4. The result of AHP model.
Alternative method Weights Middle layer second level Weights
service point3 0.3815 Average serious fault interval 0.3485
service point1 0.3411 Aircraft intact rate 0.1796
service point2 0.2774 Average repair time 0.118
Middle layer first level Weights Average fault interval 0.1162
reliability 0.4646 Dispatch shelf rate 0.0599
maintainability 0.2395 Average troubleshooting time 0.0593
supportability 0.1573 Troubleshooting task completion rate 0.0394
service guarantee 0.1385 Direct maintenance hours per flight
hour 0.0393
Spare part satisfaction rate 0.0278
customer satisfaction 0.0121
Through the calculation of the RMS index sample data, the RMS ranking of each service point is finally obtained, and the service point 2 has the lowest score, which will be the key improvement target. It can be seen from the above examples that through the combination of quantitative and qualitative analysis, the ranking of aircraft RMS levels at different service points is more credible. Analysts can compare each indicator pairwise when making a comparison, which makes it more scientific than the weighting factor for all factors by experience alone, as the analyst is more accurate when considering only two factors.
Conclusion
The quality of aircraft is the most direct standard to test the reliability, maintainability and safeguarding level of the equipment in real environment. According to the characteristics of use, the index system is established according to relevant standards, which is good for the quality of equipment in use to change from macro assessment to refinement assessment. This paper investigates the multi-index comprehensive analysis and evaluation method for equipment quality. Single-factor trend forecast based on time series method and multi-index evaluation of aircraft use quality based on AHP model are studied from the perspective of single-index and multi-index combination rules. The calculation results under the corresponding historical data are given, which provides a feasible calculation method for the quantitative analysis of equipment use quality index. Overall, the comprehensive evaluation of equipment quality and multiple indicators provide support for maintenance and quality equipment maintenance judgment.
Acknowledgement
[image:5.612.89.524.236.386.2]Reference
[1] Wang Z L. Demonstration od reliability maintenance requirements [M]. National Defense Industry Press, 2011.
[2] Sangwook Lee. Determination of Priority Weights under Multiattribute Decision-Making Situations: AHP versus Fuzzy AHP[J]. Journal of Construction Engineering and Management,2015,141(2).
[3] Liu P, Dong Z Q, Qu Y, et al. Assessment of equipment maintenance ability based on AHP and fuzzy comprehensive evaluation [J].
[4] Zhang S P. Research on aircraft maintenance ability evaluation [D]. Beihang University, 2010.
[5] Zhao Q B. Research on the quality evaluation method of aircraft use process and its system realization [D]. Beihang University, 2012.
[6] Authoring Group of Reliability Maintainability Glossary of Terms. Reliability Maintainability Glossary of Terms [M]. National Defense Industry Press, 2002.
[7] Li R Y, Kang R. Research on failure rate forecasting method based on ARMA model [J]. Systems Engineering and Electronics, 2008,30(8):1588-1591.
[8] Liu D J, Zou Z H. Applications of Gray Forecast Model Combined with Artificial Neural Networks Model to Water Quality Forecast[J]. Systems Engineering, 2011,29(9):105-109.
[9] Wang T E, Zhang T. Forecast Combination Theory, Method and Application [M]. Beijing:Social Sciences Academic Press, 2008.
[10] Wen J Q, Li Q, Zhao Q B. A method of analyzing influence degree of maintenance process based on neural network [J]. Journal of Aerospace University, 2011, 37(6):690-694.
[11] Cui J G, Fu K Y, Chen X C, et al. Multi-attribute aircraft maintenance decision method based on gray fuzzy and analytic hierarchy process [J]. Journal of Aeronautics, 2014, 35(2).
[12] Li F W, Du X L, Zhang M J, et al. Improved AHP Method and Its Application in Risk Identification [J]. Journal of construction engineering and management, 2013, 139(3).
[13] Rouyendegh B D. Developing an integrated AHP and Intuitionistic FuzzyTOPSIS methodology [J]. Tehnicki Vjesnik, 2014, 21 (6).