Abstract— Some ratio-type estimators have been proposed in stratified random sampling using auxiliary attribute. The expressions for the bias and mean square errors of the proposed estimators have been derived up to first order of approximation. Comparisons have been made with traditional combined ratio estimator and it is shown that the proposed estimators are more efficient than combined ratio estimator under certain condition. For illustration, an empirical study has been carried out.
Keywords: Proportion, Bias, MSE, Ratio-type estimators, Stratified random sampling.
I. INTRODUCTION
The ratio estimator was observed to be more precise than the usual sample mean estimator under different conditions for estimating the population mean of the study character. Several researchers diverted their attention in the direction of using prior value of certain population parameters to find the estimates that are more precise. Searls (1964) used coefficient of variation of study character at estimation stage. In practice, coefficient of variation is seldom known. Motivated by Searls (1964) work, various authors including Sen (1978), Sesodiya and Dewivedi (1981) Singh et al (1991) and Upadhyaya and Singh (1984) used the known coefficient of variation of auxiliary character for estimating population mean of the study character in ratio method of estimation. Singh et al (1973) first made the use of prior value of coefficient of kurtosis in estimating the population variance of study character. Later used by Searls and Interapanich (1990). Recently Singh and Tailor (2003) proposed a modified ratio estimator by using the known value of correlation coefficient. Taking into consideration
Manuscript received Aug 22 , 2013; revised Jan15, 2014. . R.V.K.Singh, Senior lecturer and Head, Department of Mathematics, Kebbi State University of Science and Technology, Aliero,Nnigeria, (e-mail: [email protected])
A.Aahmed, Assistant lecturer, Usmanu danfodiyo university, Sokoto, Nigeria (e-mail:[email protected] ).
the point biserial correlation coefficient between auxiliary attribute and study variable, Jhajj et al (2006) and Singh, et al (2008) defined ratio estimators of population mean when the priori information on auxiliary variable possessing some attribute is available.
Consider a random sample of size
n
n
1n
2
...
n
k to be taken from a population of size1 2
...
kN
N
N
N
stratified intok
strata. Let a sample of sizen
h,
h
1, 2,...,
k
be drawn by simple random sampling without replacement from a stratumh
of sizeN
h. Lety
i and
i denote the observations on a random variabley
and
respectively fori
th unit
i
1, 2,...,
N
. Suppose there is a complete dichotomy in the population with respect to the presence or absence of an attribute, say
, and it is assumed that attribute
takes only two values 0 and 1 as
i
1
, if I unit of the population possesses attribute
0
, otherwise .Then we have the following definition;
1 N
i i
A
- denotes the total number of units in thepopulation possessing attribute
.1
h
N
h hi
i
A
- denotes the total number of units in thestratum
h
possessing attribute
.1
h
n
h hi
i
a
- denotes the total number of units in thesample drawn from stratum
h
possessing attribute
.Ratio-Type Estimators in Stratified Random
Sampling using Auxiliary Attribute
P
N
- denotes the proportion of units in the populationpossessing attribute
. h h hA
P
N
- denotes the proportion of units in the stratumh
possessing attribute
. h h ha
p
n
- denotes the proportion of units in the sampledrawn from stratum
h
possessing attribute
.In stratified random sampling, the traditional combined ratio estimators for the population mean using auxiliary attribute is defined as;
ˆ
stn st
y
T
P
R P
p
(1.1)Where
1 k
st h h
h
y
w y
,1
1
nhh i i h
y
y
n
, 1 kst h h
h
p
w p
, h hN
w
N
The Bias and Mean Square Error (MSE) of the traditional estimator are given by equations (1.2) and (1.3) respectively as;
2
2
1
1
ˆ
kh h h y h
h
Bias T
w
RS
S
P
(1.2)
2
2 2 2
1
ˆ k 2
h h yh h y h
h
MSE T w
S R S RS
(1.3)
Where h
1
1
h h
n
N
, h hN
w
N
is the weight ofstratum
h
,R
Y
P
is the population ratio,n
h is the number of units in sample from stratumh
,N
h is the population size of stratumh
,S
2yh is the population variance in stratumh
,S
2h is the population variance of auxiliary attribute in stratumh
andS
y h is the population covariance between auxiliary attribute and variable of interest in stratumh
.II. PROPOSED ESTIMATORS
The proposed estimators can be written in the form below;
1
1 2
1 2
1
( ( ))
ˆ ( )
( )
k
h h h h h
h
i k
h h
h
w y b p P
T m P m
w m p m
,
(
i
1, 2,...,10)
(2.1)
1
2functions of the known parameters of the attribute such as coefficient of variation
C
p, coefficient of kurtosis2
( )
B
and point biserial correlation coefficient
pb.2 y h h h
s
b
s
, 2
21
1
1
h
n
h i h
i h
s
p
n
and
11
1
h ny h i h i h
i h
s
p
y
Y
n
Remark 1: when we put
b
h
0
,m
1
1
andm
2
0
, the proposed estimators reduce to traditional estimator. The following scheme presents the estimators of the population mean, which can be obtain by suitable choices of constantsm
1 andm
2.ESTIMATOR VALUES
OF 1
m
m
2
1 1 1ˆ
kh h h h h
h
k
h h h
w
y
b
p
P
T
P
w p
1 0
1 2 2 2 1 ˆ kh h h h h
h k
h h h
w y b p P
T P w p
1 2
1 3 1 ˆ kh h h h h h
p k
h h p h
w y b p P
T P C
w p C
1 pC
1 4 1 ˆ kh h h h h h
pb k
h h pb h
w y b p P
T P w p
1 pb
1 5 1 ˆ kh h h h h
h
p k
h h p
h
w y b p P
T P C
w p C
2
C
p
1 6 2 2 1 ˆ kh h h h h
h
p k
h p h h
w y b p P
T C P
w C p
p
1 7 1 ˆ kh h h h h
h
p pb
k
h p h pb
h
w y b p P
T C P
w C p
pC
pb
1 8 1 ˆ kh h h h h
h
pb p
k
h pb h p
h
w y b p P
T P C
w p C
pb
C
p
1 9 2 2 1 ˆ kh h h h h
h
pb k
h h pb
h
w y b p P
T P w p
2
pb
1 10 2 2 1 ˆ kh h h h h
h
pb k
h pb h h
w y b p P
T P w p
pb
2
The Bias and Mean Square Error (MSE) up to first order approximation of the proposed estimators are given by equations (2.2) and (2.3) respectively as;
2 2 21
ˆ
ki i h h h
h
Bias T
Y
w
S
,(
i
1, 2,...,10)
(2.2)Where 1
1
P
, 2
2
1
P
, 31
pP C
, 41
pbP
, 5
2
2 p P C ,
6 2 p pC
PC
7 p p pb C PC , 8 pb pb p P C
,
2 9 2 pb P
,.
2
2 2 2
2
1
ˆ
k1
,
i h h i h yh pbh
h
MSE T
w
R S
S
i
1, 2,...,10
(2.3)Where
R
1Y
P
,
2 2 Y RP
, 3
p Y R P C , 4 pb Y R P
,
2 5 2 p Y R P C
6
2
p p
YC R
PC
, 7 p p pb YC R PC
, 8
pb pb p
Y
R
P
C
,
2 9 2 pb Y R P
, 10
2 pb pb Y R P
III. EFFICIENCY COMPARISONS
We compare the traditional estimator
T
ˆ
with the proposed estimatorsT
ˆ
i(
i
1, 2,...,10)
and the conditions for which the proposed estimators will have the least mean square errors were obtained as follows;
ˆ
ˆ
i
MSE T
MSE T
2
2 2 2 2 2 2 2 2 2
1 1
2
k k
h h i h yh pbh yh h h yh h y h
h h
w R S S S w S R S RS
2 2 2 2 2 2 2 2 2 2
1 1 1 1
2
k k k k
i h h h h h pbh yh h h h h h y h
h h h h
R w S w S R w S R w S
Let 2 2
1 k
h h h h
A
w
S
, 2 2 21 k
h h pbh yh h
B
w
S
,2 1 k
h h y h h
C
w
S
Then we have
2 2
2
iR A B
R A
RC
2 2
2
0
i
R A R A B
RC
2 2
2 0i
A R R B RC
Where there are two conditions as follows; (i)When
R
i2
R
2
0
2 2 2 0 i B RC A R R 2 2 2 i B RC A R R
(ii) When
Ri2R2
02 2 2 0 i B RC A R R 2 2 2 i B RC A R R
IV. EMPIRICAL STUDY
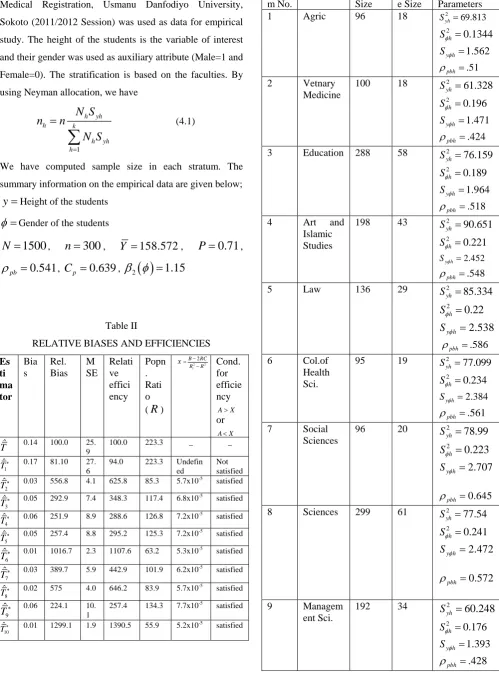
The information on 1500 Students taken from Students Pre-Medical Registration, Usmanu Danfodiyo University, Sokoto (2011/2012 Session) was used as data for empirical study. The height of the students is the variable of interest and their gender was used as auxiliary attribute (Male=1 and Female=0). The stratification is based on the faculties. By using Neyman allocation, we have
1 h yh
h k
h yh h
N S
n
n
N S
(4.1)We have computed sample size in each stratum. The summary information on the empirical data are given below;
y
Height of the students
Gender of the students1500
N
,n
300
,Y
158.572
,P
0.71
,0.541
pb
[image:4.595.47.547.105.783.2]
,C
p
0.639
,
2
1.15
Table II
RELATIVE BIASES AND EFFICIENCIES
Es ti ma tor
Bia s
Rel. Bias
M SE
Relati ve effici ency
Popn . Rati o (
R
)2 2
2
i
B RC X
R R
Cond.
for efficie ncy
AX or
AX
ˆ
T 0.14 100.0 25.9 100.0 223.3 _ _
1
ˆ
T 0.17 81.10 27.
6
94.0 223.3 Undefin ed
Not satisfied
2
ˆ
T 0.03 556.8 4.1 625.8 85.3 5.7x10
-5
satisfied
3 ˆ
T 0.05 292.9 7.4 348.3 117.4 6.8x10
-5 satisfied
4
ˆ
T 0.06 251.9 8.9 288.6 126.8 7.2x10
-5
satisfied
5 ˆ
T 0.05 257.4 8.8 295.2 125.3 7.2x10
-5 satisfied
6 ˆ
T 0.01 1016.7 2.3 1107.6 63.2 5.3x10
-5 satisfied
7 ˆ
T 0.03 389.7 5.9 442.9 101.9 6.2x10
-5 satisfied
8 ˆ
T 0.02 575 4.0 646.2 83.9 5.7x10
-5
satisfied
9
ˆ
T 0.06 224.1 10.1 257.4 134.3 7.7x10
-5 satisfied
10
ˆ
T 0.01 1299.1 1.9 1390.5 55.9 5.2x10
-5 satisfied
Table I DATA STATISTICS Stratu
m No.
Faculty Stratum Size
Sampl e Size
Stratum Parameters
1 Agric 96 18 2
69.813
yh
S
2
0.1344
h
S
1.562 y h
S
.51
pbh
2 Vetnary Medicine
100 18 2
61.328
yh
S
2
0.196
h
S
1.471 y h
S
.424 pbh
3 Education 288 58 2
76.159
yh
S
2
0.189
h
S
1.964 y h
S
.518 pbh
4 Art and
Islamic Studies
198 43 2
90.651
yh
S
2
0.221
h
S
2.452
y h
S
.548
pbh
5 Law 136 29 2
85.334
yh
S
2 0.22
h
S
2.538
y h
S
.586 pbh
6 Col.of Health Sci.
95 19 2
77.099 yh
S
2
0.234
h
S
2.384
y h
S
.561 pbh
7 Social Sciences
96 20 2
78.99
yh
S
2
0.223
h
S
2.707
y h
S
0.645 pbh
8 Sciences 299 61 2
77.54
yh
S
2
0.241
h
S
2.472
y h
S
0.572
pbh
9 Managem ent Sci.
192 34 2
60.248
yh
S
2
0.176
h
S
1.393
y h
S
.428
pbh
From Table II, we observed that the proposed estimators that use some known value of population proportion perform better and less bias than the traditional estimator.
V. CONCLUSION
In the present paper, we have developed some ratio-type estimators in stratified random sampling for estimating population mean by using information on auxiliary attributes. By comparison, it is found that the proposed estimators are more efficient and less bias than the traditional combined ratio estimator is. These theoretical conditions are also satisfied by the results of an application with original data. For practical purposes, the choice of the estimator depends upon the availability of the population parameters.
REFERENCES
[1] A. R. Sen,“Estimation of the population mean when the coefficient of variation is known,” Commun. Statist. ,Theory – Meth. A (7), 657-672,1978.
[2} B. V. S.Sisodiya and V. K. Dewivedi,” modified ratio estimator using coefficient of variation of auxiliary variable,” Jour. Ind. Soc. Agr. Statistics, 33, 2, 13-18,1981.
[3] D. T Searls, “The utilization of known coefficient of variation in the estimation procedure,” Journal of American Statistical Association, 59, 1125-1226,1964.
[4] D. T. Searls and P.Intarapanich,“A note on an estimator for the variance that utilizes the kurtosis,” The American Statistician, 44, 4, 295-296,1990.
[5] H. P. Singh and R.Tailor,”Use of known correlation coefficient in estimating the finite population mean. Statistics in Transition,6 4, 555-560,2003.
[6] H. S Jhajj, M. K Sharma and L. K., Grover,“A family of estimators of population mean using information on auxiliary attribute,” Pak. J. Statist., 22 (1), 43-50,2006.
[7] J.Singh ,B. N.Pandey and K.Hirano,“On the utilization of a known coefficient of kurtosis in the estimation procedure of variance,” Ann. Inst. Stat. Math., 25, 51-55,1973.
[8] L. N. Upadhayaya and H. P. Singh,“On the estimation of the population mean with known coefficient of variation,” Biometrical
Journal, 26 (8), 915-922.1984.
[9] R.Singh, P. Chauhan ,N. Sawan and F.Smarandache,“Ratio estimators insimple random sampling using information on auxiliary attribute,”
Pak. J. Stat. Oper.Res. 4(1), 47-53,2008.