Abstract— Effects of process parameters on vibration frequency of Perspex round plastic bars was investigated experimentally under clamped - free (C - F) boundary condition during turning operation. Mathematical models were developed using Taguchi L9 orthogonal array design. Spindle speed (V), feed rate (f), and depth of cut (d) were selected as input variables in order to predict the effects of vibration frequency on the work-piece. Nine samples were run in a CNC lathe machine, and each of the experimental result was measured using DTO 32105 frequency analyser and a MXC-1600 digital frequency counter. A minimum vibration frequency of 104.8 Hz was obtained at a cutting speed of 320 m/min, feed rate 0.05 min/rev and at a depth of cut of 0.5 mm. The mathematical model developed shows the accuracy of predicting the vibration frequency to be 99.5% and the various combinations of parameters that results in the minimum vibration frequency were determined. Obtained optimum input parameters for vibration frequency indicated that production operations of Perspex round plastic bars could be enhanced.
Index Terms— Machining, Perspex, Turning operation,
orthogonal array design, CNC machine.
I. INTRODUCTION
achining is the most noticeable aspects of engineering practice that has been with man for centuries.
It has remained one of the cardinal means of production and manufacturing which cuts across every face of engineering technology.
In recent years, machining technology has experience speedy development; the innovative technology in certain has substantial variations such as the integration of computer mathematical regulator systems. Emerging trends
Manuscript received January 05, 2018; revised March 31, 2018. I. P. Okokpujie is with the Department of Mechanical Engineering, Covenant University, P.M.B 1023, Ota, Ogun State, Nigeria (*Corresponding Authors): [email protected]
E.Y. Salawu is with Department of Mechanical Engineering, Covenant University, P.M.B 1023, Ota, Ogun State, Nigeria
Email : [email protected]
O. N. Nwoke is with the Department of Mechanical Engineering, Akanu Ibiam Federal Polytechnic, Unwana
U. C. Okonkwo is with the Department of Mechanical Engineering, Nnamdi Azikiwe University, Awka, Nigeria
I. O. Ohijeagbon is with the Department of Mechanical Engineering, University of Ilorin, P.M.B 1515, Ilorin, Kwara State, Nigeria.
K. O. Okokpujie is with the Department of Electrical and Information Engineering, Covenant University, Ota, Ogun State, Nigeria. Email:
at trade-fairs, conferences research institutes and the industrial sector has shown that production capabilities have increased tremendously with machining operations [1]. The correctness and efficiency are being improved constantly with inventive solutions to attain market demands or even increase them to good quality standards. For numerous years, investigation of machine tool vibrations and unsteadiness problems has received substantial attention in order to improve the metal removal procedure. Researchers across the globe have also delved into investigations, “known and ambiguous” with the view to proffering solutions to machining vibration and other optimization problems. Increasing interest in machining, have led to advancing the scope of existent dynamic optimization solutions, and exploring new aspects and areas of concern [2].
The operating principle of CNC is to rule the motion of the work-head relative to the work-part and to control the order in which the motions are carried out. A CNC scheme consists of four (4) basic components which are, Part Program, Machine Control Unit, MCU, and machining Equipment.
In turning operations carried out on a CNC or conventional lathe machine, the work-piece is rotated on a spindle and the instrument is fed into it radially, axially or concurrently to give the desired surface finishing.
Perspex is a transparent plastic, sometimes called acrylic glass or Poly (methyl methacrylate) (PMMA). Durable and very transparent, is widely used in most fields and used such as: rear-lights and instrument groups for vehicles, appliances and lenses for glasses.
Machining process, there are many kinds of diverse parameters which may contribute to vibration build-up, thus affecting machining performance. It is impossible to consider all the factors at once in an experimental vibration studies. The most important factor(s) are often selected as objective function and constraints in machining process models. Some of the most important factors are listed as follows. [3] - [5]. Structural: stiffness, damping, modes of vibration, cutting parameters/conditions: feed rate (chip thickness), cutting speed (spindle speed), depth of cut, tool geometry, cutting forces, appropriate units are usually pre-set on the CNC machines to conform to those used in the part programmed.
The most important machining parameters affecting the machining performance of CNC milling and turning machines are cutting speed, feed rate, and cutting depths (axial depth of cut and radial depth of cut) [6] – [9]. Hence,
Effects of Process Parameters on Vibration
Frequency in Turning Operations of Perspex
Material
Imhade P. Okokpujie, E.Y. Salawu, O. N. Nwoke, U. C. Okonkwo, I. O. Ohijeagbon, Kennedy Okokpujie
and energy, consequently the review of vibration improvement techniques as presented in this study would help in vibration control and avoidance which is an issue of great interest. Furthermore, the study would assist machining operators to reduce vibration either passively or actively by applying absorbers, damping vibration isolators, varied speed or other alternatives [11]. The study of vibration is important in the prediction of machining stability and enhancement of tool life. [12].
Several methods of simulation methods have been designed for study of machining dynamics and vibration. Tlusty [1] work on the steadiness part diagram that explains the correlation between the depths of cut and spindle speed. The theoretical calculation was then repeated based on the system control hypothesis, were the cutting process and vibration was analysed and modelled in the frequency domain. [13].
Nevertheless, it is well known that when chatter occurs, it does not generate for an indefinite period but stabilises at limited amplitude of vibration. Throughout this period, the force is not proportional to chip thickness but purely zero. [13] – [17] study the effects of cutting process on the work-piece dynamics. Though, during applying time domain model to predict the margined of steadiness in milling process, is often complicated to differentiate between belongings of vibrations due to unsteadiness and cases of too much vibrations due to great periodic forces. Recently Li [10] design a statistical technique to resolve the differential equations controlling the subtleties of both milling and lathe machining systems and projected the ratio of the predicted extreme energetic machining force to the predicted maximum stationary cutting force were used as a standard for the chatter steadiness. When this process is not well defined during machining operation it can lead to fatigue, creep and can increase the rate of corrosions in our manufacturing product [24-31].
The current study aimed at resolving the problems posed by vibration frequency and also to conduct an empirical study of turning operation through a three-factor, three-level experimental design and to develop a mathematical model that can predict vibration frequency. The factors considered are the cutting speed, the depth of cut and feed rate which are the machined parameters.
II. MATERIALS AND METHODS
The material used for the investigation was Perspex round bars with actual dimensions of 381 mm (length) and
by executing the program file which contains the prescribed operating conditions from the designed experiments. 9 samples were then run on the CNC lathe machine experimentally. Vibration frequency data were recorded with DTO 32105 frequency analyzer and MXC-1600 digital frequency counter respectively.
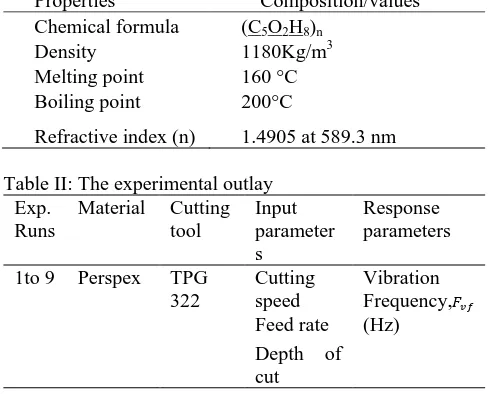
Detailed information on chemical composition and the physical properties of the Perspex round bar is presented in Table I and details of the experimental outlay for the turning tests is presented in Table II.
Table I: Physical properties and chemical composition of Perspex
Properties Composition/values Chemical formula (C5O2H8)n
Density 1180Kg/m3
Melting point 160 °C
Boiling point 200°C
[image:2.595.303.547.368.565.2]Refractive index (n) 1.4905 at 589.3 nm Table II: The experimental outlay
Exp. Runs
Material Cutting tool
Input parameter s
Response parameters 1to 9 Perspex TPG
322
Cutting speed
Vibration Frequency, (Hz)
Feed rate Depth of cut
Fig. I: Experimental setup for Perspex turning operation Experimental design for this research is based on the Taguchi method. The Taguchi method allows for the prediction of ideal combination of input variables to give the best result on a response variable. It can also be used to find which input variable has the most significant effect.
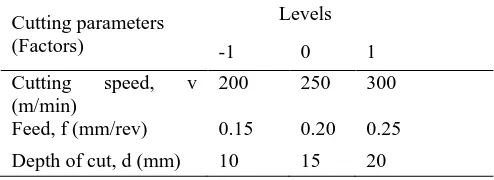
The investigational design was developed to evaluate the effect of cutting speed (v), feed rate (f), and depth of cut (d) on the vibration Frequency Three levels were assigned the three factors as expressed in Table III. The factors levels were selected within the specification by cutting tool manufacturer. Three cutting parameters at three levels led to a overall of 9 tests for Perspex turning operation according to the Taguchi L9 orthogonal array design. To select a suitable orthogonal array for carrying out the experiments, the degrees of freedom were calculated. Degrees of Freedom is one for Mean Value and two for each of the remaining three factors such as (32) = 8, therefore the total Degrees of Freedom is 9, the most suitable orthogonal array for this experimentation is L9 array with a total number of nine experiments runs as shown in Table IV.
Table III: Factors levels for experimental design Cutting parameters
(Factors)
Levels
-1 0 1
Cutting speed, v (m/min)
200 250 300
Feed, f (mm/rev) 0.15 0.20 0.25 Depth of cut, d (mm) 10 15 20
III. MATHEMATICAL MODELS
In the current study, the vector terms for the relationship between the turning conditions and the response parameter is expressed as [18]:
Where is the response function, k is either a function
operator of v, f, d, or a constant, is the wanted vibration frequency aspect and k is the response meaning, the estimation of is proposed by using a non-linear scientific model, which is appropriate for reading the interaction effects of process factors on vibration turning
model can be obtained by assuming that the operating parameters (v, f, d) contains exponent indices, taking the natural log of equation (1), it can hence be expressed by equation (2).
Where, x1, x2, x3, are logarithmic transformation of
machining factors, namely, cutting speed, feed rate, and depth of cut (radial) respectively, e is the error term; and β values are the estimates of corresponding parameters. These coefficients can be obtained through least-square method for multiple regressions by minimizing the sum of the squares of the residual. However, more efficient tools have been employed for the computation of the regression coefficients and the establishment of the mathematical model. Statistical software packages were employed to ease computations and certify accuracy of outputs. SPSS and MINITAB 16 were used for the determination of optimal experimental run number.
Vector terms relationship between the vibration frequencies and process parameters can be represented by equation (3) [19].
Where, K is constant, and x, y, z are the exponents. Equation (3) can be represented in mathematical form as follows:
Equating y =
The constant and exponents K, x, y, z can also be determined by least squares method, Where,
The predictive vibration linear model developed from the equation can be represented as follows:
In the current investigation, the desired characteristic for vibration frequency is “the lower the vibration frequency, the better. Computation of signal-to-noise ratio (S/N) is required for this study. A basic explanation of the signal-to-noise ratio is: a ratio of the change in output due to the changing variable versus changes in factors that cannot be controlled. The equation to find the S/N ratio for this characteristic (vibration frequency) is given by equation (6).
S/N = -10log10 [Mean of sum of squares of measured data]
(6)
[image:3.595.41.288.512.602.2]variables F 3156.233 151.57 .954 20.823 0.000
D 122.267 37.89 .148 3.227 0.023
The R-Square was 0.989 which showed that 98.89 % of the observed variability in could be explained by the independent variable which are cutting speed, depth of cut and feed rate. This implies that there is very strong relationship between the dependent variable (vibration frequency) and independent variables (process parameters). The Adeq Precision is 18.56417 which meant that the correlation coefficient between the observed value of the dependent variable (vibration frequency) and the predicted value based on the regression model are in good conditions.
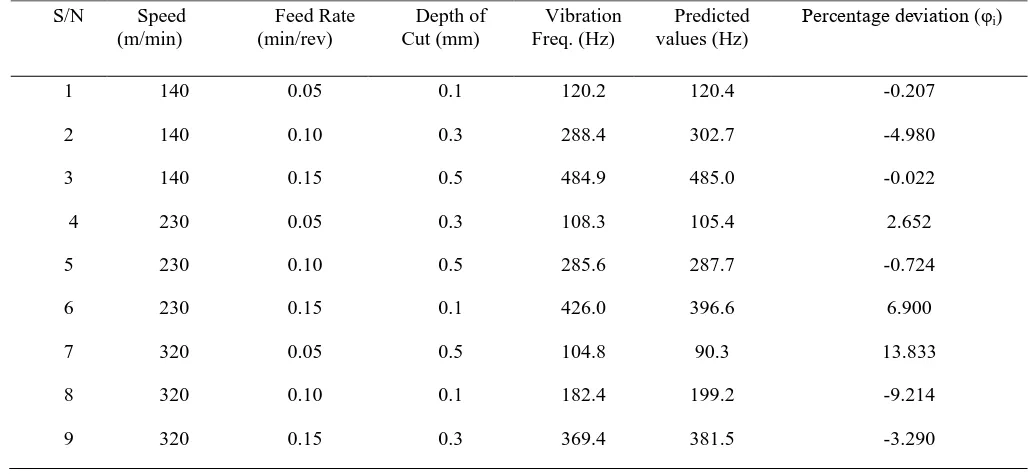
The comparison between the experimental data and the predicted data are presented in Table VII.
Hence, the mathematical model for vibration frequency is expressed by equation (7)
[image:4.595.306.546.74.121.2]
Table VII: Comparison between measured data and predicted data of Perspex material S/N Speed
(m/min)
Feed Rate (min/rev)
Depth of Cut (mm)
Vibration Freq. (Hz)
Predicted values (Hz)
Percentage deviation (φi)
1 140 0.05 0.1 120.2 120.4 -0.207
2 140 0.10 0.3 288.4 302.7 -4.980
3 140 0.15 0.5 484.9 485.0 -0.022
4 230 0.05 0.3 108.3 105.4 2.652
5 230 0.10 0.5 285.6 287.7 -0.724
6 230 0.15 0.1 426.0 396.6 6.900
7 320 0.05 0.5 104.8 90.3 13.833
8 320 0.10 0.1 182.4 199.2 -9.214
9 320 0.15 0.3 369.4 381.5 -3.290
S / No
Cutting speed (m/min)
Feed rate (mm/rev)
Depth ofcut (mm)
Vibration Frequency,
Fvf (Hz)
1 200 0.15 10 120.20
2 200 0.20 15 288.35
3 200 0.25 20 484.87
4 250 0.15 15 108.26
5 250 0.20 20 285.59
6 250 0.25 10 425.95
7 300 0.15 20 104.84
8 300 0.20 10 182.43
[image:4.595.311.549.157.232.2] [image:4.595.46.288.217.370.2] [image:4.595.36.554.461.698.2]Fig. II: Actual and Predicted values of vibration frequency The actual values gotten from the experiment and the predicted values obtained from the developed mathematical models are depicted in Fig. II is clearly observed that they have good agreement quantitatively. To determine the correctness of the mathematical model developed, percentage deviation φi and average percentage
deviation were used. The percentage deviation φi is
stated as [18].
Where, = percentage deviation of single sample data, =experimental values, = predicted values from the multiple regression equation (model).
Similarly, the average percentage deviation is stated as [18];
Where the average percentage deviation of all sample data and n is is the size of sample data.
For training data,
The result of average proportion deviation shows that the mean (average) percentage deviation (error), = 99.5%. This means that the statistical models could predict vibration frequency with about 99.5% accuracy.
A. Evaluation of the signal to noise ratio with the process parameters
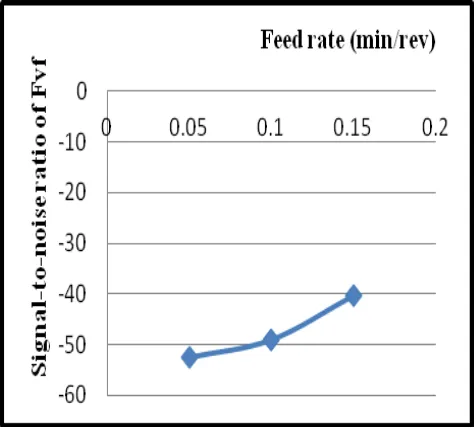
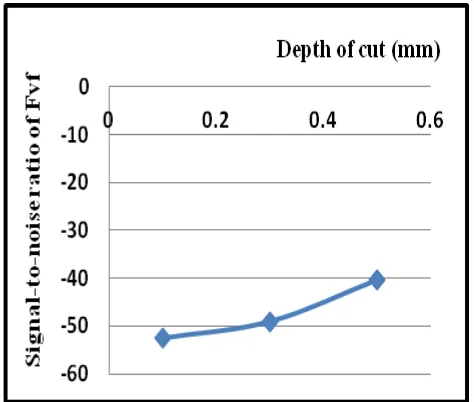
[image:5.595.313.553.278.485.2]The main effect of the signal-to-noise ratio characteristics with process parameters which are cutting speed (v), feed rate (f), and depth of cut (d) on vibration frequency for the turning experiments are shown in Fig. III - V. The relative impact of each parameter on vibration frequency for the test materials can be deduced from the respective graph.
Fig. III: Signal-to-noise ratio variation with cutting speed
[image:5.595.313.551.509.724.2]Fig. V: Signal-to-noise ratio variation with Depth of cut Fig. III-V shows the influence of each level of the process parameters on the signal-to-noise ratio with maximum value taken as the optimum value. In Fig. III as the cutting speed increases, the signal-to-noise ratio decreases. This explains the negative trend of the Signal-to-noise ratio and in the predictive mathematical models. Increases in feed rate and depth of cut leads to increase in signal-to-noise ratio as portrayed in the positive sign of the coefficients of feed rate (f) and depth of cut (d). As the signal-to-noise ratio increases it result in increasing the vibration frequency
B. Effect of process parameters on the vibration frequency
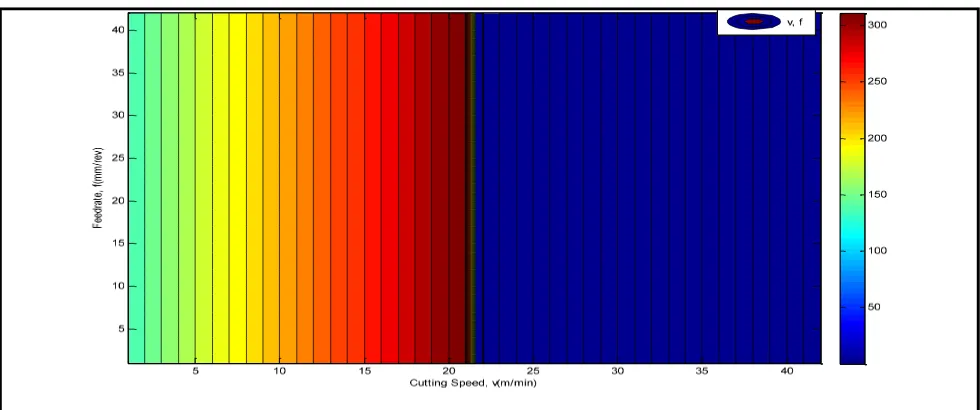
Fig. VI-VIII shows the contour plots for the vibration frequency and the process parameters which are the cutting speed (v), feed rate (f) and depth of cut (d) respectively. The contour plot shows graphically the influence of each control parameters on vibration frequency. These plots reveal that as cutting speed increases, vibration frequency decreases, increasing the cutting speed will increases the cutting force and eradicates the built-up edge (BUE) inclination there by producing good surface finish. At low cutting speed, the unstable larger BUE is developed and also the chips rupture eagerly creating the vibration and heat generation. As the cutting speed increases, the BUE vanishes, chip fracture decreases, and hence, the vibration frequency decreases. This result is in line with observation made by Ezugwu et al [3], Nwoke et al. [19] and Seguy [20], which indicated that the increase in cutting speed reduces vibration frequencies.
vibration frequency reduces to 104 Hz; at this stage, the colour changes from light blue to blue colour which shows that with more increase in cutting speed it will continue to reduce the vibration frequency.
Fig. VII shows that due to the great influence of the feed rate as it increases, the vibration frequency also increases, irrespective of changes in the depth of cut.
V. CONCLUSION
Through experimentation, the model developed for perpex round bars material investigated during turning operations, proved its capability of predicting the vibration frequency with about 99.5% accuracy
The important conclusions drawn from the present study are as follows:
The quadratic second order models developed to predict the vibration frequency value for the turning operation could provide very close predictive values for vibration frequency to the actual values by applying the values of the control parameter on the model.
In the order of influence, feed rate has the most significant effect on the vibration frequency, followed by cutting speed. However, depth of cut has little effect on the vibration frequency.
From the investigation the minimum vibration frequency of 104.8 Hz during turning operation occurs at a cutting speed of 320 m/min, feed rate of 0.05 min/rev and depth of cut 0.5 mm respectively.
ACKNOWLEDGMENT
Fig. VI: Vibration frequency contour plot for feed Rate vs. depth of cut
Fig. VII: Vibration frequency contour plot for cutting speed vs. depth of cut
[image:7.595.53.543.522.727.2]modeling to predict surface roughness in CNC milling." World
Academy of Science, Engineering and Technology 53 (2009):
393-396.
[6] U. C. Okonkwo, I. P. Okokpujie, J. E. Sinebe, and C. AK. Ezugwu.
"Comparative analysis of aluminium surface roughness in end-milling
under dry and minimum quantity lubrication (MQL)
conditions." Manufacturing Review 2 (2015): 30.
[7] C. M. Taylor, S. Turner, and N. D. Sims. "Chatter, process damping,
and chip segmentation in turning: A signal processing
approach." Journal of Sound and Vibration 329, no. 23 (2010):
4922-4935.
[8] M. Kuttolamadom, Sina Hamzehlouia, and L. Mears. "Effect of
machining feed on surface roughness in cutting 6061 aluminum." SAE
International journal of materials and manufacturing 3, no.
2010-01-0218 (2010): 108-119.
[9] H. Z. Li, X. P. Li, and X. Q. Chen. "A novel chatter stability criterion for the modelling and simulation of the dynamic milling process in the time domain." The International Journal of Advanced Manufacturing
Technology 22, no. 9-10 (2003): 619-625.
[10] A. RazlanYusoff, M. R. Z. Suffian, and M. Y. Taib. "Literature review
of optimization technique for chatter suppression in
machining." Journal of Mechanical Engineering and Sciences
(JMES) 1 (2011): 47-61.
[11] I. Minis, and R. Yanushevsky. "A new theoretical approach for the prediction of machine tool chatter in milling." Journal of Engineering for Industry 115, no. 1 (1993): 1-8.
[12] Y. Altintas, "Modeling approaches and software for predicting the
performance of milling operations at MAL-UBC." Machining science
and technology 4, no. 3 (2000): 445-478.
[13] H. Li, and X. Li. "Modelling and simulation of chatter in milling using a predictive force model." International Journal of Machine Tools and
Manufacture 40, no. 14 (2000): 2047-2071.
[14] M. L. Campomanes, and Y. Altintas. "An improved time domain
simulation for dynamic milling at small radial immersions." Journal of
Manufacturing Science and Engineering 125, no. 3 (2003): 416-422.
[15] Sims, N. D., and M. S. Turner. "The influence of feed rate on process
damping in milling: modelling and experiments." Proceedings of the Institution of Mechanical Engineers, Part B: Journal of Engineering
Manufacture 225, no. 6 (2011): 799-810.
[16] N. D. Sims. "The self-excitation damping ratio: a chatter criterion for time-domain milling simulations." Journal of Manufacturing Science
and Engineering 127, no. 3 (2005): 433-445.
[17] I. P. Okokpujie and U. C. Okonkwo. "Effects of cutting parameters on
surface roughness during end milling of aluminium under minimum
[22] S. Sastry, S. G. Kapoor, R. E. DeVor, and G. E. Dullerud. "Chatter stability analysis of the variable speed face-milling process." Journal of Manufacturing Science and Engineering, Transactions of the
ASME 123, no. 4 (2001): 753-756.
[23] Shama, P.C. (2006). A Textbook of Production Technology (Manufacturing Processes), 6th Edition. S. Chand; p.699-721. [24] S. A. Afolalu, E. Y. Salawu, I. P. Okokpujie, A. A. Abioye, O. P.
Abioye, M. Udo, O. R. Adetunji, and O. M. Ikumapayi. "Experimental Analysis of the Wear Properties of Carburized HSS (ASTM A600)
Cutting Tool." International Journal of Applied Engineering
Research 12, no. 19 (2017): 8995-9003.
[25] I. P. Okokpujie, O. O. Ajayi, S. A. Afolalu, A. A. Abioye, E. Y. Salawu, M. Udo, U. C. Okonkwo, K. B. Orodu, and O. M. Ikumapayi. "Modeling and Optimization of Surface Roughness in End Milling of Aluminium Using Least Square Approximation Method and Response
Surface Methodology." International Journal of Mechanical
Engineering and Technology (IJMET) 9, no. 1 (2018): 587-600.
[26] I. P. Okokpujie, O. M. Ikumapayi, U. C. Okonkwo, E. Y. Salawu, S.
A. Afolalu, J. O. Dirisu, O. N. Nwoke, and O. O. Ajayi. "Experimental and Mathematical Modeling for Prediction of Tool Wear on the Machining of Aluminium 6061 Alloy by High Speed Steel Tools." Open Engineering 7, no. 1: 461-469.
[27] O. N. Nwoke, I. P. Okokpujie, and S. C. Ekenyem. "Investigation of
Creep Responses of Selected Engineering Materials." Journal of
Science, Engineering Development, Environmen and Technology
(JOSEDET) 7, no. 1 (2017): 1-15.
[28] B. O. Orisanmi, S. A. Afolalu, O. R. Adetunji, E. Y. Salawu, I. P. Okokpujie, A. A. Abioye, O. O. Akinyemi, and O. P. Abioye. "Cost of Corrosion of Metallic Products in Federal University of Agriculture,
Abeokuta." International Journal of Applied Engineering
Research 12, no. 24 (2017): 14141-14147.
[29] F. Onoroh, M. Ogbonnaya, C. B. Echeta. “Experimental Investigation of Cutting Parameters on a Turning Tool Flank Wear (Industrial and Production Engineering).” Covenant Journal of Engineering Technology (CJET) Vol. 1, No. 1, (2018): 55-72.
[30] U. C. Okonkwo, O. N. Nwoke, I. P. Okokpujie. “Comparative Analysis of Chatter Vibration Frequency in CNC Turning of AISI 4340 Alloy Steel with Different Boundary Conditions.” Journal of Covenant Engineering Technology (CJET) Vol. 1, No.1, (2018): 13-30.
[31] T. S. Ogedengbe, S. Abdulkareem, J. O. Aweda. “Effect of Coolant Temperature on Machining Characteristics of High Carbon Steel.”