Mining Educational Data using Filter based
Feature Selection Method
Pragati Sharma1, Sanjiv Sharma2
1
Research Scholar of Masters of Technology, Department Of CSE & IT, Madhav Institute Of Technology & Science, Gwalior (India)
2
Assistant Professor, Department Of CSE & IT, Madhav Institute Of Technology & Science, Gwalior (India)
Abstract: Today, the tremendous growth in electronic data of universities creates the need to have some meaningful information extracted from these large volumes of educational data. The advancement in the data mining field makes it possible to mine educational data in order to improve the quality of the educational processes and teaching methods. All these improvement leads to enhance the performance and overall institution output, is known as education mining. This study thus, uses data mining methods to study the performance of students. Educational data set is taken and filter method applied for best feature selection using WEKA an Open Source Tool. Filter based feature selection method used is Relief attribute selection which helps to know the most significant and least valuable features among the set of features. Then removal of the least valuable features is done and applies the classification algorithms such as Multilayer perceptron along with Adaboost. Therefore, this outperforms better prediction results into the three class levels such low, medium and high with improved accuracy in order to achieve the quality of education organizations. These prediction results would help to make policy decisions for the administration of educational organizations. The obtained results reveal that the removed feature somehow affects performance of students. Therefore, this study showcases the importance of Prediction and Classification based data mining algorithms with the help of feature selection method in the field of education and also presents some promising future lines.
Keywords: Relief Attribute Selection, Adaboost, Multilayer perceptron, Education mining, Weka tool.
I. INTRODUCTION
Currently, information plays important role for taking decisions. Any organisation can make policy using collected data from various sources such as Medical science, Education, Business, Agriculture and so on. Today, education institutions accumulate and store bulk of data, such as student enrolment and attendances records, as well as their examination results. Furthermore, educational institutions are beginning to use the data analytics for improving the quality of educational environments. One of the primary goals of any educational system is to equip students with the knowledge and skills needed to transition into successful careers within a specified period. How effectively global educational systems meet this goal is a major determinant of both economic and social progress ? The educational system is presently facing several issues such as identifying students need, demonstration of training and predicting quality of student interactions.
This issue led to the emergence of the field of education data mining (EDM). Traditional data mining algorithms cannot be directly applied to education problems, as they may have a specific objective and function. This implies that a pre-processing algorithm has to be enforced first and only the some specific data mining methods can be applied to the problems. Educational data mining (EDM) specify a set of techniques which may have help educational system to overcome this issue in order to enhance learning experience of students and increase their profits.
II. LITERATURE REVIEW
D. Krpan and S. Stankov [1] this paper show practical experience with specific e-learning system and applied data mining technique for the analysis which served as a tool for grouping students with similar characteristics.
S. Lakshmi Prabha and Dr. A.R. Mohamed Shanavas [2] this paper explains how the data mining tasks classification, prediction, and clustering can be applied to data taken from an e-learning system. The performance of sixth grade school students are taken for the analysis and present the results achieved with WEKA tool.
L. Calvet Liñán and Á. Alejandro Juan Pérez [3] in this paper, researchers review the similarities and differences between Educational Data Mining and Learning Analytics, two relatively new and increasingly popular fields of research concerned with the collection, analysis, and interpretation of educational data. Their origins, goals, differences, similarities, time evolution, and challenges are addressed, as are their relationship with Big Data and MOOCs.
III. PROPOSED METHODOLOGY This section describes the proposed methodology used in this research.
TABLE 1: Student Feature (Attributes) And Their Description
Attribute Description
Nationality Student nationality
Gender The gender of the student (female or male)
Place of birth Place of birth for the student(Jordan, Kuwait, Iran)
Parent responsible for student Student’s parent as(father or mother)
Educational stages(school level) Stage student belongs such as (primary, middle and high school levels)
Grade levels Grade student belongs as(G-01,G-02,G-03,G-04,G-05,G-06,G-06,G-07,G-08,G-09,G-10,G-11,G-12)
Section id Classroom student belongs to as(A,B,C)
Semester School year semester as(First or second)
Topic Course topic as(Math, English ,IT,Arabic,Science ) Student absence days Student absence days (Above-7, Under-7)
Parent answering survey Parent is answering the surveys that provided from school or not.
Parent school satisfaction This feature obtains the degree of satisfaction from school as follow(Good, Bad)
Discussion groups Student’s behaviour during interaction. Visited resources
Raised hands on class Viewing announcements
A. Data Pre-Processing
This section will intensively talks about the data pre-processing. Data pre-processing is the step before applying the data mining algorithm, it transforms the original data into a suitable shape to be used by a particular mining algorithm. Data pre-processing includes different tasks as data cleaning feature selection etc.
Fig. 2 : Relief Based Feature Selection Evaluation
As shown in Fig. 2, student absence days feature got the higher rank, then followed by visited resources, raised hands, relation, parent answering survey, parent school satisfaction, gender, topic and announcement view, discussion, nationality, place of birth, grade Id stage ID and other features section ID and semester got low rank .As seen in the Fig.. low rank features are excluded and obtained a subset of 15 feature. In summary, the features that are related to student and parent progress during the teaching and learning process got highest ranks which means learner’s behaviour during the educational process have an impact on their academic success.`
B. Method used in Education mining
This section defines the classification method used in the experimental work of the research:-
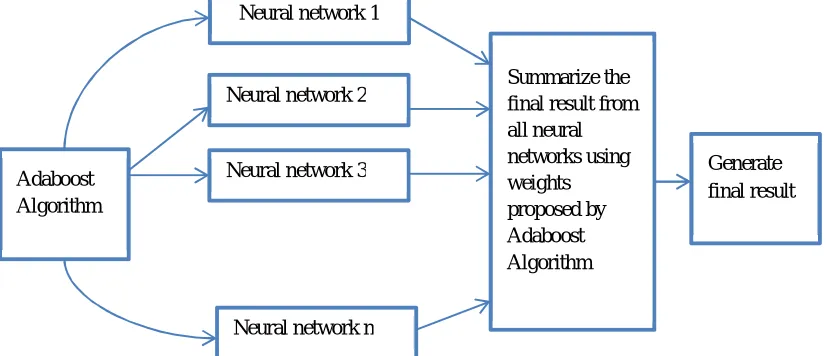
1) Adaboost : Boosting belongs to the family of algorithms that are capable of converting weak learners to strong learners. It is an example of dependent ensemble method. The general procedure is to train a set of learners sequentially and combine them for prediction, then focus more on the errors of the previous learner by editing the weights or weak learner. A specific limitation of boosting that is used to solve binary classification problems. The limitation is eliminated with the Adaboost algorithm. Adaboost is an example of boosting algorithm, which stands for Adaptive boost. The make idea behind this algorithm is to pay more attention to patterns that are hard to classify. The amount of attention is measured by a weight that is assigned to every subset in the training set. All the subsets are assigned equal weights. In each iteration, the weights of misclassified instances are increased while the weights or truly classified instances are decreased. Then the Adaboost ensemble combines the learners to generate a strong learner from weak classifiers through a voting process.
Fig. 3 : Structure of Adaboost -0.050
0.050.1 0.150.2 0.25 0.3 0.35
0.4
FEATURE RANK
FEATURE RANK
Neural network 1
Neural network 2
Neural network 3 Adaboost
Algorithm
Summarize the final result from all neural networks using weights proposed by Adaboost Algorithm
Neural network n
[image:5.612.89.502.534.712.2]2) Multi-Layer Perceptron : This method of classification is a class of feed forward artificial neural network model known as multi-layer perceptron that maps sets of input data onto a set of appropriate output data. As its name suggests, it consists of multiple layers of nodes in a directed graph, with each layer fully connected to the next one. The schematic architecture of this class of networks, besides having the input and the output layers, also have one or more additional layers also called the hidden layers. The hidden layer that means, the middle layer performs intermediate computation before giving the input layer to output layer.
Fig. 4 : Multilayer Perceptron
Algorithm: For Proposed Work
a) Step 1: Start the weka.
b) Step 2: Load x-API-Edu dataset in arff format.
c) Step 3: Apply ReliefF feature selection algo and get output.
d) Step 4: Remove low-valued attribute from dataset and save.
e) Step 5: Load final dataset.
f) Step 6: Choose Adaboost classifier and applied MultiLayer Perceptron classifier.
g) Step 7 : Run the algo.
h) Step 8 : Obtain classification result.
i) Step 9: supply test data.
j) Step 10: Obtain prediction result.
IV. EXPERIMENTAL RESULT ANALYSIS
This section describes the evaluation results of the research and their comparative analysis using different performance measures :-
A. Evaluation Result On Weka Screen
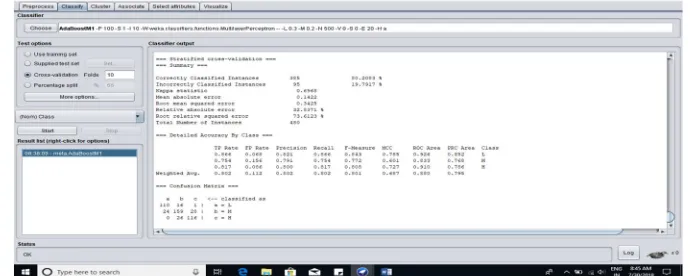
There are various feature used in evaluating student’s performances. Based on the modified filter based methodology the result of classification applying Adaboost with ANN is shown in Fig. 4. 80.2% accuracy is achieved as a result of classification and out of 480 records of students 385 students are correctly classified with respect to their class levels (low, Medium and High) and 95 students is incorrectly classified.
[image:6.612.132.477.580.718.2]B. Performance Measures
To characterize the effectiveness of the EDM techniques applied in this experiment, we decided to adopt the F-Measure (Han et al., 2011), which is widely used in domains such as information retrieval, machine learning and other domains that involve binary classification. In short, F-Measure (Eq. (1)) is the harmonic mean between Precision (Eq. (2)) and Recall (Eq. (2)), as described below:
F-measure = 2x ∗ ………. (1)
Precision = ………. (2)
Recall (TPR) = ………. (3)
Accuracy = ………. (4)
Where:
1) (True Positives - TP) TP is the number of positive instances correctly classified as positive.
2) (False Positives - FP) FP is the number of negative instances incorrectly classified as positive.
3) (False Negatives - FN) FN is the number of positive instances incorrectly classified as negative.
4) (True Negative - TN) TN is the number of negative instances correctly classified as negative.
C. Confusion Matrix
[image:7.612.223.389.145.218.2]A confusion matrix is a table that is often used to describe the performance of classification model on the set of the test data for which the true values are known. Measures calculate the classification confusion matrix using the following equations 1, 2, 3 and 4 respectively.
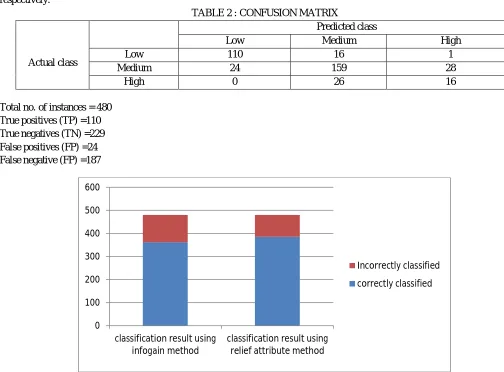
TABLE 2 : CONFUSION MATRIX
Actual class
Predicted class
Low Medium High
Low 110 16 1
Medium 24 159 28
High 0 26 16
Total no. of instances = 480 True positives (TP) =110 True negatives (TN) =229 False positives (FP) =24 False negative (FP) =187
Fig. 6 : Chart Showing Classification Result 0
100 200 300 400 500 600
classification result using infogain method
classification result using relief attribute method
Incorrectly classified
[image:7.612.41.545.344.716.2]Fig. 6 shows comparison of correctly and incorrectly classified data between existing classification results with information gain attribute selection applied with ranker Method & Proposed classification result with Relief attribute selection with ranker method. In existing classification result, 361 instances are correctly classified and 119 are incorrectly classified. In Proposed classification result, 385 instances are correctly classified and 95 are incorrectly classified.
Fig. 7 : Graphical Representation Of Performance Evaluation Measures
Fig. 7 shows comparison of evaluation measures accuracy, precision, recall and f-measure between previous result and current result. For accuracy current result achieved 80.2 accuracy after the removal of irrelevant attributes and 79.1 with attributes. This 80.2 improved accuracy means 385 students out of 480 are correctly classified to the right class levels (high, medium and low) and 95 are incorrectly classified.
For precision current result achieved 80.2 precision after the removal of irrelevant attributes and 79.1 with attributes. This 80.2 improved precision means 385 students out of 480 are correctly classified and 95 are misclassified.
For recall current result achieved 80.2 recall after the removal of irrelevant attributes and 79.2 with attributes. This 80.2 improved recall means 385 students out of 480 are correctly classified to the total no. of unclassified and correctly classified cases.
For f-measure current result achieved 80.1 accuracy after the removal of irrelevant attributes and 79.1 with attributes.
Table 3 : Tabulation Form Of Result Analysis Of Existing Result And Proposed Result Evaluating Measure Existing Result Proposed Result
Classifier Type ANN(MLP) ANN(MLP)
Accuracy 79.1 80.2
Precision 79.1 80.2
Recall 79.2 80.2
f-measure 79.1 80.1
.As shown in the table 2, we can notice that ANN model performances with new feature selection method. Proposed results achieved 80.2 accuracy with ANN model using new feature selection process after the removal of irrelevant attributes and 79.1 with attributes. This 80.2 improved accuracy means 385 students out of 480 are correctly classified to the right class levels (high, medium and low) and 95 are incorrectly classified.
For precision measure, results achieved 80.2 precision after the removal of irrelevant attributes and 79.1 with attributes. This 80.2 improved precision means 385 students out of 480 are correctly classified and 95 are misclassified.
For recall measure, results achieved 80.2 recall after the removal of irrelevant attributes and 79.2 with attributes. This 80.2 improved recall means 385 students out of 480 are correctly classified to the total no. of unclassified and correctly classified cases.
For f-measure, result achieved 80.1 accuracy after the removal of irrelevant attributes and 79.1 with attributes. 78.4
78.6 78.8 79 79.2 79.4 79.6 79.8 80 80.2 80.4
existing classification result proposed classification result
Accuracy
Precision
Recall
[image:8.612.116.498.130.333.2]The new experiment results prove the strong effect of attribute removal on learner behaviour on students’ academic achievement. We get more accurate results with different feature selection process with ensemble method.
V. CONCLUSION AND FUTURE WORK
This study represents analysis of how the use of data mining techniques on educational data can be proved a useful strategic tool for the administration of educational institutions addressing the very ambitious and problematic challenge of enhancing the quality of educational processes. Informed decisions can be made based on knowledge previously unknown and hidden inside the institutional resources. On this basis, decisions can be proved more accurate and correct for the benefit of all stakeholders involved in the educational setting. Furthermore, we presented the results of experiments conducted on educational data, as a first step of the application of data mining technology in the institution. The study results allow us to draw one important conclusion, indicating that the analysis of EDM techniques are sufficiently effective to early identify students’ academic failures, and then they are useful to provide educators or teachers with relevant information to help your decisions.
In future work relates to this research area could be utilizing the same dataset; it would be desirable to do more data mining tasks on it, as well as, apply more algorithms. As long as time being, it would be appealing to apply association rules mining to find out interesting rules in the students data. Similarly, clustering would be another data mining task that could be interesting to apply. Moreover, if the data was collected as part of the admission process of the university, that way, it would be easier to collect the data, as well as, the dataset would have been much larger, and the university could run these data mining tasks frequently on their students to find out interesting patterns and maybe improve their performance.
REFERENCES
[1] Krpan and S. Stankov, “Educational Data Mining for Grouping Students in E-learning System”, 34th International Conference on Information Technology Interfaces , 2012, 207-212.
[2] S. L. Prabha and A. R. Mohamed Shanavas, “ Application of Educational Data mining techniques in e-Learning- A Case Study”, International Journal of Computer Science and Information Technologies, Vol. 6 (5) , 2015, 4440-4443.
[3] L. Calvet Liñán and Á. Alejandro Juan Pérez, “Educational Data Mining and Learning Analytics: differences, similarities, and time evolution”, University and knowledge society journal revista University siciedad del conocimiento, 98-112.
[4] A. Satyanarayana and G. Ravichandran, “Mining Student data by Ensemble Classification and Clustering for Profiling and Prediction of Student Academic Performance”, ASEE Mid-Atlantic Section Conference 2016, 1-11.
[5] H. Mousal and A. Maghari, “School Students’ Performance Predication Using Data Mining Classification”, International Journal of Advanced Research in Computer and Communication Engineering, 2017, 136-141.
[6] B. Sachin and S. Vijay , “ A Survey and Future Vision of Data mining in Educational Field” Second International Conference on Advanced Computing & Communication Technologies, 2012, 96-100.
[7] S. Nikam, “A Comparative Study of Classification Techniques in Data Mining Algorithms”, Oriental journal of computer science & technology, Vol. 8, 2015, 13-19.
[8] A. Shahiri and W. Husain, “A Review on Predicting Student’s Performance Using Data Mining Techniques”, ELSEVIER, Volume 72, 2015, 414-422 [9] P. Thakar, “Performance Analysis and Prediction in Educational Data Mining: A Research Travelogue”, International Journal of Computer Applications,
Volume 110 – No. 15, 2015.
[10] T. C. Sharma and M. Jain, “WEKA Approach for Comparative Study of Classification Algorithm”, International Journal of Advanced Research in Computer and Communication Engineering, Vol. 2, Issue 4, 2013.
[11] V. Ramesh, “Predicting Student Performance: A Statistical and Data Mining Approach”, International Journal of Computer Applications, Volume 63– No.8, 2013.
[12] Ahmed and Elaraby, “Data Mining: A prediction for Student’s Performance Using Classification Method”, World Journal of Computer Application and Technology, vol.2, 2014, 43-47.
[13] Pandey and Pal “Data Mining: A prediction of performer or under performer using classification”, (IJCSIT) International Journal of Computer Science and Information Technologies, Vol. 2, 2011, 686-690.
[14] L.Arockiam et al., “Deriving Association between Urban and Rural Students Programming Skills”, International Journal on Computer Science and Engineering Vol. 02, No. 03, 2010, 687-690.