Texture Randomization of AZ31 Magnesium Alloy Sheets
for Improving the Cold Formability by a Combination
of Rolling and High-Temperature Annealing
Masahide Kohzu, Kenji Kii
*1, Yuki Nagata
*2, Hiroyuki Nishio
*3, Kenji Higashi and Hirofumi Inoue
Department of Materials Science, Graduate School of Engineering, Osaka Prefecture University, Sakai 599-8531, Japan To improve the cold formability of AZ31 magnesium alloy sheets, we investigate texture control by rolling and annealing. The texture ideal for forming close to random orientation was obtained by annealing at 773 K before and after isothermal rolling at 298–573 K. For the randomizing process, such a high temperature in pre-annealing was essential, whereas a slightly lower temperature was acceptable for final annealing, assuming a sufficiently long annealing time. The randomized sheet could be obtained in a wide range of rolling temperatures and reductions. It could also be produced easily with a standard mill without roll heating. The microstructure of the randomized sheet consisted of relatively homogeneous grains 25–30mmlarge on average. In a 90 degree V-bending test, a well randomized sheet could be bent without cracking with a minimum bending radius per thicknessR=t¼1:4, which was about half of that in commercial AZ31D-O sheets, in spite of manganese content of over 0.6%. [doi:10.2320/matertrans.L-M2010802]
(Received July 3, 2009; Accepted December 14, 2009; Published March 3, 2010)
Keywords: AZ31 magnesium alloy, texture randomization, isothermal rolling, high-temperature annealing, cold formability, V-bending
1. Introduction
Magnesium alloys with high specific strength are already being used extensively as structural materials for portable electronics. Potential application to transportation devices, especially to automotive parts, is now attracting attention with the goal of reducing CO2production.1)Most magnesium
alloy structures are produced by die-casting or thixomolding even for shell structures at present, although sheet forming via rolling had been expected to improve productivity and toughness early on. To replace magnesium casting or aluminum pressing with magnesium pressing, it is indispen-sable to lower the forming temperature preferably to room temperature.
Cold formability depends above all on texture.2,3) In a rolled sheet, a basal texture, in which {0001} planes are oriented parallel to the rolled surface, often forms and consequently seriously impairs cold formability. Rolling with additional shearing strain to tilt the basal planes has been tried in order to control the texture. However, it did not lead to a significant improvement of cold formability.4–6)
Some authors have reported that commercial AZ31 rolled sheets with a double-peak texture had excellent low-temper-ature formability,2) although the cold forming was hard. However, such a sheet was confined to a subset of narrow coiled strips. Thus, the process of texture evolution during rolling deformation was systematically investigated by isothermal eccentric roll drawing as simulation rolling.7) Double peak textures were obtained at 423–523 K with rolling reductions of 22% and above. About the cold formability, there has been a report on AZ31 sheets annealed at high temperature (773 K) being drawn with a drawing ratio of 1.75.8,9)
In this study, texture control for improving the cold formability of AZ31D magnesium alloy sheets has been investigated, via a combination of isothermal rolling and high-temperature annealing. We have also studied the change in the microstructure in each procedure. In addition, cold formability has been evaluated by a V-bending test. This study is based on the idea that annealing is indispensable for sheet forming and final textures are not determined by plastic processing only.
2. Experimental Procedure
Figure 1 shows the scheme of the eccentric-roll drawing7) (hereinafter called isothermal rolling), in which rolling reduction changes continuously, and the rolls can be heated uniformly in a furnace together with the specimen.
A commercial AZ31D-O rolled sheet 1.6 mm thick was used as a specimen after being cut into 20040mm2
rectangles along the rolling direction. Table 1 shows the chemical composition of the sheet. The specimens were processed first by pre-annealing, by isothermal rolling and then by final annealing under the conditions shown in Table 2. During the annealing, specimens were covered with aluminum foil to prevent oxidation. Annealing above 773 K
Test piece after drawing
Fracture by tension
Fig. 1 The scheme of eccentric-rolls drawing.
*1Graduate Student, Osaka Prefecture University, Present Address: SRI Sports Limited, Kobe 651-0072, Japan
*2Graduate Student, Osaka Prefecture University
*3Undergraduate Student, Osaka Prefecture University, Present Address: Graduate Student, Osaka University, Suita 565-0871, Japan
[image:1.595.313.540.639.768.2]was not tried to avoid ignition and self-weight deformation. Isothermal rolling was performed at 100 mm s1 using the
eccentric-roll drawing apparatus. Additionally, we carried out rolling with a standard mill without heating the rolls at the same rolling rate for specimens preheated at 523, 573, 623 and 673 K. The microstructures and {0001} pole figures of the rolled surfaces were examined at each stage of the process. The textures were analyzed by Schulz reflection method using a copper X-ray tube operating at 40 kV and 100 mA. The normalized scan tilt angle range was 075
degree around the normal of the rolled surface. The diffraction intensity was normalized to unity for magnesium powder. Specimens for microstructures observation were etched with acetic picral after buffing, and the average grain size was determined by the linear intercept method. The samples after rolling were taken from locations on the tapered specimen mainly corresponding to 4, 11, 22 and 32% reduction. The details of the experimental methods omitted here are identical to those in our previous paper.7)
Test pieces for 90 degree cold V-bending were made up into 20 (RD)120.9 mm3plates by cutting and grinding
from the thickness tapered samples following texture measurements. Punches with tip radii R shown in Table 3 were prepared, and a bending limit R=t was evaluated by a strict criterion as shown in Fig. 2. The test was conducted at 0.17 mm s1and was stopped when the bending load reached about five times its plateau level.
3. Results and Discussion
3.1 Discovery of texture randomizing phenomenon
The ‘‘texture randomization’’, in AZ31 was first discovered by annealing at 773 K for 1 h before and after isothermal rolling at 473 K. Later, it was found that the final annealing for 20 min was sufficient and preferable for texture random-ization. Requirements for texture randomization were inves-tigated around this processing condition hereinafter referred to as the ‘‘standard randomizing process’’.
A texture of as-received sheet is shown as a {0001} pole figure in Fig. 3 together with its RD (rolling direction) section and optical microstructure. The pole figure exhibits a typical basal texture, consisting of concentric rings strongly oriented toward its center (0 degree). The microstructure consists of equiaxial crystal grains about 12mm large on average.
3.2 Conditions for texture randomization
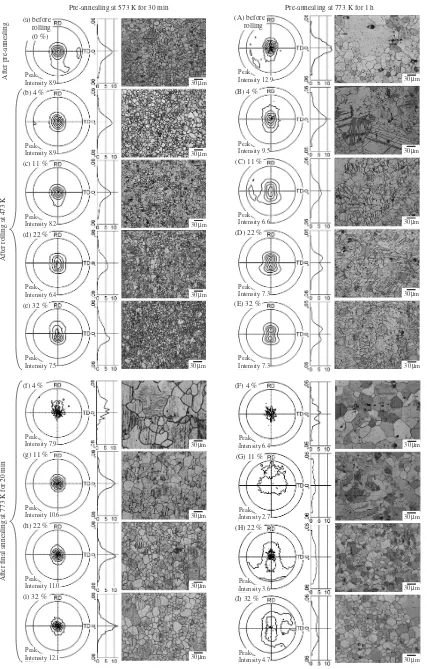
[image:2.595.314.538.95.273.2]Figure 4 shows changes in {0001} pole figures, their RD sections and optical microstructure by pre-annealing, iso-thermal rolling and final annealing. The left and the right columns correspond to pre-annealing at 573 K for 30 min and at 773 K for 1 h, respectively. In either column, rolling was performed at 473 K and final annealing—at 773 K for 20 min. The right column corresponds to the above-mentioned
Table 1 The chemical composition of the specimen. (mass%)
Al Zn Mn Si Cu Fe Ni Mg
[image:2.595.42.292.97.125.2]3.5 0.9 0.64 0.01 0.01 0.001 0.002 Bal.
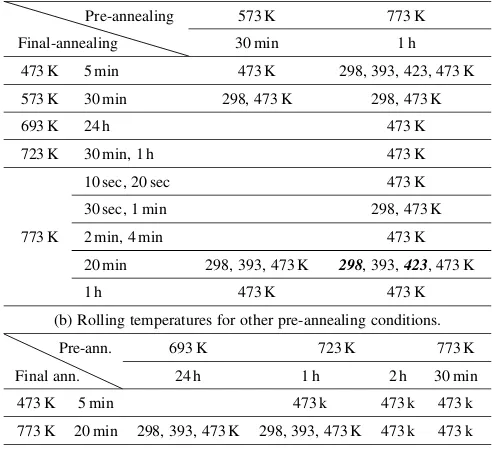
Table 2 The positive combinations of conditions in the texture controlling process.
(a) Rolling temperatures for focused pre-annealing conditions. Pre-annealing 573 K 773 K
Final-annealing 30 min 1 h
473 K 5 min 473 K 298, 393, 423, 473 K 573 K 30 min 298, 473 K 298, 473 K
693 K 24 h 473 K
723 K 30 min, 1 h 473 K
10 sec, 20 sec 473 K
30 sec, 1 min 298, 473 K
773 K 2 min, 4 min 473 K
20 min 298, 393, 473 K 298, 393,423, 473 K
1 h 473 K 473 K
(b) Rolling temperatures for other pre-annealing conditions.
Pre-ann. 693 K 723 K 773 K
Final ann. 24 h 1 h 2 h 30 min
473 K 5 min 473 k 473 k 473 k
773 K 20 min 298, 393, 473 K 298, 393, 473 K 473 k 473 k Standard rolling reductions for each rolling temperature: 298 K-4, 7%; 393 K-4, 11, 22%;>423K-4, 11, 22, 32%. Especially,298K-4, 7, 9, 11%;423K-4, 7, 11, 16, 22, 27, 32%.
Table 3 The tip-radii of punches and their ratios to sheet thickness,t=R, in V-bending (t¼0:9mm).
4.8 3.8 3.0 2.4 R /mm
2.2 1.9 1.7 1.4 1.1 t/R
5.3 4.2 3.3 2.7 t/R
2.0 1.7 1.5 1.3 1.0 R /mm
90°
R
14 t
12
R/t = 4.2 3.3 2.7 2.2
Fig. 2 An example of the success/failure criterion in V-bending ( : rough surface stopping short of cracking. In this case, the bending limit is evaluated asR=t¼4:2).
30µm Intensity 8.4
Peak
[image:2.595.45.291.185.410.2] [image:2.595.310.543.334.423.2]30µm
30µm
30µm
30µm
30µm Pre-annealing at 573 K for 30 min
After pre-annealing
After rolling at 473 K
Intensity 8.9 Peak
Intensity 7.5 Peak Intensity 6.4 Peak Intensity 8.2 Peak Intensity 8.9 Peak
(c) 11 % (a) before
rolling (0 %)
(b) 4 %
(e) 32 % (d) 22 %
30µm
30µm
30µm
30µm
After final annealing at 773 K for 20 min
Intensity 12.1 Peak Intensity 11.0 Peak Intensity 10.6 Peak Intensity 7.9 Peak
(g) 11 % (f) 4 %
(i) 32 % (h) 22 %
30µm
30µm
30µm
30µm
30µm Pre-annealing at 773 K for 1 h
Intensity 7.3 Peak Intensity 12.9 Peak
Intensity 7.3 Peak Intensity 6.6 Peak Intensity 9.5 Peak
(C) 11 % (A) before
rolling
(B) 4 %
(E) 32 % (D) 22 %
30µm
30µm
30µm 30µm Intensity 6.4
Peak
Intensity 4.7 Peak Intensity 3.6 Peak Intensity 2.7 Peak (G) 11 % (F) 4 %
(I) 32 % (H) 22 %
[image:3.595.88.515.72.741.2]‘‘standard randomizing process’’. Low-temperature pre-an-nealing at 573 K causes little change of texture and micro-structure, as shown in Fig. 4(a). However, high-temperature pre-annealing at 773 K produces a stronger basal texture and a coarse grain microstructure containing abnormally grown grains, as shown in Fig. 4(A). By rolling under high reduction, the texture formed by the high-temperature pre-annealing changed to a more pronounced double-peak texture, as shown in Fig. 4(D)–(E), than that formed by the low-temperature pre-annealing, as shown in Fig. 4(d)–(e).
For the low-temperature pre-annealed sheet, during rolling dynamic recrystallization progresses from the sites of deformation twins formed under low reduction. The twins disappear under high reduction, as shown in Fig. 4(b)–(e). For the high-temperature pre-annealed sheet, dynamic recrystallization does not occur during rolling, and deforma-tion twins are ever-increasing with an increase in reducdeforma-tion, as shown in Fig. 4(B)–(E). By the final high-temperature annealing, only samples rolled with medium reductions of 11–22% after high-temperature pre-annealing are random-ized with a significant reduction of peak intensity. For either pre-annealing condition, the final annealing produces a homogeneous grain structure of 25–30mm, as shown in Fig. 4(f)–(i) and (F)–(I) without mixing of abnormally grown grains as in Fig. 4(A).
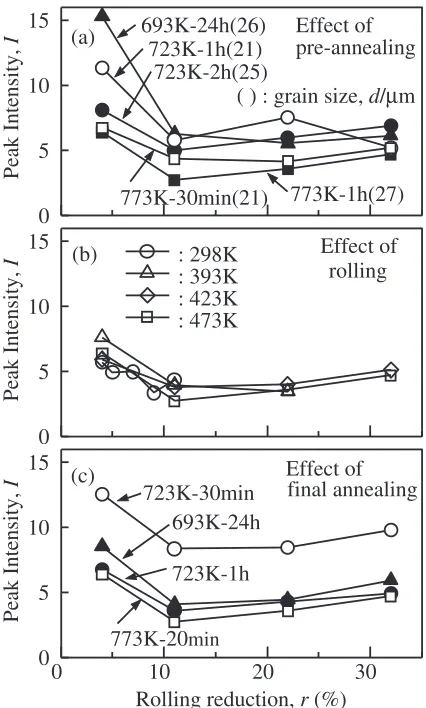
[image:4.595.321.534.70.424.2]Based on the standard randomizing process shown in the right column of Fig. 4, the pre-annealing, isothermal rolling and final annealing conditions are changed one by one. A degree of randomization after final annealing is shown in Fig. 5 as peak intensities of the pole figures, where the number in parentheses is the average grain size after pre-annealing (except abnormally grown grains). As shown in Fig. 5(a), pre-annealing up to 723 K does not lead to final texture randomization even if it is prolonged. Pre-annealing for 30 min is insufficient for final randomization even at 773 K. In addition, pre-annealing at 693 K for 24 h is adequate to dissolve tiny amounts of -phase (Mg17Al12)
precipitated at grain boundaries. Grain size after this pre-annealing was comparable to that at 773 K for 1 h, and was larger than that at 773 K for 30 min. However, the final peak intensity was higher than that in the case of pre-annealing at 773 K for either pre-annealing time. From this it follows that formation of a coarse grain structure does not always lead to a final texture randomization. As shown in Fig. 5(b), rolling temperature has little effect on the final peak intensity, which suggests that precise temperature control is not required during rolling. As shown in Fig. 5(c), final annealing as low as 693 or 723 K can reduce peak intensity to almost the level reached by annealing at 773 K for 20 min, but a lot more time is required at lower temperature. At 773 K, annealing times greater than 20 min do not improve the randomization. Figure 5(a)–(c) shows that final peak intensities are low at medium rolling reductions of 11–22%. It does not matter for randomization whether the rolling texture becomes double peak or not, since the threshold is between 11 and 22%.
The wide range of rolling conditions for final random-ization suggests the potential applicability of standard rolling to this process. Table 4 shows the effect of pre-heating temperature on final peak intensity in standard rolling, without roll heating. The rolling rate is 100 mm s1which is
the same as in the isothermal rolling. Rolling at pre-heating temperature between 523 and 573 K leads to low final peak intensities comparable to those of the standard randomizing process using isothermal rolling. However, excess pre-heating at 673 K creates a strong basal texture after final annealing, although dynamic recrystallization does not occur during rolling. A high-temperature annealed sheet has better low-temperature rollability than a normally annealed sheet.
3.3 Discussion of texture and microstructure
Figure 6 shows changes of texture and microstructure in the process for which pre-annealing in the standard random-izing process is replaced with 24 h at 693 K. This pre-annealing serves as a solution treatment as described above. In the pre-annealed state of Fig. 6(a), the texture, existence of
0
5
10
15
Peak Intensity,
I
693K-24h(26)
723K-1h(21)
723K-2h(25)
773K-1h(27)
773K-30min(21)
Effect of
pre-annealing
( ) : grain size,
d
/
µ
m
0
5
10
15
Peak Intensity,
I
: 298K
: 393K
: 423K
: 473K
rolling
0
10
20
30
0
5
10
15
Rolling reduction,
r
(%)
Peak Intensity,
I
693K-24h
723K-30min
723K-1h
773K-20
minEffect of
final annealing
Effect of
(a)
(b)
(c)
[image:4.595.306.549.524.579.2]Fig. 5 The effect of experimental conditions in each procedure on the final peak intensity (based on pre-annealing at 773 K for 1 h, rolling at 473 K and final annealing at 773 K for 20 min).
Table 4 The effect of pre-heating temperature and rolling reduction on final peak intensity in standard rolling without roll heating (pre-annealing at 773 K for 1 h and final annealing at 773 K for 20 min).
Temperature
523 K 573 K 623 K 673 K Reduction
17.5% 3.5 3.8 4.4 —
abnormally grown grains and average grain size of normally grown grains differ little from those in the state of Fig. 4(A) pre-annealed at 773 K for 1 h (which is sufficient for randomization). However, in Fig. 6(a), subsequent rolling causes dynamic recrystallization, shown in Fig. 6(b)–(c), and the final texture is a concentric ring (basal texture), as shown in Fig. 6(d)–(e). This transition is similar to pre-annealing at 573 K for 30 min shown in the left column of Fig. 4. but with lower peak intensities. Generally, in AZ31 magnesium alloys with coarse grains, twins play a major role in a plastic deformation. For rolling a sheet pre-annealed at or below 723 K, deformation twins disappear by being replaced with fine dynamically recrystallized grains.
In general, a larger strain is required for dynamic recrystallization at lower temperatures,10) so only rolling temperature was lowered to 398 K in the process shown in Fig. 6. The result is demonstrated in Fig. 7. In the micro-structure after rolling with 22%, many deformation twins are produced without dynamic recrystallization (see Fig. 7(a)). Although this microstructure is similar to that in the standard randomizing process (right column of Fig. 4), the final texture becomes a concentric ring (Fig. 7(b)) like those of
Fig. 6(d)–(e). The microstructures of Figs. 4(D) and 7(a) which contain many deformation twins are magnified and compared in Fig. 8. In both cases, thin and partially-crossed twins were mainly observed. The yet-unidentified type of the twins, may be mainly the twin off10112g h10111i, since these play a major role in plastic deformation with a limited number of slip systems.11,12)
Figure 9 shows the variation of the RD section of {0001} pole figure as a function of final annealing condition, where pre-annealing and rolling conditions are as in the standard randomizing process. Even for final annealing at 723 or 693 K, the texture may be randomized. Nevertheless, 773 K is highly favorable since there randomization progresses much faster than up to 723 K. We note that annealing longer than the 20 min in the standard randomizing process has no effect. The above-mentioned requirements for final texture randomization can be summarized as follows. (1) High-temperature pre-annealing at 773 K (1 h) is absolutely necessary. (2) High-temperature pre-annealing makes the grain-structure coarse and leads to a microstructure contain-ing many deformation twins without dynamic recrystalliza-tion in the subsequent rolling process. (3) Coarse grain structure and twinning which do not evolve into dynamic recrystallization are not sufficient. (4) The range of success-ful rolling conditions (temperature and rolling reduction) is wide, hence standard mill without heating the rolls should also be successful. (5) Although high-temperature final annealing at 773 K is not always necessary, it leads to a randomization much faster than up to 723 K.
3.4 Correlation between peak intensity and bendability
Although the excellent formability of a randomized sample was exhibited by 90 degree V-bending test, a statistical correlation between the V-bending limit and the peak intensity of a pole figure had not still been confirmed down to such a low intensity level, since such AZ31 rolling sheets do not exist. By using many samples obtained in search of satisfactory randomizing conditions, we can plot the correlation diagram as in Fig. 10. The test pieces were ground down to a thickness of 0.9 mm. The V-bending limit,
R=t, shows a good correlation as a whole with peak intensity, 30µm
30µm
30µm 30µm
30µm
Pre-annealing
for 24 h at 693 K
Rolling at 473 K
Final annealing at 773 K for 20 min
(b) 11 %
(c) 22 %
(d) 11 %
(e) 22 %
Intensity 5.5 Peak Intensity 6.3 Peak Intensity 7.6 Peak Intensity 11.0 Peak Intensity 12.6 Peak
(a) before rolling
Fig. 6 The {0001} pole figure, its RD-section and microstructure after pre-annealing at 693 K for 24 h, rolling at 473 K and final pre-annealing at 773 K for 20 min.
30µm
30µm Intensity 5.5
Peak Intensity 7.6 Peak
(a) Rolling with 22 %
(b) After Final annealing
[image:5.595.55.282.71.461.2] [image:5.595.315.536.71.233.2]I. The excellent bendability of R=t<2:0 is limited to the randomized samples of I<4:5. But in samples with higher intensity, the R=t distribution is wide because it is affected not only by peak intensity of the pole-figure but also by its pattern.
4. Conclusion
Texture randomization of magnesium alloy sheets was achieved with a standard commercial wrought alloy, AZ31, within the standard rolling process without the use of special apparatus or technique. In this process, high-temperature annealing at 773 K before and after the final rolling pass significantly weakens the basal orientation of rolling sheet.
This results in considerably improved cold-formability. The allowed range of rolling conditions is wide, therefore industrial mass production is possible given demand. How-ever, the mechanism of this transition is still poorly under-stood and many questions remain to be answered. In the future, multiple verification of formability in view of the final practical application is required, in parallel with the exhaustive analysis of the mechanism.
Acknowledgments
We express our deepest appreciation to Professor Mototsugu Katsuta of Nihon University and Mitsubishi Aluminum Co., Ltd. for their research cooperation.
11 %
22 %
As rolled
30 min
573 K
693 K
24 h
30 min
723 K
723 K
1 h
773 K
30 s
773 K
1 min
Fig. 9 The variation in the RD-section of {0001} pole figure due to the final annealing (rolling at 473 K after pre-annealing at 773 K for 1 h).
10
µ
m
10
µ
m
(a) Magnified microstructure
of Fig. 4 (D)
(b) Magnified microstructure
of Fig. 7 (a)
[image:6.595.115.482.73.253.2] [image:6.595.122.477.309.570.2]REFERENCES
1) M. Easton, A. Beer, M. Barnett, C. Davies, G. Dunlop, Y. Durandet, S. Blacket, T. Hilditch and P. Beggs: JOM60(2008) 57–62.
2) M. Kohzu, T. Hironaka, S. Nakatsuka, N. Saito, F. Yoshida, T. Naka, H. Okahara and K. Higashi: Mater. Trans.48(2007) 764–768. 3) T. Al-Samman and G. Gottstein: Mater. Sci. Eng. A488(2008) 406–
414.
4) Y. Chino, M. Mabuchi, R. Kishihara, H. Hosokawa, Y. Yamada, C. Wen, K. Shinojima and H. Iwasaki: Mater. Trans.43(2002) 2554– 2560.
5) Y. Chino, H. Iwasaki and M. Mabuchi: Mater. Sci. Eng. A466(2007)
90–95.
6) Y. Chino, K. Sassa and M. Mabuchi: J. Mater. Sci.44(2008) 1821– 1827.
7) M. Kohzu, S. Nakatsuka and K. Higashi: Mater. Trans. 49(2008) 2096–2099.
8) K. Mori and H. Tsuji: CIRP Annals-manufacturing Technology 56
(2007) 285–288.
9) L. F. Yang, K. Mori and H. Tsuji: Trans. Nonferrous Metals Soc. China
18(2008) 86–91.
10) O. Sitdikov and R. Kaibyshev: Mater. Trans.42(2001) 1928–1937. 11) A. Jain and S. R. Agnew: Mater. Sci. Eng. A462(2007) 29–36. 12) J. Koike and T. Miyamura: J. JILM54(2004) 460–464.
2
3
4
5 6 7 8 910
1.0
1.5
2.0
2.5
3.0
3.5
4.0
4.5
Peak intensity,
I
V
-bending limit,
R
/
t
30 573 200
30 573
60, 20 773
200 30
573
20 773 200
120, 60 723
30 573 25
60 773
30 573 200
60 773
60, 30 723
200 60
773
20 773 25
60 773
20 773 150, 120 60
773
60, 20 773
200 60
773
tFA /min
TFA /K
TR /K
tPA/min
TPA /K
Final annealing Rolling
[image:7.595.115.485.75.271.2]Pre-annealing