1
Forecasting energy consumption using ensemble ARIMA-ANFIS hybrid algorithm
Sasan Barak*1, S.Saeedeh Sadegh2
1. Faculty of Economics, Technical University of Ostrava, Ostrava, Czech Republic 2. Department of Industrial Engineering, Tarbiat Modares University, Tehran, Iran
A
BSTRACTEnergy consumption is on the rise in developing economies. In order to improve present and
future energy supplies, forecasting energy demands is essential. However, lack of accurate
and comprehensive data set to predict the future demand is one of big problems in these
countries. Therefore, using ensemble hybrid forecasting models which can deal with shortage
of data set could be a suitable solution. In this paper, the annual energy consumption in Iran
is forecasted using 3 patterns of ARIMA-ANFIS model. In the first pattern, ARIMA (Auto
Regressive Integrated Moving Average) model is implemented on 4 input features, where its
nonlinear residuals are forecasted by 6 different ANFIS (Adaptive Neuro Fuzzy Inference
System) structure including grid partitioning, sub clustering, and fuzzy c means clustering
(each with 2 training algorithms). In the second pattern, the forecasting of ARIMA in
addition to 4 input features are assumed as input variables for ANFIS prediction. Therefore,
four mentioned inputs beside ARIMA's output are used in energy prediction with 6 different
ANFIS structures. In the third pattern, due to dealing with data insufficiency, the second
pattern is applied with AdaBoost (Adaptive Boosting) data diversification model and a novel
ensemble methodology is presented.
The results indicate that proposed hybrid patterns improve the accuracy of single ARIMA
and ANFIS models in forecasting energy consumption, though third pattern, used
diversification model, acts better than others and model's MSE criterion was decreased to
0.026% from 0.058% of second hybrid pattern. Finally, a comprehensive comparison
between other hybrid prediction models is done.
Key words: Energy forecasting; ARIMA; ANFIS; AdaBoost; Ensemble algorithm
2
1.
Introduction
Energy is vital important for development of every country from the social, economic and
environmental perspective. It has magnificent effect on industrial and agricultural products,
health, sanitary, population, education and human life quality [1].
As energy is a crucial input to industrial part of country, energy demand increases along the
industrial function increase. Rapid changes in industry and economy strongly affect energy
consumption. Therefore, energy consumption is an important economical index that
represents economic development of a city or a country [2]. According to the international
energy agent report, there should be many transformations in amount and type of future
energy consumption (year 2030). As over the past decade global energy consumption has
increased rapidly because of population and economic growth [3, 4]. According to wide
growth of energy consumption in the last decade, energy demand management is very
important for achieving economic success, environment preservation and suitable planning
for existing resources that result in self-sufficiency and economic development. Therefore,
various techniques have been used for energy demand management to forecast future energy
demands accurately [4]. However, energy forecasting is difficult, because it is affected by
rapid development of economy, technology, government decisions and other factors [5]. As
far as energy prediction is concerned, especially in developing countries like Iran, lack of
data are a critical problem in forecasting. Moreover, missing values and lack of a standard
and precise system for data collection raised other issues in such countries [6]. This study
proposes a diversified hybrid ARIMA (Auto Regressive Integrated Moving Average)-ANFIS
(Adaptive Neuro Fuzzy Inference System) model to deal with such problems in energy
consumption.
The contribution of the paper is summarized as follow:
Developing a hybrid ARIMA-ANFIS algorithm based on three different patterns
Using diversification method to deal with data insufficiency
Finally, comparing all patterns with different prediction models
This paper is organized as follows. A comprehensive literature for energy forecasting models
such as ARIMA, fuzzy and ANFIS models as well as Ensemble models are reviewed in the
second section. In the third section details of ARIMA, ANFIS and AdaBoost (Adaptive
3
the fourth section. In the fifth section, the proposed models have been evaluated using energy
consumption data from Iran. Finally, conclusions are given in the last section.
2.
Literature review
Increasing global energy demand requires intelligent forecasting algorithms and models.
Suganthi and Samuel [4] have surveyed many different models in the field of energy
forecasting and introduced two types of models including: 1- Traditional forecasting models
such as: time series, regression, econometrics models, and ARIMA, 2- Soft computing
models such as: fuzzy logic, genetic algorithm, neural network, support vector regression
models for forecasting national and regional energy demand.
Time series models are the simplest models for trend analysis in energy forecasting. Some
time series approaches like traditional statistical models including: moving average,
exponential smoothing and ARIMA are linear forecasting methods [7].
ARIMA model is one of the most popular time series models and has been broadly used [4,
7]. Pappas, Ekonomou [8] proposed ARIMA model for forecasting Greek electricity
consumption and compared the proposed model with three analytical time-series models.
Results showed that ARIMA model is more efficient than the other time-series models.
From the other point of view, statistical forecasting methods usually require normal data,
while large data sets are trendy or seasonal data pattern are often inadequate or noisy [2, 9,
10]. ARIMA models are linear but real time series rarely has linear structure.
Energy demand is forecasted based on economic and economic indexes. The
non-linearity of these indexes and energy demand have led to a search in the field of artificial
intelligence approaches such as neural network and fuzzy models [11]. These methods are
used because of high flexibility and power of forecasting, estimating and overcoming with
noisy data [12].
Pao [13] forecasted Taiwan energy consumption by neural networks and linear models.
Neural network has functioned better than the linear models.
But depending on situation, accuracy of ANN methods decrease because of several reasons.
Forecasting accuracy of ANN depends on learning data set and their adequacy. Moreover
ANN methods sometimes get stuck in local minimum, so choosing proper data set, is too
critical in neural network models and these models get good results only when the number of
4
Fuzzy models have good results in varying situations with inadequate data. Recently, fuzzy
logic has been widely used to deal with high level of uncertainty issues [15, 16]. Accuracy of
energy forecasting is usually impressed by data uncertainty and interdependency between
model's variables. These relations are eliminated by classification of fuzzy model [17].
Mamlook, Badran [18] forecasted short term electricity consumption of Jordan by fuzzy
model and found that fuzzy model performed much better than the usual statistical
forecasting models.
Yet, probabilistic consumption pattern cannot be correctly forecasted just by fuzzy based or
time- series models. Azadeh, Asadzadeh [6] proposed fuzzy-regression hybrid model to
improve estimation and forecasting of energy consumption, with use of small set of
(inadequate) data, population and GDP as inputs. They used annual data from Iran and some
other countries from 1995 to 2005 and the results showed the superiority of proposed hybrid
model compared to single models. The application of fuzzy models in energy is reviewed by
[19]. The review indicates that fuzzy based models in energy field provide realistic estimates.
2.1. ANFIS
ANFIS (Adaptive Neuro Fuzzy Inference System) model is one of the most popular artificial
intelligent models that have got advantages of both neural network and fuzzy model. The first
application of ANFIS in time-series prediction is the Jang's work [20]. In ANFIS, the
relations between variables are shown by fuzzy If-Then rules. Therefore it can interpret the
obtained results, which is not possible with the structures such as neural network [21]. It is
also one of the best models in estimation function among other neuro-fuzzy models[22].
Ying and Pan [23] applied ANFIS model to forecast annual regional electricity load in
Taiwan with data of years from 1981 to 2000. According to MAPE criteria and statistical
results, ANFIS model was found to perform better than regression, neural network, support
vector machines, genetic model and fuzzy hybrid systems. Efendigil, Önüt [10] compared
neural network and ANFIS model for forecasting demand with incomplete data. Results
showed that ANFIS could be used in demand forecasting with limited data. Akdemir and
Çetinkaya [24] proposed an ANFIS model to forecast the annual energy demand in Turkey
with use of population, income level, peak load and energy demand data for 27 years. In spite
of small number of data, good results were obtained. Al-Ghandoor, Samhouri [25] forecasted
energy demand in Jordan's transportation, with the use of two models: ANFIS and quadratic
exponential smoothing. Annual data from 1985 to 2009 were used to forecast energy demand
5
demand forecasting. Thus, most of the results showed that ANFIS had good results in energy
demand modeling and forecasting.
2.2. ARIMA-ANFIS
Recently, hybrid ANFIS models have been successfully used. Azadeh, Saberi [26] proposed a
hybrid ANFIS model for forecasting monthly electricity demand in Iran and yielded good
results compared to time series model, genetic algorithm and neural network. Li, Su [27]
compared neural network and genetic- ANFIS hybrid model to forecast daily energy demand
of a hotel. Results showed good performance of hybrid model, though hybrid model was
complicated. Li and Hu [28] proposed an ARIMA-fuzzy system model for time series
forecasting. First, a Sugeno fuzzy model was applied on input-output data to produce fuzzy
rules. Then, ARIMA model was embedded in answer part of fuzzy rules and obtained good
results. Babu and Reddy [29] proposed a hybrid model of ARIMA and ANN based on
moving-average filter model. Then, using a simulated data set and experimental data sets
such as sunspot data, electricity price data, and stock market data, the proposed hybrid
ARIMA–ANN model was applied along with individual ARIMA and ANN models and some
existing hybrid ARIMA–ANN models. Table 1 shows some features and results of the
explained studies:
**Insert Table 1 Here: Review of hybrid energy forecasting implementations **
[30] [31] [32] [33] [34] [35] [36] [37] [38] [39] [40]
As can be seen from Table 1, the performance of hybrid ANFIS model in energy forecasting,
is so brilliant especially in lack of data and varying situations and more precise results have
been achieved after hybridization with other models. Also, using ensemble model as a new
concept has improved the result of energy forecasting [40].
2.3. Ensemble models:
Recently, studies in machine learning have shown the prediction with a series or ensemble of
models is better than a single model and practice of one model improves by hits of other
models. An ensemble methodology uses advantages of some predictive models to achieve
better results. Ensemble method has two kinds of learning approach: learning without
interaction between the learning agents (ensemble learning) and learning with interaction
during the learning step (co-learning)[41].
In another point of view, ensemble models classified based on data diversification. Some
algorithms of this classification are: K- fold cross validation, Bagging, Boosting, and
6
In K-fold cross validation method, training and validation data sets are divided to K equal
parts. One part is considered as validation data and K-1 other parts are considered as training
data. This is done in K times and each time one new part is considered as validation data and
others as training set [42]. Boosting and Bagging methods combine weak models and
provide better prediction models. Bagging is appropriate for improving tree algorithms while
Boosting can be used for many algorithms such as additive models with high-dimensional
predictors [43].
Adaptive Boosting (AdaBoost) proposed by Freund and Schapire [44] is an effective
ensemble method that enjoys weighted average method for combination of learning
algorithms.
Recently, AdaBoost has been successfully used in many fields of study, few of them are:
cost-sensitive classification, semi supervised learning, tracking and network intrusion
detection [45, 46]. Assaad, Boné [47] predicted future values of time series using neural
networks as base learners and AdaBoost ensemble method. Alfaro, García [48] compared the
results of AdaBoost and neural network techniques in the field of forecasting by about thirty
percent decrease in generalization error, and deduced the priority of AdaBoost method
results. Heo and Yang [49] used AdaBoost in bankruptcy forecasting and achieved
remarkable results. Taking a step forward, we develop a novel combination of AdaBoost
methodology with hybrid ARIMA-ANFIS model to improve the forecasting result of energy
consumption prediction.
3.
The background
3.1. ARIMA modelAn ARIMA model [ARMA (p, q)] for x time series that includes n instances is predefined as
[50]:
1 1
p q
T
k i k i j k j k k k
i j
x A x B v v E v v R
(1)where the m-dimensional vector vkis uncorrelated random noise, not necessarily Gaussian,
with zero-mean and covariance matrix R, θ = (p, q) is the order of the predictor and A1,. . ., Ap
and B1,. . ., Bq are the m×m coefficient matrices of the multivariate (MV) ARMA model [50].
ARIMA model has three components: 1- auto regressive (AR), 2-integrated average (IA)
7
identification, 2- parameter estimation, 3- model recognition, 4- model verification and
forecasting [28].
In ARIMA (p,d,q), p expresses the number of autoregressive terms, q is the number of
lagged forecast errors and d is the number of non-seasonal differences. Random errors (vk)
are assumed to be independent, and to have identical distribution with a constant variance.
Based on Box and Jenkins method, when the numbers of series are less than 240, maximum
number of lag is equal to the number of observations divided by four [51]. To apply ARIMA
model, autocorrelation (ACF) and partial autocorrelation (PACF) functions should be
determined. Order of the AR and MA parameters can be determined using the partial
autocorrelation graph and the autocorrelation graph of data. Descriptions of steps for creating
ARIMA model are as follow:
Model identification: As stationary is essential in ARIMA forecasting model, data should be
often stationary. Differencing is usually applied to data to remove trend of data and stabilize
the variance [28]. By this way, d parameter is determined. According to PACF and ACF
figures, time series and probabilistic models' stationary can be determined.
Parameter estimation: One of probabilistic models is made and model's parameters are
estimated, in order to minimize Akaike's Information Criterion (AICC) [52] and Schwarz's
Bayesian Information Criterion (BIC) [12, 28, 50].
Diagnostic checking: In this step, the model's accuracy and the model's error stationary are
checked [28]. The best model is chosen according to some forecasting error criteria such as
root mean square error (RMSE) and mean absolute error (MAE). In Figure 1, the process of
choosing the best ARIMA model is shown:
**Insert Figure 1 Here: Pattern of ARIMA model **
3.2. ANFIS
Takagi-Sugeni-Kang is a fuzzy system with crisp functions that is suitable for complex
problems. TSK systems are usually used in the shape of a neuro fuzzy system that is called
ANFIS. ANFIS is a fuzzy inference system that can be trained by a set of input and output
data.
**Insert Figure 2 Here: ANFIS structure**
The ANFIS structure shown in Figure 2 is a five layer network. The first layer executes a
fuzzification process, the second layer executes the fuzzy AND of the antecedent part of the
fuzzy rules, the third layer normalizes the membership functions, the fourth layer executes
8
system by summing up the outputs of the four layers. The feed forward equations of the
ANFIS structure with two inputs and two labels for each input shown in Figure 2 are as
follows according to 3 type rules:
1, 2W x x i
i A B
i i
(2)
1 2
, 1, 2
i i w w i w w
(3)
1 1 1 1 1 1 2 2
1 1 2 2
2 2 2 2 1 2
f p x q y r z w f w f
f w f w f
f p x q y r z w w
(4)
where x and y are inputs to node i, Ai and Bi are linguistic labels for inputs, and wi is the
output of layer 3 and { , , }p q ri i i is the parameter set.
There are 3 kinds of function for fuzzy system creation: Genfis1, Genfis2, Genfis3.
Genfis1 makes fuzzy inference system structure by grid partitioning. It makes FIS structure
based on constant numbers of membership functions, uses clustered information models the
data behavior, in the best way and with the least number of functions. It clusters its rules
based on fuzzy quality of data sets [53].
Genfis2 makes the structure of FIS by subtractive clustering. This method makes a model of
data by clustering and a cluster radius should be determined for it. Radius specifies the
confinement (limitation) of cluster impact [1, 53].
Genfis3 makes the FIS structure by fuzzy clustering with use of C-mean (FCM). FCM begins
to work with an initial guess for cluster center. In addition, FCM function assigns a
membership degree to each data point and guides data centers to their correct place in data set
via updating centers and membership degrees of each data point repeatedly. This method is
done with minimizing a goal function that represents the distance of each data point to data
center that has been weighted by membership degree of the data point (Eq. 5).
2
1 1
, 1
N C
m
m ij i j
i j
J U X C m
(5)where m is a real number greater than 1 and each of Uij, Xi and Cj shows the degree of
membership of Xi in the j-th cluster, the i-th p-dimensional data and the p-dimensional center
of the cluster respectively, and ||*|| is any norm that shows the similarity between each
measured data and the center. With iterative optimization of the above objective function,
9 1 2 1 1 1 1 , N m ij i i
ij j N
m m
C ij
i j
i
k i j
U X U C U X X X C
(6)when
( 1) ( )
,
maxi j UijK UijK
is satisfied, iteration will stop, where ɛ is a number between
0 and 1, and k is the step's number of iteration [1, 53].
3.3. AdaBoost
Ensemble methods are broadly used for classification and regression and their ability has
been shown in a wide range of tasks, theoretically and empirically[47].
Boosting uses a series of classifier to learn the model. In each iteration one classifier (𝑚𝑖) is
learned and new weights are assigned to data in order to next classifier "pay more attention"
to tuples that has been classified wrong. Weight of each classifier’s vote is counted according
to its accuracy. Finally, votes of classifiers are combined to make the best classifier (𝑚∗)
[54].
In AdaBoost as the most popular Boosting algorithm, a series of models are combined and
data set are resampled in each model. In this method data are weighted according to their
difficulty to be learned [45].
4.
The proposed model
Both ARIMA and ANFIS models have good performance in linear and nonlinear structures
but none of them is comprehensive to be able to forecast various time series structures.
Studies show that using dissimilar models improves time series forecasting where data
pattern is varying and unstable [7, 19]. The use of ARIMA and soft computing techniques
improves precision of energy demand forecasting [4].
Zhang [7] proposed a capable hybrid model that consists of two steps: Step 1 is applying
linear model and step 2 is applying non-linear model using linear model’s residuals. Finally,
both models’ forecasting results are summed.
yt lt nt (7)
t t t
10
According to (7), it is supposed that data structure (yt) contains two parts: Linear part (lt)
and nonlinear part (nt). First, data are forecasted by linear model and have been checked to
see if residuals ( )et have nonlinear pattern. Then, the residuals have been forecasted by a
nonlinear model. The model’s final forecasting is attained from sum of linear and nonlinear
model results. In equation 8, et is nonlinear residual that is yielded by subtracting actual
quantity to linear forecasted quantity.
Extending the previous researches, in our paper, 3 patterns for time series prediction are
presented. In the first pattern, data are forecasted by ARIMA model, then its residuals are
forecasted with ANFIS model and finally forecasting is attained from sum of ARIMA and
ANFIS model.
In the second pattern, the forecasting of ARIMA is used as an input feature to ANFIS model.
In other words, the forecasting of ARIMA in addition to other input features are used in
ANFIS prediction. Therefore, ARIMA’s output as one of ANFIS inputs, can improve ANFIS
model’s performance. In the third pattern, because of the lack of data, the second pattern is
applied with AdaBoost model.
Two training algorithms including back propagation (BP) and least square gradient descent
back propagation (Hybrid BP) are implemented in ANFIS model to train parameters of
membership functions. Hybrid algorithms for TSK-type of fuzzy logic systems are provided
in various studies [55] which is a combination of least square and gradient descent back
propagation.
Since ANFIS prediction in this study is examined with 3 kinds of Genfis functions (Grid
partitioning, Sub clustering, FCM) with 2 training algorithms, we calculate 6 kinds of ANFIS
structures.
Modeling steps are described as follows:
A. By choosing proper quantity for alpha and beta in equation 9, all data are normalized
in [ , ] interval.
min norm
max min
x x
x α β ( )
x x
(9)
B. According to pattern and situation of model’s residuals, and stationarity or
non-stationarity, ARIMA parameters including: AR, MA and d are identified and ARIMA
model is applied. Linear parts of data are forecasted and model’s error is attained by
11
t t
t
e y l (10)
where 𝑦𝑡 is actual quantity and 𝑙𝑡 is linear part.
**Insert Figure 3 Here: Proposed hybrid ARIMA-ANFIS model **
In the first proposed pattern, steps are as follows (see the right side of Figure 3):
1.1. Since residuals of ARIMA have nonlinear structures, ANFIS model is used to
forecast ARIMA residuals. So residuals are divided into train and test sets, then 6
different ANFIS models are trained and tested. Error reduction is used as criteria
for choosing proper model. The formula for this model is shown in equation 11:
)11( 1 1 2 2 1 2
1 1
/ ( )
p q
k k k i k i j k j
i j
w w w w
y l n a l b v f f
Equation 11 considers both linear and nonlinear forecasting parts in forecasting
and illustrates final forecasting values by sum of ARIMA and ANFIS results.
Model's error is computed by mean square error (MSE) criteria:
2 1 1 ( ) n c m i i i
M E q
n
S q
(12)where qic is forecasted value, qim is real value, and n is the number of data.
MSE is used as criteria for choosing proper model.
1.2. After obtaining the results of 6 ANFIS models, outputs are post processed, returned
to initial scale and presented as hybrid model's results.
In the second pattern, steps "a" and "b" are similar to the first pattern model (see the left side
of Figure 3). Steps 2-1 to 2-3 are as follow:
2.1. The ARIMA model's prediction is used as one of ANFIS inputs. Therefore, linear
forecasting results are added to other ANFIS inputs and energy consumption is used
as model's output. For example, where ARIMA output ( )lt and the other inputs (m)
are considered as ANFIS inputs the model's formula can be expressed as follow:
1 1 2 2
1 1 2 2
t t 1 t 1
1 1 2
1 t t 2 2
2
2 1
t 2
t t t
μ ( ) μ ( ) ( r ) μ ( ) μ
/ ( )
( ) ( r )
μ μ μ μ ( )
a b a b t
a b a b
l l
f
p l q m l l
w f w f w w
p l q m
l l l l
(13)
12
2.2. In this step, data is divided into train and test sets, then data are analyzed with 6
structures of ANFIS models. The best hybrid model is specified with respect to test
criteria and used for forecasting energy consumption.
2.3. After obtaining ANFIS results, outputs are post processed, returned to initial scale
and presented as hybrid model's results.
As far as energy prediction is concerned, especially in developing countries like Iran, lack of
data are a big problem in forecasting. Therefore, in the third pattern, for improving testing
accuracy of model and encountering with lack of data AdaBoost method is applied to
increase data variation. In the last pattern of this study, AdaBoost method was implemented
based on figure 4.
**Insert Figure 4 Here: AdaBoost method**
The mathematical model of presented AdaBoost is as follows:
Input: Initial training set composed of n examples, denoted as
𝑠𝑛={(𝑥1, 𝑦1), (𝑥2, 𝑦2), …,( 𝑥𝑛, 𝑦𝑛)}
Initialize: 𝑤1𝑖= 1/n, i.e. 𝑤1= {𝑤11, 𝑤12, …, 𝑤1𝑛} = { 1/n, 1/n, … , 1/n}
for t=1, 2, …, T
1. Take 𝑅𝑡 samples randomly from 𝑆𝑛 using distribution 𝑤𝑡
2. Build a classifier 𝑓𝑡 using 𝑅𝑡 as the training set
3. Compute: Et= MSE of 𝑓𝑡 and αt= 0.5 ln (1−Et
Et )
4. Update the weight: wt+1i = normalize (w
ti * exp (-αt))
Output: The ensemble prediction: F = ∑ 𝑓𝑡
𝑇 𝑡=1
𝑇 and whole Error = ∑𝑇𝑡=1𝐸𝑡
𝑇
where 𝑠𝑛={(𝑥1, 𝑦1), (𝑥2, 𝑦2), …,( 𝑥𝑛, 𝑦𝑛)} represents the set of training samples, T is the
number of iteration, 𝑤𝑡={𝑤𝑡1, 𝑤𝑡2, …, 𝑤𝑡𝑛} shows weight distribution over sample set that is
1/n in the first iteration and it will be updated in each iteration. Weights for hard samples
which classified wrong classifier (𝑓𝑡) will increase in the next iteration. 𝐸𝑡 represents MSE of
𝑓𝑡.
C. Finally, results of 3 patterns have been compared and the best pattern has been
13
5.
Application and results
5.1. Data set and experiments
According to estimations, industrial energy consumption in developing countries is about
45% to 50% of total commercial energy consumption [4]. Iran requires broadly investment in
energy field, having respectively second and fifth rate in gas and oil reservoirs in the world
[56]. On the other hand, in developing countries like Iran, lack of data is a problem in
forecasting [6]. Because of this, it seems essential to achieve a proper and accurate model for
forecasting future energy consumption in Iran. Therefore, the proposed ensemble based
ARIMA-ANFIS hybrid models were used in forecasting.
It is clear from the related literature [57-59] that usually 4 independent variables, including:
population, gross domestic production, import and export, are used as inputs to the models in
energy consumption forecasting. It seems that these four factors have the most impact on
energy consumption in every country. Thus, in this study, annual energy consumption,
population, GDP, export and import data from 1967 to 2012, were used for modeling energy
consumption. Data were collected from statistics center of Iran. Initial data were normalized
according to equation 9 to become stationary. In this study, alpha and beta values are zero
and one, respectively. In the next section, various models introduced in previous sections are
implemented and results are analyzed.
5.2. ARIMA
In this section, ARIMA model is identified for forecasting Iran energy consumption and
details of ARIMA model implementation is expressed. Results of ARIMA model are
achieved using Eviews software.
Identification step: Ascending pattern is seen in correlation figure of data that shows
non-stationary of data (Figure 5).
**Insert Figure 5 Here: Auto correlation and partial auto correlation in data before lagging**
Therefore with making one difference on data, 1 was assigned to d parameter.
Pattern estimation step: According to data correlation with 1 lag, 1 and 2 are considered as
estimated values for AR parameter and 1, 2, 3 are calculated as estimated values for MA
parameter. So various models are compared and two best models are: [1, 1, 2] and [2, 1, 1].
Model recognition: Model`s equations are written considering determined characteristics and
models are compared according to the Akaike [52] and Schwarz (BIC) criterions. AIC and
BIC criterions for models are compared in table 2, and [1, 1, 2] model with AR=1 and MA=2
14
**Insert Table 2 Here: AIC and BIC criterions comparison **
Model verification: Residuals` figure is examined and if it is stationary, model recognition is
correct. Results show the auto and partial autocorrelations for residuals of [1, 1, 2] and [2, 1,
1] models are stationary, however, [1, 1, 2] model’s residuals have less and smoother
correlation and auto correlation and it has better performance (see Figure 6).
**Insert Figures 6 Here: Autocorrelation and partial autocorrelation for residuals of [1, 1, 2] **
**Insert Table 3 Here: Error criteria results of sample ARIMA model **
Forecasting step: [1, 1, 2] model is chosen for forecasting because of its low RMSE and MAE
criterions (See Table 3).
5.3. ARIMA-ANFIS patterns
In this section, three different ARIMA-ANFIS hybrid patterns are employed according to the
mentioned methods.
In the first pattern, after forecasting energy consumption with ARIMA (step B), its errors
which is difference between actual and forecasted consumptions are calculated and forecasted
using population, GDP, import, and export as inputs. Errors have nonlinear pattern as can see
in figure 7. Then, combination of ARIMA model and proper nonlinear ANFIS model is
implemented.
**Insert Figure 7 Here: ARIMA model forecasting residuals figure **
Data were divided into train and test sets. 70% of data is used as train and 30% as test set and
MSE criterion is used to examine model's efficiency. Six different ANFIS structure models
have been made by combining 2 optimization algorithms (BP and hybrid BP) and 3 ANFIS
types, as mentioned in section 4. Table 4 contains MSE results for various ANFIS models in
test period.
**Insert Figure 8 here: Outputs and errors of the best hybrid pattern 1 **
**Insert Table 4 Here: MSE results of hybrid pattern1**
It is clear from the table 4 that sub clustering ANFIS structure with hybrid BP optimization
method has the least test error. Train and test result of the best hybrid pattern 1 is shown in
figure 8. As can be seen from figure 8, learning errors are concurrent around zero and close to
normal graph. Testing errors are also close to zero.
At second pattern after ARIMA model implementation, ARIMA output that expresses linear
forecasting part of time series is used as one of the ANFIS inputs (step 2-1). Because ARIMA
is very effective for forecasting linear part of data, using ARIMA results in ANFIS improves
15
and export and the other input which is ARIMA forecasting result. With examining different
data divisions, using 80% of data for training and 20% for testing obtained the best results in
this sample (step 2-2). In Table 5, MSE criterion results of various ANFIS structure for
second hybrid pattern (hybrid pattern 2) are calculated.
**Insert Table 5 Here: MSE results of hybrid pattern 2**
Base on table 5, FCM ANFIS structure with BP training algorithm has the least test error. As
shown in Figure 9, FCM type of ANFIS with BP has training errors around zero and close to
normal graph. Testing errors are also close to zero that is another reason for efficiency of the
model in forecasting energy consumption.
**Insert Figures 9 here: Outputs and errors of the best hybrid pattern 2 **
Fuzzy rules that are obtained from ANFIS model of hybrid pattern 2 are shown in Table 6.
Here, in1 to in5 are the model inputs which are 1.the ARIMA output, 2.population, 3.GDP,
4.import, and 5.export. Out1 is energy consumption that is output of model. As can be seen,
the number of rules is decreased regarding to hybrid pattern which shows stationarity of the
model and less over training and over fitting. According to the [60], the dense structure of
models bring about a low level of over fitting and cause a robust prediction.
**Insert Table 6 Here: Fuzzy rules obtained from hybrid pattern 2**
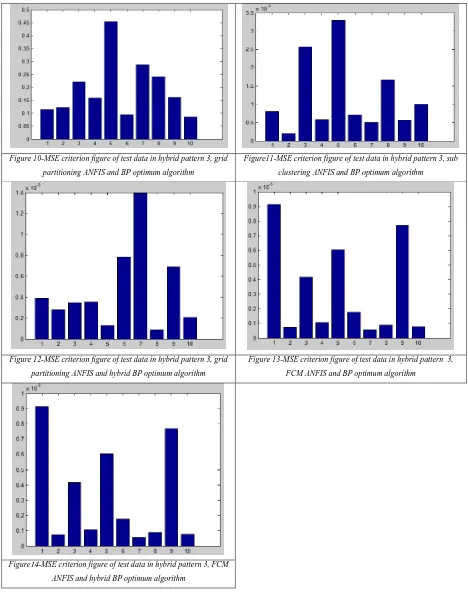
At the third hybrid pattern, AdaBoost method is mixed with hybrid pattern 2, and proper
results were obtained. Results of 10 iterations are shown in figures 10-14.
**Insert Figures 10-14 Here: MSE criterion figures of test data of hybrid pattern 3 based on
diversification method **
**Insert Table 7 Here: MSE results of hybrid pattern 3 **
**Insert Table 8 Here: Results of the best practice of hybrid pattern 1, 2 and 3**
As it is shown in tables 7 & 8, hybrid pattern 3 improved MSE criterion and had the best
performance between 3 kinds of proposed hybrid pattern. So, it can be used as a proper model
for energy consumption in Iran. The proposed hybrid patterns are compared with ANN,
single ARIMA, ANFIS, and 3 best known literature studies in Table 9. It is inferred from the
table 8 that ANFIS has dominant results regarding ANN algorithms, so much as, single
ANFIS model has better performance than Zhang [7] hybrid model. In the other cases, the
hybrid models perform better than the single models. Among the hybrid models, the results
illustrate that the hybrid pattern 1 over trained. Therefore, the training results has the best
result amongst all methods while its testing results gets at least results amongst all hybrid
16
and [62] works; however, the third hybrid pattern has the best accuracy in forecasting energy
consumption between all methods.
**Insert Table 9 Here: Comparison results **[62]
Until this part of paper, fuzzy inference systems (FIS) and adaptive neuro-fuzzy inference
systems (ANFIS) have been designed using classic views such as gradient descend and back
propagation. One of improvement and optimization methods in proposed model is
optimization of model parameters in learning step. So using Meta-heuristic algorithms in
Takagi-Sugeno fuzzy systems may improve parameter selection in learning steps and finally
improve the results.
In this part, we tried to study impact of genetic algorithm (GA) and particle swarm
optimization (PSO), as two famous Meta heuristic methods, on optimization of learning
parameters and MSE criteria. Pattern of genetic algorithm has shown in figure 15.
**Insert Figures 15 Here: ANFIS optimization using GA**
In this pattern, optimal values of parameters are considered as coefficients of parameters
value in basic system. These coefficients are estimated using GA or PSO or other
Meta-heuristic algorithms to minimize error criteria or MSE.
According to this framework, results of Optimized ANFIS with GA and PSO are shown in
Error! Reference source not found.. As it is shown, MSE and RMSE criteria have been
improved in both Meta-heuristic algorithms and the overall average of 5 iterations obtain
better results than non-optimized single ANFIS model. However, the proposed ensemble
algorithm (hybrid pattern 3) is outperformed than both optimized algorithms.
**Insert Table 10 Here: Results of optimized ANFIS using GA and PSO **
6.
Conclusion
According to the various applied models in this study, it can be assumed that using special
linear and nonlinear models can present desirable results with high correctness, especially
when both models have good forecasting strength. Because ARIMA model can forecast
linear part of data well also using an effective nonlinear model like ANFIS, increases
forecasting efficiency.
Comparing suggested models, we can conclude while hybrid patterns have more accuracy
and strength than each model separately, nevertheless using ensemble methods in forecasting
17
AdaBoost method with Genfis3 ANFIS structure and back propagation training algorithm has
better results and model's MSE criterion was decreased to 0.026% from 0.058% of second
hybrid pattern. Therefore, this model can successfully be used for energy consumption in
Iran.
What makes our study differs from other is using 2 novel patterns (pattern 2 and 3) in time
series prediction. Because of the fact that lack of data in forecasting field is one of the most
critical issues, the third pattern can be widely used in time series prediction models while the
data is inadequate.
In future studies, new diversification methods as well as using other prediction model such as
Support Vector Machines can be used to improve results. Also, finding the best values of
AdaBoost method parameters, with a powerful method like genetic algorithm can make
remarkable results. Moreover, each of inputs can be forecasted by ARIMA model and results
used as the input of hybrid models.
Acknowledgment
The research was supported through the Czech Science Foundation (GACR) under project
15-23699S and through SP2016/11, a SGS research project of VSB-TU Ostrava, and
furthermore by the European Social Fund in the framework of CZ.1.07/2.3.00/20.0296.
References:
[1] Abbasimehr H, Setak M, Tarokh M. A neuro-fuzzy classifier for customer churn prediction. Int J Comput Appl. 2011;19:35-41.
[2] Lee Y-S, Tong L-I. Forecasting energy consumption using a grey model improved by incorporating genetic programming. Energy conversion and Management. 2011;52:147-52.
[3] Ekonomou L. Greek long-term energy consumption prediction using artificial neural networks. Energy. 2010;35:512-7. [4] Suganthi L, Samuel AA. Energy models for demand forecasting—A review. Renewable and Sustainable Energy Reviews. 2012;16:1223-40.
[5] Yu S, Wei Y-M, Wang K. A PSO–GA optimal model to estimate primary energy demand of China. Energy Policy. 2012;42:329-40.
[6] Azadeh A, Asadzadeh S, Saberi M, Nadimi V, Tajvidi A, Sheikalishahi M. A neuro-fuzzy-stochastic frontier analysis approach for long-term natural gas consumption forecasting and behavior analysis: the cases of Bahrain, Saudi Arabia, Syria, and UAE. Applied Energy. 2011;88:3850-9.
[7] Zhang GP. Time series forecasting using a hybrid ARIMA and neural network model. Neurocomputing. 2003;50:159-75. [8] Pappas SS, Ekonomou L, Karamousantas DC, Chatzarakis G, Katsikas S, Liatsis P. Electricity demand loads modeling using AutoRegressive Moving Average (ARMA) models. Energy. 2008;33:1353-60.
[9] Lee Y-S, Tong L-I. Forecasting nonlinear time series of energy consumption using a hybrid dynamic model. Applied Energy. 2012;94:251-6.
[10] Efendigil T, Önüt S, Kahraman C. A decision support system for demand forecasting with artificial neural networks and neuro-fuzzy models: A comparative analysis. Expert Systems with Applications. 2009;36:6697-707.
[11] Azadeh A, Ghaderi S, Sohrabkhani S. A simulated-based neural network algorithm for forecasting electrical energy consumption in Iran. Energy Policy. 2008;36:2637-44.
[12] Azadeh A, Saberi M, Seraj O. An integrated fuzzy regression algorithm for energy consumption estimation with non-stationary data: a case study of Iran. Energy. 2010;35:2351-66.
18
[15] Acaroglu O, Ozdemir L, Asbury B. A fuzzy logic model to predict specific energy requirement for TBM performance prediction. Tunnelling and Underground Space Technology. 2008;23:600-8.
[16] Ciabattoni L, Grisostomi M, Ippoliti G, Longhi S. Fuzzy logic home energy consumption modeling for residential photovoltaic plant sizing in the new Italian scenario. Energy. 2014;74:359-67.
[17] Hao J, Liu D, Li Z, Chen Z, Kong L. Power system load forecasting based on fuzzy clustering and gray target theory. Energy Procedia. 2012;16:1852-9.
[18] Mamlook R, Badran O, Abdulhadi E. A fuzzy inference model for short-term load forecasting. Energy Policy. 2009;37:1239-48.
[19] Suganthi L, Iniyan S, Samuel AA. Applications of fuzzy logic in renewable energy systems – A review. Renewable and Sustainable Energy Reviews. 2015;48:585-607.
[20] Jang J-S. ANFIS: adaptive-network-based fuzzy inference system. Systems, Man and Cybernetics, IEEE Transactions on. 1993;23:665-85.
[21] Alizadeh M, Jolai F, Aminnayeri M, Rada R. Comparison of different input selection algorithms in neuro-fuzzy modeling. Expert Systems with Applications. 2012;39:1536-44.
[22] Barak S, Dahooie JH, Tichý T. Wrapper ANFIS-ICA method to do stock market timing and feature selection on the basis of Japanese Candlestick. Expert Systems with Applications. 2015;42:9221-35.
[23] Ying L-C, Pan M-C. Using adaptive network based fuzzy inference system to forecast regional electricity loads. Energy Conversion and Management. 2008;49:205-11.
[24] Akdemir B, Çetinkaya N. Long-term load forecasting based on adaptive neural fuzzy inference system using real energy data. Energy Procedia. 2012;14:794-9.
[25] Al-Ghandoor A, Samhouri M, Al-Hinti I, Jaber J, Al-Rawashdeh M. Projection of future transport energy demand of Jordan using adaptive neuro-fuzzy technique. Energy. 2012;38:128-35.
[26] Azadeh A, Saberi M, Gitiforouz A, Saberi Z. A hybrid simulation-adaptive network based fuzzy inference system for improvement of electricity consumption estimation. Expert Systems with Applications. 2009;36:11108-17.
[27] Li K, Su H, Chu J. Forecasting building energy consumption using neural networks and hybrid neuro-fuzzy system: A comparative study. Energy and Buildings. 2011;43:2893-9.
[28] Li C, Hu J-W. A new ARIMA-based neuro-fuzzy approach and swarm intelligence for time series forecasting. Engineering Applications of Artificial Intelligence. 2012;25:295-308.
[29] Babu CN, Reddy BE. A Moving-Average-Filter-Based Hybrid ARIMA–ANN Model for Forecasting Time Series Data. Applied Soft Computing. 2014.
[30] Kavaklioglu K, Ceylan H, Ozturk HK, Canyurt OE. Modeling and prediction of Turkey’s electricity consumption using artificial neural networks. Energy Conversion and Management. 2009;50:2719-27.
[31] Kucukali S, Baris K. Turkey’s short-term gross annual electricity demand forecast by fuzzy logic approach. Energy Policy. 2010;38:2438-45.
[32] Chang P-C, Fan C-Y, Lin J-J. Monthly electricity demand forecasting based on a weighted evolving fuzzy neural network approach. International Journal of Electrical Power & Energy Systems. 2011;33:17-27.
[33] Abraham A, Nath B. A neuro-fuzzy approach for modelling electricity demand in Victoria. Applied Soft Computing. 2001;1:127-38.
[34] Yan X, Chowdhury NA. Mid-term electricity market clearing price forecasting utilizing hybrid support vector machine and auto-regressive moving average with external input. International Journal of Electrical Power & Energy Systems. 2014;63:64-70.
[35] Rahmani R, Yusof R, Seyedmahmoudian M, Mekhilef S. Hybrid technique of ant colony and particle swarm optimization for short term wind energy forecasting. Journal of Wind Engineering and Industrial Aerodynamics. 2013;123, Part A:163-70.
[36] Osório G, Matias J, Catalão J. Short-term wind power forecasting using adaptive neuro-fuzzy inference system combined with evolutionary particle swarm optimization, wavelet transform and mutual information. Renewable Energy. 2015;75:301-7.
[37] Hamzacebi C, Es HA. Forecasting the annual electricity consumption of Turkey using an optimized grey model. Energy. 2014;70:165-71.
[38] Xie N-m, Yuan C-q, Yang Y-j. Forecasting China’s energy demand and self-sufficiency rate by grey forecasting model and Markov model. International Journal of Electrical Power & Energy Systems. 2015;66:1-8.
[39] Azadeh A, Asadzadeh S, Mirseraji G, Saberi M. An emotional learning-neuro-fuzzy inference approach for optimum training and forecasting of gas consumption estimation models with cognitive data. Technological Forecasting and Social Change. 2015;91:47-63.
[40] Jovanović RŽ, Sretenović AA, Živković BD. Ensemble of various neural networks for prediction of heating energy consumption. Energy and Buildings. 2015;94:189-99.
[41] Kozak J, Boryczka U. Multiple Boosting in the Ant Colony Decision Forest meta-classifier. Knowledge-Based Systems. 2015;75:141-51.
[42] Haykin S. Neural networks: a comprehensive foundation, 1994. Mc Millan, New Jersey. 2010.
[43] Liu H, Tian H-q, Li Y-f, Zhang L. Comparison of four Adaboost algorithm based artificial neural networks in wind speed predictions. Energy Conversion and Management. 2015;92:67-81.
[44] Freund Y, Schapire RE. Experiments with a new boosting algorithm. In: Morgan K, editor. 13th International Conference on Machine Learning. San Francisco 1996. p. 148 – 56.
[45] Cao J, Kwong S, Wang R. A noise-detection based AdaBoost algorithm for mislabeled data. Pattern Recognition. 2012;45:4451-65.
19
[47] Assaad M, Boné R, Cardot H. A new boosting algorithm for improved time-series forecasting with recurrent neural networks. Information Fusion. 2008;9:41-55.
[48] Alfaro E, García N, Gámez M, Elizondo D. Bankruptcy forecasting: An empirical comparison of AdaBoost and neural networks. Decision Support Systems. 2008;45:110-22.
[49] Heo J, Yang JY. AdaBoost based bankruptcy forecasting of Korean construction companies. Applied Soft Computing. 2014;24:494-9.
[50] Pappas SS, Ekonomou L, Karampelas P, Karamousantas D, Katsikas S, Chatzarakis G, et al. Electricity demand load forecasting of the Hellenic power system using an ARMA model. Electric Power Systems Research. 2010;80:256-64. [51] Ediger VŞ, Akar S. ARIMA forecasting of primary energy demand by fuel in Turkey. Energy Policy. 2007;35:1701-8. [52] Lemaic M, Speckenmeyer E. Markov-Chain-Based Heuristics for the Minimum Feedback Vertex Set Problem. [53] Sivanandam S, Sumathi S, Deepa S. Introduction to fuzzy logic using MATLAB: Springer; 2007.
[54] Xiong L. Data Mining: Concepts and Techniques.
[55] MéNdez GM, De Los Angeles HernáNdez M. Hybrid learning mechanism for interval A2-C1 type-2 non-singleton type-2 Takagi–Sugeno–Kang fuzzy logic systems. Information Sciences. 2013;220:149-69.
[56] Sadeghi M, Mirshojaeian Hosseini H. Energy supply planning in Iran by using fuzzy linear programming approach (regarding uncertainties of investment costs). Energy policy. 2006;34:993-1003.
[57] Geem ZW, Roper WE. Energy demand estimation of South Korea using artificial neural network. Energy Policy. 2009;37:4049-54.
[58] Kıran MS, Özceylan E, Gündüz M, Paksoy T. A novel hybrid approach based on particle swarm optimization and ant colony algorithm to forecast energy demand of Turkey. Energy conversion and management. 2012;53:75-83.
[59] Ünler A. Improvement of energy demand forecasts using swarm intelligence: The case of Turkey with projections to 2025. Energy Policy. 2008;36:1937-44.
[60] Barak S, Modarres M. Developing an approach to evaluate stocks by forecasting effective features with data mining methods. Expert Systems with Applications 2014.
[61] Babu CN, Reddy BE. A moving-average filter based hybrid ARIMA–ANN model for forecasting time series data. Applied Soft Computing. 2014;23:27-38.
Figure1.Pattern of choosing the best ARIMA model
A1
A2
B1
B2
∏
Σ
N
∏
N
x
y
Layer 1
Layer 2 Layer 3 Layer 4
Layer 5
x y
x y
f
W1
W2
ѿ1f1
ѿ2f2 ѿ1
ѿ2
Figure2. ANFIS structure of type3, with 2 inputs and one output Checking data
stationary and determining d
parameter
Drawing ACF & PACF
figures
Determining likely MA&AR quantities
Creating probablistic
patterns
Choosing pattern according to
P
a
tt
e
rn
3
P
a
tt
e
rn
2
P
a
tt
e
rn
1
A.Data collection and preprocessing
B. Data stationary examining and ARIMA implementation after recognizing AR, MA and d parameters
Using ARIMA forecasts as one of ANFIS model inputs
Implementation various ANFIS model and choosing
the best model Choosing the best ANFIS
model AdaBoost method
implementation
Choosing the best ANFIS model
Dividing residuals to train and test and implementation of
various ANFIS model
Achieving final results of hybrid pattern 2 Achieving final results of
hybrid pattern 3
Achieving final results of hybrid pattern 1
C. Choosing the best model
A
d
a
B
o
o
s
t
Initial training data set (Sn)
Weight distribution W1 Weight distribution W2 Weight distribution Wn
Training dataset 1 Selected from Sn According to W1
Training dataset 2 Selected from Sn According to W2
Training dataset t Selected from Sn According to Wt
First iteration of weak learner
Second iteration of weak learner
T’th iteration of weak learner
Testing dataset
First iteration of weak learner
Second iteration of weak learner
T’th iteration of weak learner
. . .
combination Prediction result
. . .
Figure5. Auto correlation and partial auto correlation in Iran`s data before lagging
Figure7. ARIMA model forecasting residuals
Figure11-MSE criterion figure of test data in hybrid pattern 3, sub
[image:26.612.79.547.69.683.2]clustering ANFIS and BP optimum algorithm Figure 10-MSE criterion figure of test data in hybrid pattern 3, grid
partitioning ANFIS and BP optimum algorithm
Figure 13-MSE criterion figure of test data in hybrid pattern 3,
FCM ANFIS and BP optimum algorithm Figure 12-MSE criterion figure of test data in hybrid pattern 3, grid
partitioning ANFIS and hybrid BP optimum algorithm
Table1. Review of hybrid energy forecasting implementations Error Percent Forecasting Scope Forecasting Method Energy Market Study Field Study Number
Best model: 1.4%
Daily ARIMA Greek Electricity [8] 1 4.02% 8.88% Monthly Neural network Time series Taiwan Electricity [13] 2 1.15% Annual Neural network Turkey Electricity [30] 3 - Annual Fuzzy logic Turkey Electricity [31] 4 6.43% Monthly Weighted Neuro fuzzy
Taiwan Electricity [32] 5 17.62% Annual Neuro Fuzzy
A small region Electricity [14] 6 ARIMA:4.23% Neural network:3.23 % Neuro fuzzy: 0.92%
30 Minutes ARIMA, Neural
network, Neuro fuzzy Australia
Electricity
[33]
7
Neuro fuzzy: 4.88% 7.05% 2.41%
Monthly Neuro fuzzy, Neural
network 3 Company in
Istanbul All kind of demand
[10] 8 0.155% Annual ANFIS Jordon Transportation energy [25] 10 Bahrain:1.8% Saudi Arabia :1.4% Syria:7.5% UAE:1.6% Annual ANFIS-SFA hybrid
4 Middle East countries Gas consumption [6] 11 0.82% Monthly ARIMA-fuzzy regression Iran Electricity [12] 12 0.144 mid term hybrid: SVM- ARMAX PJM interconnected electric market Electricity market clearing price (MCP) [34] 13
MAPE: 3.53 %
short term (daily) hybrid ant colony
(ACO) and particle swarm (PSO) iran
wind energy
[35]
14
MAPE: 3.75 %
short term ANFIS- EPSO Portugal wind power [36] 15 MAPE: 3.28% annual grey model Turkey electricity [37] 16 0.69% 0.93% annual Grey model- Markov
chain China energy production and consumption [38] 17 ELFIS NMSE: 0.26% hourly ELFIS- ANN- ANFIS
Iran gas consumption [39] 18 MAPE: 5.25% daily Ensemble of neural
Table2. Akaike and Schwarz (BIC) criterions comparison for [1, 1, 2] and [2, 1, 1] ARIMA models
Table3. Error criteria results of [1, 1, 2] ARIMA model
Table4. MSE criterion results of test and train data in hybrid pattern 1
MSE check data Grid partitioning Sub clustering FCM
BP 0.461144459 0.129120718 0.2403921
Hybrid BP 0.37272772 0.111771157 0.1356161
MSE train data Grid partitioning Sub clustering FCM
BP 0.27423836 0.00157647 0.0261099
Hybrid BP 5.66 e-8 7.87 e -9 9.97 e-8
Table5. Train and test MSE criterion results of hybrid pattern 2
MSE check data Grid partitioning Sub clustering FCM
BP 0.670779481 0.111324451 5.76 e-4
Hybrid BP 0.575888121 0.125924396 0.02944284
MSE train data Grid partitioning Sub clustering FCM
BP 0.088080372 1.95 e-7 1.43 e-4
Hybrid BP 3.84 e-11 4.4 e-12 6.90 e-10
model [1,1,2] [2,1,1]
AIC 8.497 8.5263
BIC 8.622 8.6529
model [1,1,2]
RMSE 15.7428
Table6. Fuzzy rules of ANFIS model of hybrid model 2
If (in1 is in1cluster1) and (in2 is in2cluster1) and (in3 is in3cluster1) and (in4 is in4cluster1) and (in5 is in5cluster1) then (out1 is
out1cluster1) (1) 1
If (in1 is in1cluster2) and (in2 is in2cluster2) and (in3 is in3cluster2) and (in4 is in4cluster2) and (in5 is in5cluster2) then (out1 is
out1cluster2) (1) 2
If (in1 is in1cluster3) and (in2 is in2cluster3) and (in3 is in3cluster3) and (in4 is in4cluster3) and (in5 is in5cluster3) then (out1 is
out1cluster3) (1) 3
If (in1 is in1cluster4) and (in2 is in2cluster4) and (in3 is in3cluster4) and (in4 is in4cluster4) and (in5 is in5cluster4) then (out1 is
out1cluster4) (1) 4
If (in1 is in1cluster5) and (in2 is in2cluster5) and (in3 is in3cluster5) and (in4 is in4cluster5) and (in5 is in5cluster5) then (out1 is
out1cluster5) (1) 5
If (in1 is in1cluster6) and (in2 is in2cluster6) and (in3 is in3cluster6) and (in4 is in4cluster6) and (in5 is in5cluster6) then (out1 is
out1cluster6) (1) 6
If (in1 is in1cluster7) and (in2 is in2cluster7) and (in3 is in3cluster7) and (in4 is in4cluster7) and (in5 is in5cluster7) then (out1 is
out1cluster7) (1) 7
If (in1 is in1cluster8) and (in2 is in2cluster8) and (in3 is in3cluster8) and (in4 is in4cluster8) and (in5 is in5cluster8) then (out1 is
out1cluster8) (1) 8
Table7. Test and train MSE criterion of hybrid model 3
MSE check data Grid partitioning Sub clustering FCM
BP 0.193931541 1.19 e-3 2.63 e-4
Hybrid BP 0.080798813 4.66 e-4 3.29 e-4
MSE train data Grid partitioning Sub clustering FCM
BP 0.189186074 4.45 e-7 1.37 e-4
Table8. Results of the best practice of hybrid pattern 1, 2 and 3
MSE criterion Hybrid pattern 1 Hybrid pattern 2 Hybrid pattern 3
Test data 0.111771157 5.76 e-4 2.63 e-4
Train data 7.87 e-9 1.43 e-4 1.37 e-4
Table9. Comparison results
MSE criterion
single ARIMA
single ANFIS
ANN Zhang
[7]
Khashei and Bijari [62]
Babu and Reddy
[29]
hybrid pattern 1
hybrid pattern 2
hybrid pattern 3
test data 3.97 0.121771 0.155 0.1431 0.0833 0.0266 0.1117712 5.76 e-4 2.63 e-4
train data - 7.97E-09 0.176 0.041 0.009 0.0073 7.87 e-9 1.43 e-4 1.37 e-4
Table10. Results of optimized ANFIS using GA and PSO
Test Result 1 2 3 4 5 average
MSE ANFIS PSO 0.00021 6.02E-05 0.0006893 0.00035 0.00044 0.00035
RMSE ANFIS PSO 0.01447 0.00776 0.0262536 0.01876 0.02105 0.01766
MSE ANFIS GA 0.00053 0.00019 0.0002733 0.00025 0.00025 0.0003