www.wjpr.net Vol 5, Issue 7, 2016.
68
FORMULATION, EVALUATION AND CHARACTERIZATION OF
LUMEFANTRINE – PEG BASED SOLID DISPERSION
Calister E. Ugwu, Nicholas C Obitte and Oluchi B Madu
Department of Pharmaceutical Technology and Industrial Pharmacy, University of Nigeria,
Nsukka, 410001, Nigeria.
ABSTRACT
Poor aqueous solubility of drugs presents one of the major challenges
to be tackled in order to improved oral bioavailability of some drugs.
Lumefantrine is one of such drug with solubility and permeability
challenges. Fusion method was used in preparing lumefantrine PEG
solid dispersion. Different drug: carrier ratios (1:1, 1:2 and 1:3) were
used. Solubility study of the drug was carried out. The following
evaluation studies were done: percentage yield, loading efficiency,
micromeritics properties, in vitro release profile. Then, characterized
using differential scanning calorimetry (DSC) and wide angle x-ray
diffraction (WAXD). The result showed that lumefantrine showed
highest solubility in PEG 6000, Kollidon® 12 PF and kolliphor® HS 15 as 98.36 ± 0.03, 96. 99 ± 0. 01 and 95.76 ± 0.11 mg/ ml respectively. The batch Pk17 had the
highest loading efficiency (L.E) of 88.20 ± 0.22 %. There was significant variation (p < 0.5)
in the L.E of SDs formulation (Pk 10 – 21) and (P1 – 9) without Kollidon® 12 PF. This variation might be due to high solubilizing capacity of Kollidon® 12 PF. The batch Pk17 also exhibited the highest release profile amomg the batches. The DSC and WAXD results also
showed less crystalline products with higher solubilization potential and also characterized
the formulation as a eutectic solid dispersion. Lumenfantrine – PEG loaded solid dispersion
with Kollidon 12 PF had an improvement on the solubility and dissolution rate of the drug
with potential inhibition of crystal formation.
KEYWORDS: lumefantrine, PEG 6000, Kollidon® 12 PF, Solid dispersion.
Volume 5, Issue 7, 68-86. Research Article ISSN 2277– 7105
*Corresponding Author Calister Ugwu
Department of
Pharmaceutical Technology
and Industrial Pharmacy,
University of Nigeria,
Nsukka, 410001, Nigeria. Article Received on 30 April 2016,
Revised on 20 May 2016, Accepted on 11 June 2016
www.wjpr.net Vol 5, Issue 7, 2016.
69 INTRODUCTION
Poor aqueous solubility of drugs presents one of the major challenges to be tackled in order to
improve bioavailability of some drugs. Dissolution profile of drug is an important factor to
determine how bioavailable the drug will be in vivoly. An oral bioavailability of poorly water
soluble drugs (PWSDs) depends mainly on the solubility of such drug.[1-4] Researchers have been making efforts to improve the dissolution rate of the PWSDs using different approaches.
Many techniques have been reported to improve the solubility of PWSDs such as the use of
adsorbent,[5,6] hydrotropes and co solvent,[7] surfactants,[8] liquid compacts,[9] co-precipitate,[10] interactive mixtures,[11] fast releasing microparticles,[12] solid dispersion,[13,14] complexation with cyclodextrin.[15,16] Solid dispersion (S.D) is one of the excellent means of enhancing drug dissolution rate and bioavailability of poorly aqueous drug. Solid dispersion
is a dispersion of one or more active ingredients in an inner carrier or matrix in solid state
prepared by different methods.[17] This may produce either crystalline or amorphous state formulation. The drug can be dispersed molecularly in amorphous or in crystalline materials.
SD improves drug solubility by the various mechanisms: by reducing the particle size, by
increasing porosity, by converting the crystalline forms of drug into amorphous form, etc.
Two basic classifications of solid dispersion (SD) are base on molecular arrangement
(eutectics, solid solution, micro fine crystalline matrix)[18,19] and secondly, based on carrier matrix used such as first, second and third generations.[20] When drug and polymer are miscible in molten form, the mixture that resulted is called a eutectic mixture. Moreover, in a
eutectic mixture, the melting point of the mixture is usually lower than the melting point of
the carrier in eutectic state where both the drug and carrier subsist in finely divided form
which provides higher surface area and enhanced dissolution rate of the drug. Some
substances have been proved to generate eutectic composition in order to improve dissolution
rates of PWSDs such substances include PEG, urea, and polyoxyethylene - polyoxypropylene
(Pluronic).[21]
Polyethylene glycol (PEG) is a polymer with low melting point, low toxicity, low
hydrophobicity and broad drug compatibility.[14,21,22–25] It is a polymer of oxidized ethylene. And it is usually transparent or white solid. Dispersion of PWSDs in PEG creates
hydrophilicity which will enhance the bioavailability of the drug. The uses of PEG as a
www.wjpr.net Vol 5, Issue 7, 2016.
70 nifedipine: PEG carrier solid dispersion.[27] PEGs of higher molecular grades (1500 - 20000) are used in SDs.[21] PEG is hydrophilic though its solubility in water decreases with increase in molecular weight and also has good solubility in some organic solvents. PEG 6000 has
also been reported to enhance the solubility and dissolution of etodolac by melting method.[28] PEG improves wettability of PWSDs using its amphipathic properties.[29] It can also alter melting point by adjusting the molecular weight. This means that when an adequate
molecular weight of PEG is selected, a lower melting point solid dispersion will be obtained.
Surfactants can be incorporated to enhance the miscibility between drug and polymer or to
inhibit drug crystallization during storage.[30]
Kollidon 12 PF is a water-soluble vinylpyrrolidone and vinyl acetate copolymer containing
the two components in a ratio of 6: 4. A substance containing both hydrophobic and
hydrophilic substance will improve surface activity of poor aqueous drug, controls solubility
barriers leading to enhance dissolution and improve absorption and bioavailability of poorly
water soluble drugs. Also, its vinyl acetate component, which is more hydrophobic, provides
less brittle films. This gives the product its favourable properties as a soluble binder and
film-forming agent, particularly for solid dosage forms. It improves solubility, prevents crystal
growth on the process of dilution when in contact with fluid, accelerate disintegration and
dissolution rate and give immediate release matrix of the drug.
Lumefantrine (lum) being a class IV agent in BCS has a serious challenge of poor solubility
and permeability. Solubility is the chief determinant of oral bioavailability and permeability.
Therefore, presentation of the drug in a eutectic or monotectic mixture will uniformly
increase the surface activity which might eliminates the impermeability stubbornness of the
drug and the synergistic solubilization by the excipients will equally improve dissolution.
This will be supported by the fact that gastrointestinal system has hydrophobic membrane
and lumefantrine, a PWSD, being molecularly dispersed in an amphipathic carrier will
enhance its penetration through the lipophilic membrane with ease. The dissolution rate of
solid dispersion continuously may tend to depreciate on aging or storage.[31] The formulation of lumefantrine SD in the presence of Kollidon 12 PF will inhibit crystal growth thereby
enhancing physical stability of the formulation on storage with improve dissolution rate. The
present research work was to formulate a eutectic mixture with less crystallinity and
improved molecular dispersion of drug so as to enhance physical stability, solubility,
www.wjpr.net Vol 5, Issue 7, 2016.
71 MATERIALS AND METHODS
Lumefantrine (CAS71963-77-4 Hangzhou Dayangchem co., Ltd, free gift); PEG 6000
(Qualikens, India); kolliphor® HS 15, kollidon® 12 PF (Povidone K 12, Eur., USP) and Kolliphor® EL (as free gift from BASF). All other reagents were of analytical grade.
Solubility studies
Different carrier and excipients were screened for solubilization of lumefantrine by saturation
solubility method. The solubility of lumefantrine in aqueous medium, kolliphor HS 15®, polyethylene glycol 6000, kollidon® 12 PF and kolliphor® EL was determined by dissolving excess amount of lumefantrine in 3 ml of each of the selected excipients in a test tube. The
test tubes were shaken at time intervals for 24 h under 25 ± 1o C. The supernatants were taken and assayed for lumefantrine content using UV/VIS spectrophotometer (Spectrumlab, 752s,
UK).
Preparation of lumefantrine solid dispersion by Fusion method
An 80 mg lumefantrine was accurately weighed and loaded in different lumefantrine: PEG
6000 ratios of 1:1, 1:2, and 1:3 as shown in Table 1. The drug was added in a crucible and
heated on an electric plate until it melted before the addition of the carrier, PEG 6000 and
other excipients. The molten mixtures (P1-P9 and Pk10 - 18) were cooled in an ice bath and
the solid mass was allowed to dry completely for some days in a calcium chloride desiccator.
The dried mass was crushed using a mortar and pestle, and passed through sieve of 52 mm
aperture size. [32-35] The yields of the batches were noted and percentage yield calculated. The physical mixture solid dispersions were also prepared by mixing all the excipients and drug
together at the same ratio in a mortar and pestle, pulverized and sieved using the same sieve
aperture. It was noted as batches Pk19-21. Then, stored in an airtight container and placed in
a desiccator for further use.
Table 1: Formula of lumefantrine- loaded solid dispersion by fusion and physical mixture method
Batches Lumefantrine PEG 6000 Kolliphor® HS 15 kolliphor® EL Kolliphon® 12 PF
P1 1 1
P2 1 2
P3 1 3
P4 1 1 0.5
P5 1 2 0.5
P6 1 3 0.5
www.wjpr.net Vol 5, Issue 7, 2016.
72
P8 1 2 0.5
P9 1 3 0.5
Pk10 1 1 0.5 1
Pk11 1 2 0.5 1
Pk12 1 3 0.5 1
Pk13 1 1 0.5 1
Pk14 1 2 0.5 1
Pk15 1 3 0.5 1
Pk16 1 1 0.5 0.5 1
Pk17 1 2 0.5 0.5 1
Pk18 1 3 0.5 0.5 1
Pk19 1 1 0.5 0.5 1
Pk20 1 2 0.5 0.5 1
Pk21 1 3 0.5 0.5 1
Percentage yield
Percentage practical yield is calculated to know the percent yield or efficiency of any
method.[36] The percentage yield is calculated as the ratio of the mass of the product obtained at the end of the process and the mass of initial substances added which included the drug and
the carrier as shown in equation 1.
Percentage yield (%) = ………... eq 1
Flow properties
The following micromeritics properties were carried out according to the following authors in
triplicate form.[37-40]
Bulk and tapped density
A 2 g of each of the samples was weighed out and placed in a 10 ml graduated cylinder. The
volume occupied by the powder was noted and recorded as the bulk volume. The bulk density
was obtained by dividing the mass of the powdered samples weighed out by the bulk volume
as seen in equation 2.
Bulk density = ……… eq 2
The cylinder was tapped on a wooden platform by dropping the cylinder from a height of one
inch at 2 sec interval until there was no change in volume. This volume was taken as the
tapped volume. The tapped density was calculated from equation 3.
www.wjpr.net Vol 5, Issue 7, 2016.
73 Flow rate and angle of repose
A funnel was properly clamped on the retort stand. The various samples with known weight
were gradually placed into the funnel with the orifice of the funnel closed. Upon opening the
orifice, the time it took for the entire powder sample in the funnel to flow out through the
orifice was noted. The height and radius of the powder heap was determined. This was done
in triplicate to get the mean flow rate (g/s) and angle of repose in degree (o).
The flow rate of powder (g/s) = ………... eq 4
The angle of repose (θ) = tan-1
………. eq 5
Compressibility index and Hausner’s quotient
Compressibility index and Hausner’s Quotient were calculated as,
Carr’s Index (%) = ……….eq 7
Hausner’s quotient = ………. eq 8
Determination of loading efficiency
An equivalent of 80 mg of lumefantrine was weighed out from each of the batches and placed
in a beaker containing 10 ml of methanolic HCL and stirred to dissolve the solid dispersion.
The volume was then made up to 100 ml with methanolic HCL and thoroughly mixed. The
resulting solution was filtered and analyzed spectrophotometrically at a wavelength of 335
nm using a UV spectrophotometer (Spectrumlab 752s, UK). This was done in triplicate. The
methanolic- HCL was used as blank. The loading efficiency (%) was calculated using the
following formula.
Loading efficiency = x ………. eq 9
In vitro release studies
The release studies of the drug were carried out with batches P5, Pk17, Pk20 and pure
lumefantrine were studied in simulated intestinal fluid, SIF, (pH, 6.8), and simulated gastric
fluid, SGF, (pH, 1.2). The USP paddle method was adopted using 900 ml of the dissolution
medium maintained at temperature of 37 ± 1o C set at 100 rpm. A known quantity (equivalent of 80 mg) of lumefantrine solid dispersion was filled into a hard gelatin capsule and dropped
into the dissolution medium. A 5 ml aliquot of the dissolution medium was collected at the
www.wjpr.net Vol 5, Issue 7, 2016.
74 set at same condition was added to replace the withdrawn sample so as to maintain a constant
volume throughout the experiment. The collected samples of the released medium were
analyzed at a wavelength of 335 nm using UV spectrophotometer (spectrumlab 752s, UK).
Differential scanning calorimetry (DSC).
Melting transitions and changes in heat capacity of pure lumefantrine, the excipients and
Batch Pk17 were determined using a differential scanning calorimeter (Netzsch DSC 204 F1,
Geratebau, GmbH, selb, Germany). About 2- 10 mg of each sample was weighed into
aluminum pan, hermetically sealed and the thermal behavior determined within the range
20-400 o C at a heating rate of 10 K/min under a 20 ml/min nitrogen flux. The thermal properties and enthalpies were noted.
The crystallinity index (C.I) was used to evaluate the degree of crystallinity of the carrier
matrix. This was determined from the enthalpy of the transition. [41]
C. I = ………. eq 10
Wide angle x –ray diffraction (WAXD)
WAXD diffractograms of drug, P5, P17 and P20 were recorded using a Panalytical Xpert Pro
Diffractometer (PANalytical, JB Eindhoven, Netherlands) with a copper line as the source of
radiation. Standard runs using a 40-kV voltage, a 40-mA current, and a scanning rate of 0.02°
min-1 over a 2Ɵ range of 3– 40° were used.
RESULTS AND DISCUSSION
Solubility profile of lumefantrine in different excipients.
Solubility studies were carried out to know how soluble the drug will be in various
excipients. This will ascertain amount of lumefantrine that can be loaded in the formulation.
That is, the ability of the different excipients to accommodate large amount of the
hydrophobic drug. The aqueous medium (water) exhibited a very poor solubility of the drug
www.wjpr.net Vol 5, Issue 7, 2016.
75 Figure: 1. A graph of solubility profile of lumefantrine.
Preparation of solid dispersion by Fusion
Lumefantrine solid dispersions were prepared using fusion or melt method with PEG 6000
and other materials to obtain batches P1-9 and Pk10 -18. While batches P19- P21 were
prepared by physically mixing all the components at different ratios without application of
heat in order to monitor if there will be any degradation of the drug by the method. The
lumefantrine solid dispersions were formulated in such a way that batches P1-3 produced
second generation SDs.[42, 43] Also, batches P4 – 9 contained different surfactants, Kolliphor HS 15 and Kolliphor EL to generate third generation SDs [44, 45]. While the batches Pk10- 18 and Pk19- 21 contained Kolliphor 12 PF (crystallization inhibitor) in the presence of the
surfactant(s) to generate multi-component generation of solid dispersion by fusion and
physical mixture respectively.
PERCENTAGE YIELD
In the result of the percentage yield, the solid dispersion batches have good recoveries in the
range of 60 - 94 % as shown in Table 2. The batches prepared by physical mixture method
(Pk19-21) showed highest yield than the formulations prepared by fusion method. This
decrease in the yields of SD formulations prepared by fusion method might be due to the
transference losses. Generally, the yields were appreciable as none was below 60 % recovery.
This is an indication that the fusion technique adopted was a reliable one.
LOADING EFFICIENCY
From the result as shown in Table 2, batches Pk17 had the highest loading efficiency (L.E) of
www.wjpr.net Vol 5, Issue 7, 2016.
76 15:Kolliphor® EL: Kollidon® 12 PF in the ratio of 1:2:0.5: 0.5: 1. The combination of the two to three solubilizers plus the binding and crystallization inhibition of Kollidon 12 PF in that
ratio were appropriate to obtain SD products with good loading efficiency. There was
significant variation (p < 0.5) in the L.E of SDs formulation (Pk 10 – 21) and other
generation SD formulations (P1 – 9) that do not contain Kollidon® 12 PF. This variation might be due to high solubilizing capacity of Kollidon® 12 PF.
Table: 2 The results of percentage yield and loading efficiency (%) of the formulations. Batches Yield (%) L.E (%)± Sd
P1 67.88 34.30±0.50
P2 63.80 41.10±0.20
P3 70.40 38.10±0.41
P4 60.36 48.73±0.10
P5 87.70 55.80±0.32
P6 69.80 52.50±0.40
P7 62.24 55.00±0.12
P8 74.88 55.70±0.17
P9 71.72 54.60±0.30
P10 66.67 72.50±0.22
P11 72.76 65.40±0.34
P12 79.03 75.30±0.15
P13 69.19 73.80±0.32
P14 82.44 75.50±0.21
P15 68.55 74.00±0.09
P16 89.24 80.20±0.23
P17 90.80 88.20±0.22
P18 88.21 81.50±0.33
P19 90.58 65.14±0.13
P20 94.62 69.58±0.14
P21 93.00 68.24±0.11
L. E = loading efficiency; Sd standard deviation
FLOW PROPERTIES
The measurement of the flow properties of powders is essential before encapsulation and
tableting because variation in particle flow will automatically cause variation in tablet weight
and uneven distribution of active ingredient. The bulk and tapped densities of the whole
formulations were in the ranged of 0.366 ± 0.04 to 0.500 ± 0.02 (g/.ml). The Carr’s Index
and Hausner’s quotient showed excellent and good flowability of all the formulations. The
flow rate and angle of repose of batches Pk10 – 21 exhibited excellent flow properties while
www.wjpr.net Vol 5, Issue 7, 2016.
77 Table: 4 Results of the micromeritics properties of the formulation.
Batches BD(g/ml)±Sd TD(g/ml)±Sd C.I (%)± Sd HQ± Sd FR(g/s)±Sd AOR (o )± Sd
P1 0.454 ±0.01 0.483±0.02 6.004 1.064 6.4±.0.01 28±0.13
P2 0.454±0.01 0.469±0.6 3.198 1.033 6.6±0.01 26±0.11
P3 0.441±0.05 0.469±0.6 5.970 1.063 6.5±0.04 25±0.12
P4 0.405±0.01 0.429±0.3 5.594 1.059 7.2±0.01 28±0.14
P5 0.427±0.03 0.429±0.3 0.466 1.004 7.0±0.05 30±0.10
P6 0.405±0.01 0.441±0.01 8.163 1.089 6.8v0.10 30±0.11
P7 0.394±0.01 0.441±0.01 10.657 1.129 6.7±0.12 30±0.10
P8 0.384±0.02 0.417±0.2 7.914 1.086 6.6±0.03 26±0.11
P9 0.394±0.01 0.405±0.03 2.716 1.028 6.5±0.02 26±0.12
Pk10 0.375±0.1 0.384±0.06 2.344 1.024 7.8±0.01 27±0.07
Pk11 0.384±0.06 0.405±0.03 5.185 1.055 7.4±0.05 24±0.13
Pk12 0.384±0.06 0.405±0.2 5.185 1.055 7.6±0.10 26±0.08
Pk13 0.357±0.3 0.384±0.01 7.031 1.078 7.8±0.01 27±0.14
Pk14 0.349±0.04 0.384±0.01 9.114 1.100 7.5±0.03 25±0.16
Pk15 0.349±0.04 0.375±0.01 6.933 1.074 7.6±0.20 26±0.08
Pk16 0.375±0.02 0.384±0.01 2.343 1.024 7.4±0.05 24±0.30
Pk17 0.357±0.02 0.366±0.04 2.459 1.025 7.5±0.01 25±0.13
Pk18 0.357±0.02 0.375±0.01 4.800 1.050 7.5±0.03 25±0.51
Pk19 0.429±0.01 0.500±0.02 14.200 1.166 7.7±0.06 26±0.10
Pk20 0.417±0.05 0.469±0.01 11.087 1.125 7.8±0.04 28±0.12
Pk21 0.405±0.01 0.441±0.03 8.163 1.089 7.8±0.21 26±0.50
BD = bulk density; TD = tapped density; C. I = Carr’s index; HQ = Hausners’ quotient; FR =
flow rate; AOR = angle of repose; and Sd = standard deviation.
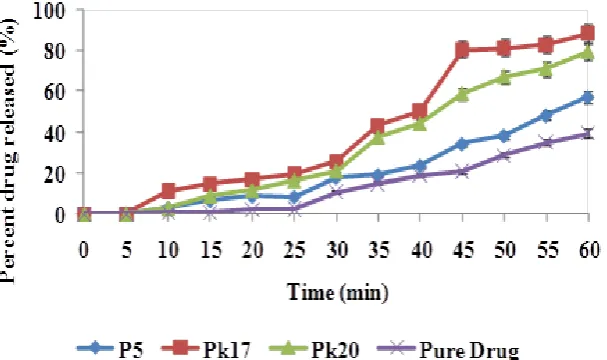
In vitro release profile of the lumefantrine-loaded solid dispersions.
The in vitro release of lumefantrine from the solid dispersion batches was studied using 900
ml of freshly prepared simulated intestinal fluid (SIF) pH, 6.8, and simulated gastric fluid
(SGF) pH, 1.2 maintained at 37 ± 1 o C. The results of the in vitro drug release of the pure drug, P5, Pk17 and Pk20 were shown in Figure 2 and 3. Their release rate exhibited gradual
release rate in both the medium. The results revealed that at T45 in SGF, the SD formulations with kollidon® 12 PF (Pk17 and Pk20) released about 80 % of the drug except batch P5 and pure drug. This was due to an effect of Kollidon® 12 PF with activity as an immediate releasing agent and its solubilization effect. Also the batch Pk17 depicted the highest drug
released batch. This might be due to the fusion SD technique used to molecularly dispersed
the drug in the carrier unlike in the physical mixture that involved ordinary mixing. While in
SIF only batch Pk17 were able to release up to 80 % of the drug at T45. This might be attributed to the effect of molecular dispersion of drug in the excipients leading to high
www.wjpr.net Vol 5, Issue 7, 2016.
78 in the release profile of drug in the SIF medium. It was observed that the release profile of
lumefantrine from the batches in SGF (pH, 1.2) was higher than in SIF (pH 6.8). This might
be due to the fact that lumefantrine is a basic drug and will release more at acidic pH. Also
from the results obtained, the batches of the lumefantrine-loaded SDs released more because
[image:11.595.145.447.193.368.2]they had a greater dilution potentials than the pure drug sample.
Figure. 2: Drug release profile of solid dispersions in simulated gastric fluid (pH, 1. 2)
Figure 3: Drug release profile of lumefantrine solid dispersion in SIF (pH, 6.8)
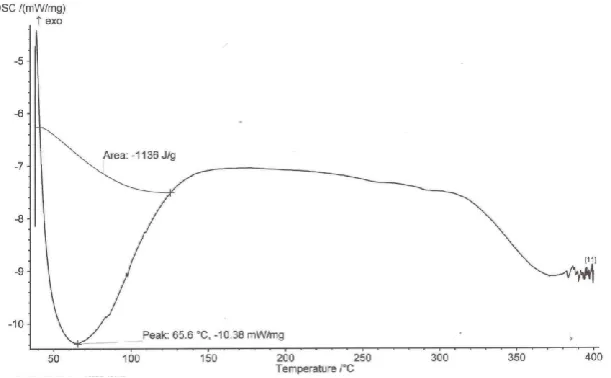
Differential scanning profile
DSC was carried out in order to study the thermotropic behaviour of lumefantrine and other
excipients used in solid dispersion formulation. It provides useful information about the solid
state properties (crystalline and amorphous) of solid materials. The thermal properties of
[image:11.595.149.453.429.609.2]www.wjpr.net Vol 5, Issue 7, 2016.
79 of the solid dispersions Pk17 were determined as shown in Fig.4 – 7. Pure lumefantrine
sample showed a sharp peak at 133.4 o C. PEG 6000 showed a peak at 67.1 o C. Kolliphor® HS 15, Kollidon® 12 PF and Kolliphor ® EL had the thermal melting peaks at 65.65, 65.6 and 58.8 o C respectively. In the thermogram of lumefantrine loaded SD batch P17 showed a melting peak at 66.0 o C without the indication of lumefantrine peak. This sharp decrease or disappearance of the drug melting peak might signify the well spread of fine crystal form of
the drug into the molten carrier. The presence of one peak indicated molecular dispersion of
the drug into the carrier giving the formulation a eutectic or monotectic mixture. And the
slight shift in the melting temperature of the carrier portrays a characteristic of a eutectic
mixture. There was also a decrease in enthalpy and crystallinity index of the carrier matrix
decreasing as a result of the loaded drug. The presence of other substances also may result to
change in thermal behavior of carrier matrix in a manner that the melting temperature and
enthalpy change will be dependent on the nature of the component interaction. From the
calculated crystallinity index (C.I), the formulation produced a less crystalline product with
C.I of 0.7469. This was as a result of decrease in the enthalpy of the carrier from - 34.17 to –
25.52 mW/mg. A decrease in enthalpy mainly indicates less crystallinity of the matrix. [49, 50] Then, the carrier matrix produced a weak matrix (due to distortion of crystal arrangement of
individual carrier after melting and solidification). This might have created several spaces for
[image:12.595.143.456.499.733.2]drug localization. [49 -52] As a result of the less crystallinity this will generate more spaces for drug localization and improvement on the loading efficiency of the carrier.
www.wjpr.net Vol 5, Issue 7, 2016.
[image:13.595.140.458.13.842.2] [image:13.595.143.449.77.277.2]80 Figure 5: DSC thermogram of PEG 6000
Figure 6: DSC thermogram of Kolliphor® HS 15
[image:13.595.146.452.328.517.2]www.wjpr.net Vol 5, Issue 7, 2016.
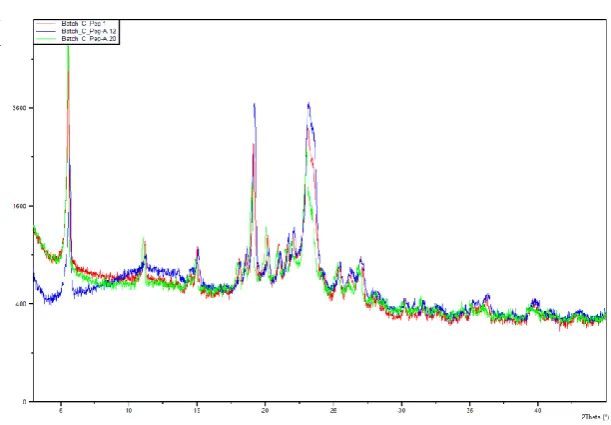
81 Wide angle x-ray diffraction (WAXD)
The diffraction patterns of the batches P5, Pk12, Pk17, and Pk20 are shown in Figure 8- 9. At
25 o (2 Theta) the following intensities were obtained 3800, 3400, 2100 and 2000 count per sec for batches P5, PK12, Pk17and Pk20 respectively. These showed that P5 was more
crystalline in nature followed by Pk 12, Pk17 and Pk20. The formulation Pk 17 and 20 being
less crystalline will entrap more drug than formulation P5 and Pk12. The batches P5
formulation portrayed the sharpest reflections showing that some of the hydrocarbon chains
carriers were stiff and fully extended. [53] The batches Pk 17, 20 and 12 in the descending order of less crystallinity. This has been confirmed by DSC as the C.I depicted less
crystallinity of the SD. The batches with less crystal states will creates more pores within the
solid matrix which will enhance drug incorporation, solubility, dissolution and
[image:14.595.147.453.489.701.2]bioavailability.
Figure: 8. WAXD diffractorgrams of Batch Pk17.
Batch c Peg A 12 represents P5; Batch c Peg 1 represents Pk12; Batch c Peg A 20 represents Pk 20
www.wjpr.net Vol 5, Issue 7, 2016.
82 CONCLUSION
Lumefantrine – PEG based solid dispersions were formulated with a low molecular weight
povidone grade, Kollidon® 12 PF, a solubilizer and crystallization inhibitor. The fusion method of solid dispersion technique adopted was reliable as there was an appreciable
percentage recovery of all the formulations in the range of 60 – 89 %. Lumefantrine showed
highest solubility in PEG 6000, Kollidon® 12 PF and then, kolliphor® HS 15 which were selected for the formulation. Increased solubilization produced by Kollidon® 12 PF was in synergism with other solubilizers (Kolliphor HS 15 and Kolliphor EL) and with an optimized
drug: carrier ratio (1:2) led batch Pk17 as the most optimized batch with the highest loading
efficiency of 88.20 ± 0.22 % and drug released. There was significant variation (p < 0.5) in
the L.E of SDs formulation (Pk 10 – 21) and other generation SD formulations (P1 – 9). This
variation might be due to high solubilizing capacity of Kollidon® 12 PF. The DSC and WAXD results also showed less crystalline products with higher solubilization potential and
also characterized the formulation as a eutectic mixture. This strategic technology improved
the poor aqueous solubility of the drug and will equally enhance the poor permeability of
lumefantrine as it was molecularly dispersed in a molten carrier and will evatually fight
malaria parasites without resistance.
REFERENCES
1. Kumar S, Malviya R, Sharma PK. Solid Dispersion: Pharmaceutical Technology for the
Improvement of Various Physical Characteristics of Active Pharmaceutical Ingredient.
Afr. J. Basic. Appl. Sci., 2011; 3: 116-125.
2. Waghmare A, Pore Y, Kuchekar B. Development and characterization of zaleplon solid
dispersion systems: A technical note. AAPS Pharm Sci. Tech., 2008; 9: 536-543.
3. Streubel A, Siepmann J, Bodmeier R. Drug delivery to the upper small intestine window
using gastroretentive technologies. Curr. Opin. Pharmacol, 2006; 6: 501 508.
4. Balvinder D, Narendra KG, Pramod KS .Formulation and Evaluation of Glibenclamide
Solid Dispersion Using Different Methods Global J Pharmacol, 2014; 8(4): 551-556,
DOI: 10.5829/idosi.gjp.2014.8.4.84283.
5. Alsaidan SM, Alsughayer AA, Eshra AG. Improved dissolution rate of indomethacin by
adsorbents. Drug Dev. Ind. Pharm, 1998; 24: 389–394.
6. Bogdanova S, Bontcheva E, Avramova, N. Phase characterization of indomethacin in
www.wjpr.net Vol 5, Issue 7, 2016.
83 7. Etman MA, Nada AH. Hydrotropic and co solvent solubilisation of indomethacin. Acta
Pharm, 1999; 49: 291–298.
8. Krasowska H. Effect of micellar solubilization on the gastrointestinal absorption of
indomethacin in the rate. Int. J. Pharm, 1980; 7: 137–143.
9. Nokhodchi A., Javadzadeh Y, Siahi-Shadbad MR, Barzegar- Jalali M. The effect of type
and concentration of vehicles on the dissolution rate of poorly soluble drug
(indomethacin) from liquisolid compacts. J. Pharm. Pharmac. Sci, 2005; 8: 18–25.
10.Habib MJ, Akogyeram C, Ahmadi B.. Improved dissolution of indomethacin in co
precipitates with phospholipids. Part 1. Drug Dev. Ind. Pharm, 1993; 19: 499–505.
11.Allahham A, Stewart PJ. Enhancement of the dissolution of indomethacin in interactive
mixtures using added fine lactose. Eur. J. Pharm. Biopharm, 2007; 67: 732–742.
12.Cavallari C, Luppi B, Di Pietra AM, Rodriguez L, Fini A. Enhanced release of
indomethacin from Pvp/stearic acid microcapsules prepared coupling Co-freeze-drying
and ultrasound assisted spray-congealing process. Pharm. Res., 2007; 24: 521–529.
13.Valizadeh H, Nokhodchi A, Qarakhani N, Zakeri-Milani P, Azarmi S, Hassanzadeh DL,
Lo¨ benberg R. Physicochemical characterization of solid dispersions of indomethacin
with PEG 6000, Myrj 52, lactose, sorbitol, dextrin, and Eudragit E 100. Drug Dev. Ind.
Pharm, 2004; 30: 33–317.
14.Mahmoud E, Gihan F, Mohamed F. Improvement of solubility and dissolution rate of
indomethacin by solid dispersions in Gelucire 50/13 and PEG 4000. Saudi Pharm J.,
2009; 17: 217–225.
15.Bandi N, Wei W, Roberts CB, Kotra LP, Kompella UB. Preparation of budesonide and
indomethacin–hydroxy-propylbeta- cyclodextrin (HPBCD) complexes using a
single-step, organic-solvent-free supercritical fluid process. Eur. J. Pharm. Sci., 2004; 23: 159–
168.
16.Jambhekar S, Casella R, Maher T. The physicochemical characteristics and
bioavailability of indomethacin from betacyclodextrin, hydroxyethyl-beta-cyclodextrin,
and hydroxylpropylbeta- cyclodextrin complexes. Int. J. Pharm, 2004; 270: 149–166.
17.Sengodan guruswamy V, Mishra DN. Preparation and evaluation of solid dispersion of
meloxicam with skimmed milk. The Pharmaceutic. Soc. Jap., 2006; 126(2): 93-97.
18.Sridhar A, Doshi BJ, Wankhede V, Doshi J. Solid Dispersions: An Approach to Enhance
Solubility of poorly Water Soluble Drug. J Scient Innov Res., 2013; 2(3): 685-694.
19.Baghel S, Cathcart H, O'Reilly NJ. Polymeric amorphous solid dispersions: a review of
www.wjpr.net Vol 5, Issue 7, 2016.
84 solubilization of biopharmaceutical classification system class ii drugs. Journal of
Pharmaceutical Sciences xxx, 2016; 1-18.
20.Vasconcelos T, Sarmento B, Costa P. Solid dispersions as strategy to improve oral
bioavailability of poor water soluble drugs. Drug Discov. Today, 2007; 12: 1068-1075.
21.Leuner C, Dressman J. Improving drug solubility for oral delivery using solid dispersions.
Eur. J. Pharm. Biopharm, 2000; 50: 47– 60.
22.Craig DQM. The mechanisms of drug release from solid dispersions in water-soluble
polymers. Int. J. Pharm, 2002; 231: 131–144.
23.Lin CW, Cham TM. Effect of particle size on the available surface area of nifedipine
from nifedipine–polyethylene glycol 6000 solid dispersions. Int. J. Pharm, 1996; 127:
261–272.
24.Liu C, Desai KG. Characteristics of rofecoxib-polyethylene glycol 4000 solid dispersions
and tablets based on solid dispersions. Pharm. Dev. Technol, 2005; 10: 467–477.
25.Ahuja N, Katare OP, Singh B. Studies on dissolution enhancement and mathematical
modeling of drug release of a poorly water-soluble drug using water soluble carriers. Eur.
J. Pharm. Biopharm, 2007; 65: 26–38.
26.Wulff M, Alden M, Craig DQM. An investigation into the critical surfactant
concentration for solid solubility of hydrophobic drug in different polyethylene glycols.
Int. j Pharm, 1996; 142: 189-198.
27.Mehnet KA, Kislalioglu MS, Phuapradit W., Malik WA, Shah NH. Multi- unit controlled
release systems of nifedipine and nifedipine: Pluroni F-68 solid dispersion. Drug dev Ind
Pharm, 2002; 28.
28.Ozkan Y, Do anay N, Dikmen N. Enhanced release of solid dispersions of etodolac in
polyethylene glycol. II Farmaco, 2000; 55: 433-438.
29.Okonogi S, Yonemochi E, Oguchi T, Puttipipatkhachorn S, Yamamoto K. Enhanced
dissolution of ursodeoxycholic acid from the solid dispersion. Drug Dev. Ind. Pharm,
1997; 23: 1115-1121
30.Urbanetz N, Stabilization of solid dispersions of nimodipine and polyethylene glycol
2000. Eur J Pharm Sci., 2006; 28: 67-76.
31.Kim K T, Lee JY, Lee MY, Song CK, Choi J, Kim D. Solid Dispersions as a Drug
Delivery System. Journal of Pharmaceutical Investigation, 2011; 41(3): 125-142.
32.Greenhalgh DJ, Williams AC, Timmins P, York P. Solubility parameters as predictors of
www.wjpr.net Vol 5, Issue 7, 2016.
85 33.Timko RJ, Lordi NG. Thermal analysis studies of glass dispersion systems. Drug Dev Ind
Pharm., 1984; 10: 425-451.
34.Damian F, Blaton N, Kinget R, Van den Mooter G. Physical stability of solid dispersions
of the antiviral agent UC-781 with PEG 6000, Gelucire 44/14 and PVP K30. Int J Pharm.,
2002; 244: 87-98.
35.Anshu Sharma1, C.P. Jain. Solid dispersion: A promising technique to enhance solubility
of poorly water soluble drug International Journal of Drug Delivery, 2011; 3: 149-170.
36.Sachin, Patil, Ravi K, Patil MB, Paschapur SM, Rao VSNM. Journal of Pharm Tech Res.,
2009; 1(4): 1198-1204.
37.Okorie O, Nwachukwu N, Ibezim CNE. Preliminary evaluation of chloroquine phosphate
tablets obtained using defatted Detarium microcarpium (squill & sperr) gum as a binder.
Int J Pharmaceu Sci Rev Re., 2011; 9(1): 1–17.
38. Aulton ME. Pharmaceutics; the Science of Dosage Form Design, 3rd Edn. Churchill Living Stone, Edinburgh, 2007; 197-210.
39.Ngwuluka NC, Idiakhoa BA, Nep EI, Ogaji I, Okafor SI. Formulation and evaluation of
paracetamol tablets manufactured using the dried fruit of Phoenix dactylifera Linn as an
excipient. Res. Pharm. Biotech., 2010; 2(3): 25-32.
40.Yüksel N, Türkmen B, Kurdoğlu AH, Başaran B, Erkin J, Baykara T. Lubricant
efficiency of magnesium stearate in direct compressible powder mixtures comprising
cellactose® 80 and pyridoxine hydrochloride. FABAD J. Pharm. Sci., 2007; 32: 173-183. 41.Chime SA, Brown SA, Ugwu CE, Agubata CO, Obidike TC, Onunkwo GC. Effect of
binder type and concentration on the in vitro properties of alstonia boonei tablets. Int. J.
Pharm. Sci. Rev. Res., 2012; 16(2): nᵒ 02, 5-9.
42.Agubata CO, Nzekwe TI, Attama AA, Mueller-Goymann CC, Onunkwo GC.
Formulation, characterization and anti-malarial activity of homolipid-based artemether
microparticles. Int. J. Pharmaceutics, 2014b ; 478: 202-222.
43.Vilhelmsen T. Effect of a melt agglomeration process on agglomerates containing solid
dispersions. Int. J. Pharm., 2005; 303: 132–142.
44.Singh A, Sharma PK, Meher JG, Malviya R. “Enhancement of Solubility of Paracetamol
solid dispersion technique using different Polymers concentration”. Asian J Pharm Clin
Res., 2011; 4(1): 0974-2441.
45.Vanden Mooter G. Evaluation of Inutec SP1 as a new carrier in the formulation of solid
www.wjpr.net Vol 5, Issue 7, 2016.
86 46.Li FQ. In vitro controlled release of sodium ferulate from Compritol 888 ATO-based
matrix tablets. Int. J. Pharm, 2006; 324: 152–157.
47.Passerini N, Albertini B, González-Rodriguez ML, Cavallari C, Rodriguez L. Preparation
and characterization of ibuprofen-poloxamer 188 agglomerates obtained by melt
granulation. Eur J Pharm Biopharm, 2002; 15: 71–78.
48.Serajuddin ATM, Sheen PC, Mufson D, Bernstein DF, Augustine MA. Effect of vehicle
amphiphilicity on the dissolution and bioavailability of a poorly water-soluble drug from
solid dispersions. J Pharm Sci., 1988; 77: 414–417.
49.Seo A, Holm P, Kristensen HG, Schæfer T. The preparation of agglomerates containing
solid dispersions of diazepam by melt agglomeration in a high shear mixer. Int J Pharm,
2003; 259: 161–171.
50.Chinaeke EE, Chime SA,. Kenechukwu FC, Müller-Goymann CC, Attama AA, Okore
VC. Formulation of novel artesunate-loaded solid lipid microparticles (SLMs) based on
dika wax matrices: in vitro and in vivo evaluation J. Drug Del. Sci. Tech., 24(1) 69-77
2014.
51.Umeyor EC, Kenechukwu FC, Ogbonna JD, Chime SA, Attama AA. Preparation of
novel solid lipid microparticles loaded with gentamicin and its evaluation in vitro and in
vivo. J. Microencapsul., 2012; 1-12, doi: 10.3109/02652048.2011.651495
52.Attama AA, Muller-Goymann CC. A critical study of novel physically structured lipid
matrices composed of a homolipid from Capra hircus and theobroma oil. Int. J. Pharm,
2006; 322: 67-78.
53.Sanna V, Kirschvink N, Gustin P, Gavini E, Roland I, Delattera, Evrad B. Preparation
and in vivo toxicity study of solid lipid microparticles as carrier for pulmonary
administration. AAPS Pharm. Sci. Tech., 200; 45(2): e27.
54.Moghimi HR, Williams AC, Barry BW. A lamellar matrix model for stratum corneum
intercellular lipids. I. Characterization and comparison with stratum corneum intercellular