Available Online at www.ijpret.com 181
INTERNATIONAL JOURNAL OF PURE AND
APPLIED RESEARCH IN ENGINEERING AND
TECHNOLOGY
A PATH FOR HORIZING YOUR INNOVATIVE WORK
THE EFFECT OF SEISMIC ZONES OF ELEVATED RC WATER TANK ON THE
RESPONSE REDUCTION FACTOR
SHRIRANG BORKAR, ATUL KURZEKAR, V. G. MESHRAM Civil engineering department YCCE, NAGPUR, Maharashtra, INDIA
Accepted Date: 15/03/2016; Published Date: 01/05/2016
\
Abstract:The most important design key of earthquake resistance design of structures is that the structure should not collapse but rupture to the structural elements is acceptable. Response reduction factor is the factor by which the real design base shear force should be reduced, to obtain the design lateral force. The response reduction factor is depends on Over strength, Ductility, Redundancy. In the present study efforts are made to estimate the response reduction factor of RC framed staging elevated water tanks having staging height of 15 m, 18 m and 21 m but having varying capacities. The special effects of seismic zone and fundamental time period of water tank on the Response reduction factor are also discuss. Displacement controlled nonlinear pushover analysis is used to estimate the base shear capacity and ductility of tanks. It is found that value of R for elevated water tank is extensively affected by the time period, seismic zone and capacity of tanks. Observations during many earthquakes have shown that engineering structures are itself capable to sustain earthquake forces considerably larger than those they were designed for without damage. The seismic codes now absolutely depend on such reserve strength. The feasible sources of such strength are summarized and it is reasoned that a more balanced origin for design would be to account for such sources in assessing the capacity rather than in reducing the design loads.
Key words: Response reduction factor, Seismic design, static nonlinear pushover analysis
Corresponding Author: MR. SHRIRANG BORKAR
Access Online On:
www.ijpret.com
How to Cite This Article:
Shrirang Borkar, IJPRET, 2016; Volume 4 (9): 181-200
Available Online at www.ijpret.com 182
INTRODUCTION
The idea of response reduction factor is based on the observations that well detailed seismic framing systems can sustain huge inelastic deformations without collapse and have excess of lateral strength over design strength. Response reduction factors are essential seismic design tools, which are typically used to describe the level of inelasticity likely in lateral structural systems during an earthquake. The response reduction factor is depends on structural over strength, ductility, structural redundancy. According to ATC-19, it is described as
R = Rs * RR * Rµ.
Where, R - response reduction factor
Rs - Over strength
RR – Redundancy
Rµ - Ductility
Over strength factor account for the yielding of a structure at load higher than the design load due to various Partial safety factors, oversized members, strain hardening, confinement of concrete. Non-structural elements also contribute to the over strength. Ductility factor is a ratio of ultimate displacement or code specified permissible displacement to the yield displacement. Higher ductility implies that the structure can resist stronger shaking without collapse. Structural redundancy factor depends on the number of vertical framing system contribute in seismic resistance. Yielding at one location in the structure does not mean yielding of the structure as a whole. Hence the load distribution, due to redundancy of the structure, provides further safety margin. The structural over strength factor, ductility factor and structural redundancy factor can be workout on the basis of generalized pushover curve.
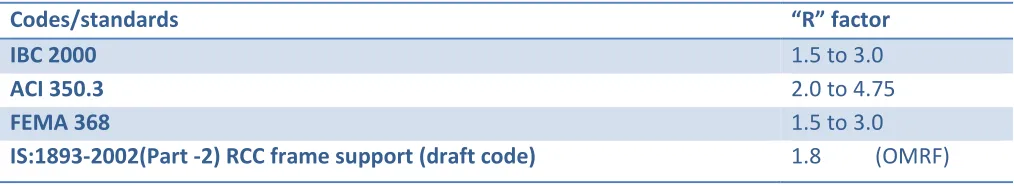
Table 1: “R” factor as per international standards for elevated water tank
Codes/standards “R” factor
IBC 2000 1.5 to 3.0
ACI 350.3 2.0 to 4.75
FEMA 368 1.5 to 3.0
Available Online at www.ijpret.com 183
2.5 (SMRF)
One constant response reduction factor value for RC elevated water tank cannot replicate the probable inelastic behavior of all elevated water tanks having different capacities and located in different seismic zone. The causes of seismic zone and fundamental time period of RC elevated water tank on the Response reduction factor are also considered. In the present study the gravity load analysis and lateral load analysis as per the seismic code IS 1893 (Part 1): 2002 are carried out on water tank and an effort is made to study the effect of seismic loads on them and their capacity and demand is evaluated using nonlinear static pushover analysis guidelines given in ATC-40.
STRUCTURAL MODELING
The RC columns and beams are modeled as three dimensional frame elements with centerline dimension. Slabs are modeled as thick shell elements and are assumed to behave as rigid diaphragms. Column foundations are assumed to be fixed. Damping ratio of 5 percent is assumed for all natural modes. For the nonlinear static push over analysis, rigid zone factor of unity is assigned to column-beam joints. Axial compressive force (P), axial biaxial moment (PM2M3) and Flexure moment (M3) hinges are assigned at the face of column, beam, and Bracing respectively. The ATC [40] document for concrete building gives modeling procedures for pushover analysis. This document defines force-deformation criteria for hinges used in pushover analysis.
Available Online at www.ijpret.com 184
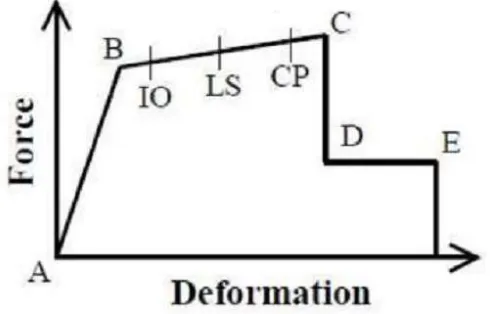
As shown in Figure.1 , five points labeled A, B, C, D, and E are used to define the force deformation behavior of the hinge and three points labeled IO, LS and CP are used to define the acceptance criteria for the hinge. (IO, LS and CP stand for Immediate Occupancy, Life Safety and Collapse Prevention respectively). The values assigned to each of these points vary depending on the type of member as well as many other parameters defined in the ATC-40. Applied Technology Council-40 has developed acceptance criteria, modeling procedure and analysis procedures for pushover analysis. It defines force-deformation criteria for hinges used in pushover analysis. SAP 2000 software is used to perform the static pushover analysis. The user establishes grid lines and places structural objects relative to the grid lines using areas, lines and points and assigns loads and structural properties to those structural objects. The program simplifies seismic analysis by providing modeling characteristics such as rigid diaphragms to model slabs. Analysis and design are performed based on the structural objects and it can take the results of an analysis as input to classify the pinned properties of members so that pushover analysis can be carried out.
Water tank description
In the current study elevated water tanks rectangle in plan are considered for different staging height. For 150 m3 and 200 m3 capacity tanks has a staging configuration of 9 columns, 3x 3 grid
in X-direction and Y –direction as shown in Figure 2. For 400 m3 and 600 m3 capacity tanks has a
staging configuration of 16 columns, 4 x 4 grid in X-direction and Y direction as shown in Figure 3. For uniformity and simplicity, all beam sizes, bracing sizes and column sizes are kept even. All structural members are designed and ductile detailing as per IS 13920 .For deriving relations with response reduction factor against zones, following models are considered. 15m, 18m and 21m staging height with 150 m3, 200 m3,400 m3 and 600 m3 capacity of tank for seismic zones II,
III, IV , V .
Design data for the water tank considered are as follows:
Grade of steel Fe415, concrete M20, density of concrete = 25kN/m3, Elastic modules of concrete
(Ec) = 22.36×10⁵ kN/m2, live load intensities for roof slab =1.25kN/m2. In the seismic weight
Available Online at www.ijpret.com 185
Figure 2- Staging Configuration for 150 m3, and 200 m3 capacity tanks.
Figure 3-Staging configuration for 400 m3, and 600 m3 capacity tanks.
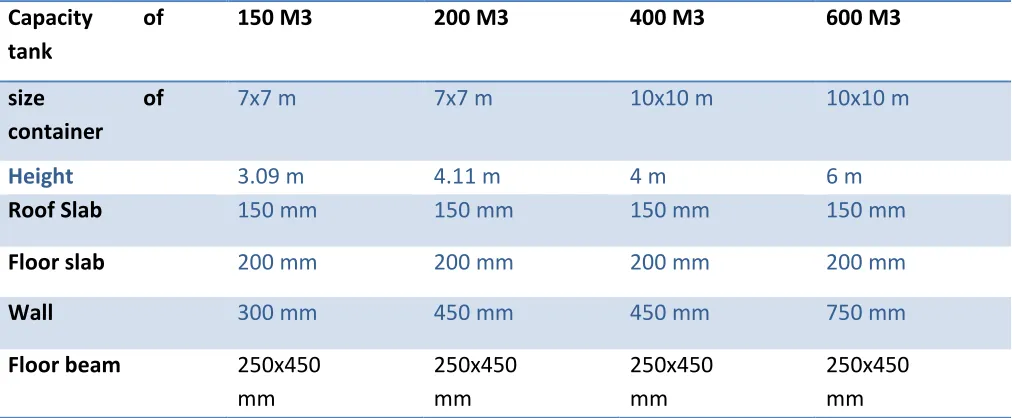
Table 2- Water tank description
Capacity of tank
150 M3 200 M3 400 M3 600 M3
size of
container
7x7 m 7x7 m 10x10 m 10x10 m
Height 3.09 m 4.11 m 4 m 6 m
Roof Slab 150 mm 150 mm 150 mm 150 mm
Floor slab 200 mm 200 mm 200 mm 200 mm
Wall 300 mm 450 mm 450 mm 750 mm
Floor beam 250x450
mm
250x450 mm
250x450 mm
Available Online at www.ijpret.com 186
Braces 250x300
mm
250x300 mm
250x300 mm
250x300 mm
column 500x500
mm
500x500 mm
600x600 mm
600x600 mm
No. of column 9 9 16 16
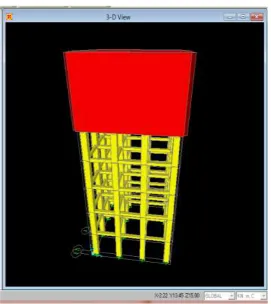
Figure 4- 3D view of tank modeled in sap 2000
ANALYSIS PROCEDURE
Developing a three dimensional model of RCC frame
1st step is application of gravity loads, live loads, water load, etc.
Available Online at www.ijpret.com 187
3rd step is to pushing the structure using the pushover load patterns of static lateral loads, to
displacements larger than those associated with target displacement using nonlinear static pushover analysis.
4th step is to developing pushover curve and finding the forces and deformations in each
element at the level of displacement corresponding to target displacement.
Available Online at www.ijpret.com 188
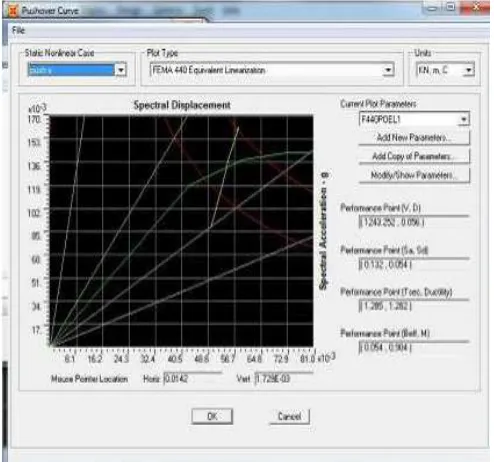
RESULTS AND DISCUSSIONS
For 600 m3 capacity tank
Estimation of strength factor:
Maximum Base Shear V0= 1243.78 k N (from pushover curve)
Design Base shear VD = 304.72 k N (as per EQ calculation)
Using equation for Over strength factor, given in ATC – 19
RS= V0 / VD = 1243.78 / 304.72 = 4.08
RS = 4.08
Estimation of ductility factor:
Maximum drift capacity Delta m = 85mm (0.004 H)
Yield drift Delta y = 56 mm (from pushover curve)
Using equation for displacement ductility ratio, given in ATC – 19
µ = Delta m / Delta y = 85 / 56 = 1.51
(Using for ductility factor derived by, Miranda and Bertero)
Rµ = ((µ - 1/Φ) + 1)
Φ for hard soil
Φ = 0.65
Rµ = 1.78
Available Online at www.ijpret.com 189
Estimation of redundancy factor:
Table-3 From ATC – 19 Lines of vertical seismic framing
Lines of vertical seismic Framing
Drift redundancy factor
2 0.71
3 0.86
4 1
RR = 1
Estimation of response reduction factor R:
R = Ro x Rµ x RR
R = 4.08 x 1.78 x 1
R = 7.26
Hence the value of response reduction factor
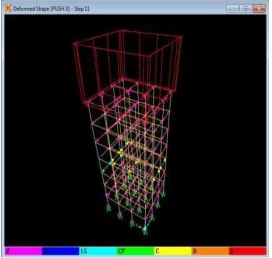
Available Online at www.ijpret.com 190
Figure 6– Hinges Formation for 600 m3 capacity tank
Result for different cases
Table 4- Result of 150 m3 capacity for 15 m staging height
15 m Staging
Col- 500x500 – 10 # 20 Col – 500x500 – 14 # 20
Zone 2 Zone 3 Zone 4 Zone 5
Empt y
Full Empt
y
Full Empt
y
Full Empt
y
Full
Time period
0.68 1.02 0.68 1.02 0.68 1.0
2
0.68 1.0
2
Ductility Ratio (µ)
1.52 1.57 2.21 2.62 1.53 1.5
7
1.53 1.5
6
Ductility Factor (Rµ)
4.25 2.16 5.56 3.07 4.31 2.1
6
3.20 3.1
5
Redundanc y Factor ( RR )
0.86 0.86 0.86 0.86 0.86 0.8
6
0.86 0.8
6
Over Strength Factor (Rs)
6.25 10.5
3
3.91 6.28 3.78 4.9
0
2.72 2.6
9
Response Reduction Factor
22.84 19.5
6
18.69 16.5
8
14.01 9.1
0
7.48 7.2
Available Online at www.ijpret.com 191
Table 5- Result of 150 m3 capacity for 18 m staging height
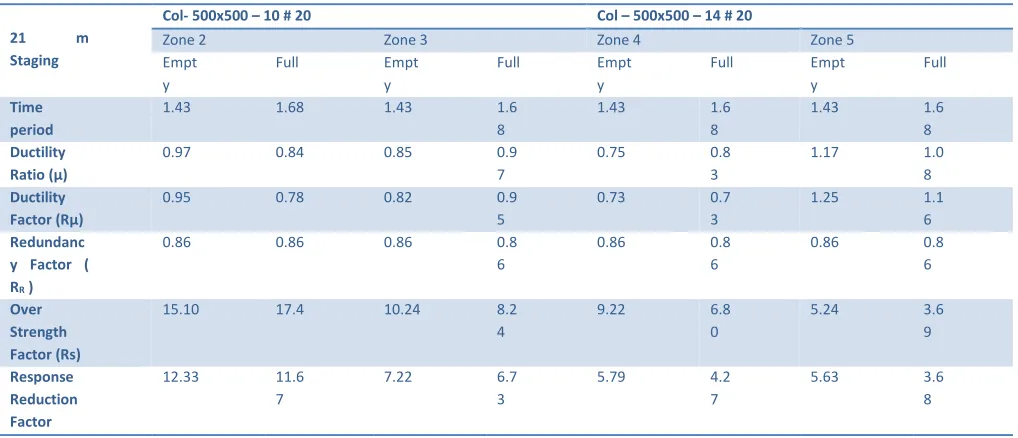
Table 6- Result of 150 m3 capacity for 21 m staging height
18 m Staging
Col- 500x500 – 10 # 20 Col – 500x500 – 14 # 20
Zone 2 Zone 3 Zone 4 Zone 5
Empt y
Full Empt
y
Full Empt
y
Full Empt
y
Full
Time period
1.13 1.38 1.13 1.38 1.13 1.3
8
1.13 1.3
8
Ductility Ratio (µ)
1.25 1.15 1.76 2.12 1.30 1.2
8
1.48 1.4
0
Ductility Factor (Rµ)
2.25 1.26 3.24 1.87 1.67 1.6
3
1.52 1.4
5
Redundanc y Factor ( RR )
0.86 0.86 0.86 0.86 0.86 0.8
6
0.86 0.8
6
Over Strength Factor (Rs)
9.57 14.2
0
4.21 7.08 5.13 4.3
5
4.87 4.7
6
Response Reduction Factor
18.52 15.3
8
11.73 11.3
8
7.37 6.0
9
6.37. 5.9
4
21 m Staging
Col- 500x500 – 10 # 20 Col – 500x500 – 14 # 20
Zone 2 Zone 3 Zone 4 Zone 5
Empt y
Full Empt
y
Full Empt
y
Full Empt
y
Full
Time period
1.43 1.68 1.43 1.6
8
1.43 1.6
8
1.43 1.6
8
Ductility Ratio (µ)
0.97 0.84 0.85 0.9
7
0.75 0.8
3
1.17 1.0
8
Ductility Factor (Rµ)
0.95 0.78 0.82 0.9
5
0.73 0.7
3
1.25 1.1
6
Redundanc y Factor ( RR )
0.86 0.86 0.86 0.8
6
0.86 0.8
6
0.86 0.8
6
Over Strength Factor (Rs)
15.10 17.4 10.24 8.2
4
9.22 6.8
0
5.24 3.6
9
Response Reduction Factor
12.33 11.6
7
7.22 6.7
3
5.79 4.2
7
5.63 3.6
Available Online at www.ijpret.com 192
Figure 7- Variation Of RRF with the Zones
0 5 10 15 20 25
1 2 3 4
R esp o n se R ed u ct io n Fa ct o r Seismic Zones
Variation Of RRF for 150 m3(Tank Full
)
15 m Staging
18 m Staging
21 m Staging
Figure 8- Variation Of RRF with the Zones
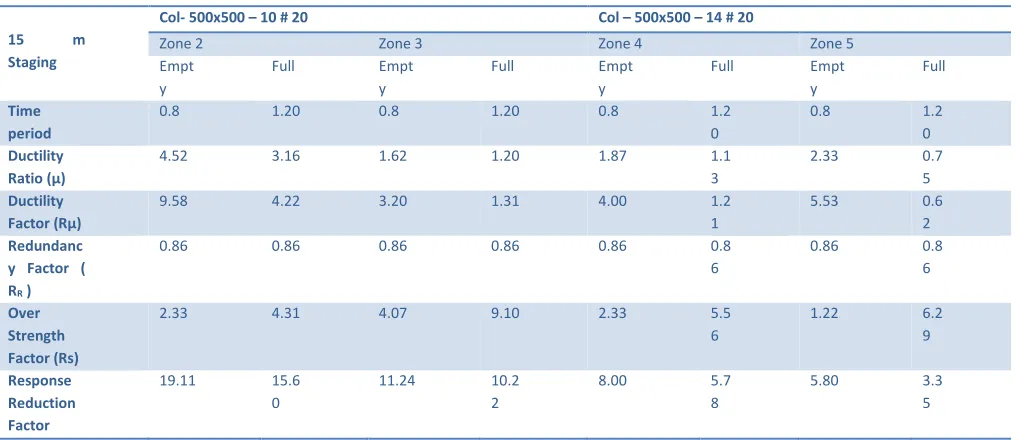
Table 7- Result of 200 m3 capacity for 15 m staging height
Table 8- Result of 200 m3 capacity for 18 m staging height
15 m Staging
Col- 500x500 – 10 # 20 Col – 500x500 – 14 # 20
Zone 2 Zone 3 Zone 4 Zone 5
Empt y
Full Empt
y
Full Empt
y
Full Empt
y
Full
Time period
0.8 1.20 0.8 1.20 0.8 1.2
0
0.8 1.2
0
Ductility Ratio (µ)
4.52 3.16 1.62 1.20 1.87 1.1
3
2.33 0.7
5
Ductility Factor (Rµ)
9.58 4.22 3.20 1.31 4.00 1.2
1
5.53 0.6
2
Redundanc y Factor ( RR )
0.86 0.86 0.86 0.86 0.86 0.8
6
0.86 0.8
6
Over Strength Factor (Rs)
2.33 4.31 4.07 9.10 2.33 5.5
6
1.22 6.2
9
Response Reduction Factor
19.11 15.6
0
11.24 10.2
2
8.00 5.7
8
5.80 3.3
5
18 m Staging
Col- 500x500 – 10 # 20 Col – 500x500 – 14 # 20
Zone 2 Zone 3 Zone 4 Zone 5
Empt y
Full Empt
y
Full Empt
y
Full Empt
y
Full
Time period
0.95 1.46 0.95 1.4
6
0.95 1.4
6
0.95 1.4
6
Available Online at www.ijpret.com 193
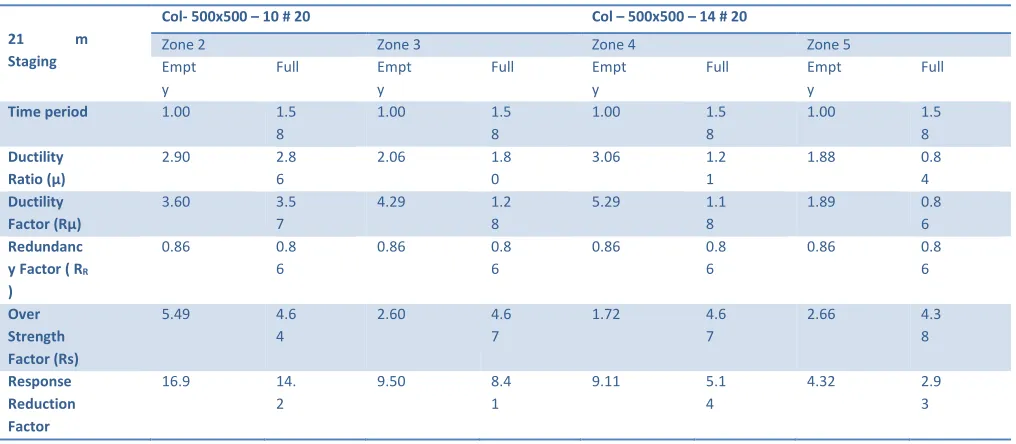
Table 9- Result of 200 m3 capacity for 21 m staging height
Ratio (µ) 5 9 0
Ductility Factor (Rµ)
6.50 3.96 3.60 1.3
0
4.75 1.2
0
4.06 0.7
8
Redundanc y Factor ( RR )
0.86 0.86 0.86 0.8
6
0.86 0.8
6
0.86 0.8
6
Over Strength Factor (Rs)
3.15 4.45 3.50 7.5
8
2.10 4.9
8
1.65 4.8
6
Response Reduction Factor
17.61 15.1
5
10.83 8.4
8
8.57 5.4
7
5.65 3.2
6
21 m Staging
Col- 500x500 – 10 # 20 Col – 500x500 – 14 # 20
Zone 2 Zone 3 Zone 4 Zone 5
Empt y
Full Empt
y
Full Empt
y
Full Empt
y
Full
Time period 1.00 1.5 8
1.00 1.5
8
1.00 1.5
8
1.00 1.5
8
Ductility Ratio (µ)
2.90 2.8
6
2.06 1.8
0
3.06 1.2
1
1.88 0.8
4
Ductility Factor (Rµ)
3.60 3.5
7
4.29 1.2
8
5.29 1.1
8
1.89 0.8
6
Redundanc y Factor ( RR
)
0.86 0.8
6
0.86 0.8
6
0.86 0.8
6
0.86 0.8
6
Over Strength Factor (Rs)
5.49 4.6
4
2.60 4.6
7
1.72 4.6
7
2.66 4.3
8
Response Reduction Factor
16.9 14.
2
9.50 8.4
1
9.11 5.1
4
4.32 2.9
Available Online at www.ijpret.com 194 0 5 10 15 20 25
2 3 4 5
R esp o n ce R ed u ct io n Fa ct o r Seismic Zones
Variation 0f RRF for 200 m3(Tank Empty
)
15 m Staging
18 m Staging
21 m Staging
Figure 9- Variation Of RRF with the Zones
0 5 10 15 20
1 2 3 4
R e sp o n se R e d u c ti o n F a c to r Seismic Zones
Variation Of RRF for 200 m3(Tank Full)
15 m Staging
18 m Staging
21 m Staging
Figure 10- Variation Of RRF with the Zones
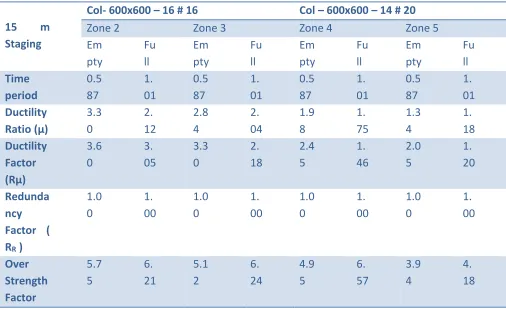
Table 10 -Result of 400 m3 capacity for 15 m staging height
15 m Staging
Col- 600x600 – 16 # 16 Col – 600x600 – 14 # 20
Zone 2 Zone 3 Zone 4 Zone 5
Em pty Fu ll Em pty Fu ll Em pty Fu ll Em pty Fu ll Time period 0.5 87 1. 01 0.5 87 1. 01 0.5 87 1. 01 0.5 87 1. 01 Ductility Ratio (µ) 3.3 0 2. 12 2.8 4 2. 04 1.9 8 1. 75 1.3 4 1. 18 Ductility Factor (Rµ) 3.6 0 3. 05 3.3 0 2. 18 2.4 5 1. 46 2.0 5 1. 20 Redunda ncy Factor ( RR )
Available Online at www.ijpret.com 195
Table 11- Result of 400 m3 capacity for 18 m staging height
Table 12- Result of 400 m3 capacity for 21 m staging height (Rs) Respons e Reductio n Factor 20. 7 18 .9 16. 89 13 .6 12. 13 9. 60 8.0 7 5. 02
18 m Staging
Col- 600x600 – 16 # 16 Col – 600x600 – 14 # 20
Zone 2 Zone 3 Zone 4 Zone 5
Empt y
Full Empt
y
Full Empt
y
Full Empt
y
Full
Time period
0.615 1.12 0.615 1.12 0.615 1.1
2
0.615 1.1
2
Ductility Ratio (µ)
3.34 1.85 2.43 1.47 1.95 1.1
0
1.45 1.0
1
Ductility Factor (Rµ)
5.27 2.94 3.16 1.73 2.41 1.3
0
1.80 1.3
5
Redundanc y Factor ( RR )
1.00 1.00 1.00 1.00 1.00 1.0
0
1.00 1.0
0
Over Strength Factor (Rs)
3.23 5.17 4.16 5.87 3.84 4.6
3
2.87 3.0
1
Response Reduction Factor
17.03 15.2
2
13.15 10.1
6
9.28 6.0
2
5.18 4.0
9
21 m Staging
Col- 600x600 – 16 # 16 Col – 600x600 – 14 # 20
Zone 2 Zone 3 Zone 4 Zone 5
Empt y
Full Empt
y
Full Empt
y
Full Empt
y
Full
Time period
0.675 1.15 0.675 1.1
5
0.675 1.1
5
0.675 1.1
5
Ductility Ratio (µ)
4.22 3.26 1.52 1.3
0
1.96 1.2
2
2.45 0.8
4
Ductility Factor (Rµ)
6.98 3.72 3.79 1.5
8
2.54 1.3
2
3.43 0.6
9
Redundanc y Factor ( RR )
1.00 1.00 1.00 1.0
0
1.00 1.0
0
1.00 1.0
0
Over Strength Factor (Rs)
2.81 3.02 2.65 5.3
7
2.74 3.2
2
1.11 4.5
Available Online at www.ijpret.com 196 0 5 10 15 20 25
2 3 4 5
R e sp o n c e R e d u c ti o n F ac to r Seismic Zones
Variation 0f RRF for 200 m3(Tank
Empty
)
15 m Staging
18 m Staging
21 m Staging
Figure 11- Variation Of RRF with the Zones
0 5 10 15 20
1 2 3 4
R e s p o n s e R e d u c ti o n F a c to r Seismic Zones
Variation Of RRF for 200 m3 (Tank Full)
15 m Staging
18 m Staging
21 m Staging
Figure 12- Variation Of RRF with the Zones
Table 13- Result of 600 m3 capacity for 15 m staging height
Response Reduction Factor
15.26 11.2
3
10.05 8.4
8
6.95 4.2
5
3.80 3.1
5
15 m Staging
Col- 600x600 – 16 # 16 Col – 600x600 – 14 # 20
Zone 2 Zone 3 Zone 4 Zone 5
Empt y
Full Empt
y
Full Empt
y
Full Empt
y
Full
Time period 0.677 1.1 8
0.677 1.1
8
0.677 1.1
8
0.677 1.1
8
Ductility Ratio (µ)
2.30 1.6
2
1.86 1.4
9
1.84 1.5
1
1.47 1.1
0
Ductility Factor (Rµ)
3.00 1.9
5
2.32 1.7
6
4.66 1.2
6
3.06 1.1
5
Redundanc y Factor ( RR
)
1.00 1.0
0
1.00 1.0
0
1.00 1.0
0
1.00 1.0
0
Over Strength Factor (Rs)
6.19 6.7
4
6.62 6.6
1
2.41 5.7
6
2.91 3.5
0
Response Reduction Factor
18.5 13.
1
15.3 11.
6
11.23 7.2
6
8.9 4.0
Available Online at www.ijpret.com 197
Table 14- Result of 600 m3 capacity for 18 m staging height
Table 15- Result of 600 m3 capacity for 21 m staging height
18 m Staging
Col- 600x600 – 16 # 16 Col – 600x600 – 14 # 20
Zone 2 Zone 3 Zone 4 Zone 5
Empt y
Full Empt
y
Full Empt
y
Full Empt
y
Full
Time period
0.730 1.20 0.730 1.2
0
0.730 1.2
0
0.730 1.2
0
Ductility Ratio (µ)
3.00 1.95 1.73 1.3
7
1.85 1.4
0
2.05 1.0
1
Ductility Factor (Rµ)
5.75 2.43 2.78 1.5
0
4.30 1.2
4
4.39 0.9
0
Redundanc y Factor ( RR )
1.00 1.00 1.00 1.0
0
1.00 1.0
0
1.00 1.0
0
Over Strength Factor (Rs)
3.10 5.07 5.20 7.2 2.14 5.5
0
1.59 4.1
0
Response Reduction Factor
17.83 12.3
2
14.45 10.
8
9.20 6.8
2
6.98 3.6
9
21 m Staging
Col- 600x600 – 16 # 16 Col – 600x600 – 14 # 20
Zone 2 Zone 3 Zone 4 Zone 5
Empt y
Full Empt
y
Full Empt
y
Full Empt
y
Full
Time period
0.755 1.22 0.755 1.2
2
0.755 1.2
2
0.755 1.2
2
Ductility Ratio (µ)
4.52 3.16 1.62 1.2
0
1.87 1.1
3
2.33 0.7
5
Ductility Factor (Rµ)
7.58 3.12 3.20 1.3
1
4.00 1.2
1
5.53 0.6
2
Redundanc y Factor ( RR )
1.00 1.00 1.00 1.0
0
1.00 1.0
0
1.00 1.0
0
Over Strength Factor (Rs)
2.33 3.91 4.07 9.1 2.33 5.5
6
1.22 6.2
9
Response Reduction Factor
17.66 12.2
0
11.2 10.
2
8.00 5.7
8
5.80 3.3
Available Online at www.ijpret.com 198 0
5 10 15 20
2 3 4 5
R
es
p
o
n
ce
R
ed
u
cti
o
n
F
ac
to
r
Seismic Zones
Variation 0f RRF for 600 m3(Tank Empty)
15 m Staging
18 m Staging
21 m Staging
Figure 13- Variation Of RRF with the Zones
0 2 4 6 8 10 12 14
1 2 3 4
R
e
sp
o
n
se
R
e
d
u
c
ti
o
n
F
ac
to
r
Seismic Zones
Variation Of RRF for 600 m3(Tank Full)
15 m Staging
18 m Staging
21 m Staging
2016; Volume 4 (9): 181-200 IJPRET
Available Online at www.ijpret.com 199
CONCLUSION:
Based on analytical investigations and tank details assumed,
Following conclusions are arrived:
1. The ‘R’ factor reduces as zone increases.
2. T o ensure the consistent level of damage, values of R should depend on both fundamental period of the staging and the soil type.
3. The values assigned to R for a given framing system should vary between seismic zones. Also detailing requirements vary by zone.
4. Estimation of R factor with exact analysis will help in an economical design.
5. It is observed that R factor varies from 4.32 to 8.90, for tank empty condition in Zone V.
Notations:
DL – Dead Load, LL – Live Load, EL -Earthquake load, VB– Design seismic base shear,
Rµ – Ductility factor, u – Displacement ductility ratio, RR– Redundancy factor, RS–
Strength factor, V0– Maximum design base shear force, m – Maximum drift capacity,
Delta y – Yield drift, VD– Design base shear force, IO – Immediate Occupancy, LS – Life
Safety, CP – Collapse Prevention.
REFERENCES
1. ATC-19, ‘Structural response modification Factors’, 1995. 2. ATC 40 (1996): “Seismic Evaluation and Retrofit of
3. Concrete Buildings”, V olume1, A TC-40 Report, Applied T echnology Council, Redwood City , California.
4. Andrew Whittker , Gary hart and Christopher Rojahn, “Seismic Response Modification Factors”, journal of structural engineering, V ol.125, April 1999. period buildings’, Earthquake Spectra, V ol. 5, No. 3, pp.571-590, (1989).
2016; Volume 4 (9): 181-200 IJPRET
Available Online at www.ijpret.com 200
6. Ankush N. Asati (KaduP.G. Student, Civil Engineering Department, Shri Ramdeobaba College of Engineering and Management , Nagpur), Dr. Mahendra S.Kadu (Prof. & Head of Civil Engineering Department, Shri Ramdeobaba College of Engineering and Management, Nagpur), Seismic Investigation of RC Elevated Water Tank for Different Types of Staging Patterns, International Journal of Engineering Trends and Technology (IJETT) – Volume 14 Number 1 – Aug 2014 ISSN: 2231-5381.
7. Bhavin Patel and Dhara shah, (2010), Formulation of Response Reduction Factor for RCC Framed Staging of Elevated Water Tank, World Congress on Engineering , London ,U.K
8. Bojja Devadanam, M K MV Ratnam, Dr.U Ranga Raju, Effect of Staging Height on the Seismic Performance of RC Elevated Water Tank, International Journal of Innovative Research in Science, Engineering and Technology (An ISO 3297: 2007 Certified Organization) Vol. 4, Issue 1, January 2015
9. Dr. O. R. Jaiswal (Department of Applied Mechanics Visvesvaraya National Institute of Technology Nagpur) Dr. Durgesh C Rai, Dr. Sudhir K Jain (Department of Civil Engineering Indian Institute of Technology Kanpur, Kanpur), Review of Code Provisions on Design Seismic Forces for Liquid Storage Tanks
10. Dr. S. N. Tande (H.O.D., Department of Applied Mechanics, Walchand college of Engineering, Sangli), R. V. Ambekar (Department of Applied Mechanics, Walchand college of Engineering, Sangl), An Investigation of Seismic Response Reduction Factor for Earthquake Resistant Design, International Journal of Latest Trends in Engineering and Technology (IJLTET)
11. Gholamreza Abdollahzadeh and Amirhosein Maleki Kambakhsh (Civil Engineering, Babol Noushirvani University of Technology, IRAN), Height Effect on Response Modification Factor of Open Chevron Eccentrically Braced Frames, Iranica Journal of Energy & Environment 3 (1): 72-77, 2012
12. Harshal Nikhade, Ajay Dandge, Anshul Nikhade, Dynamic analysis of circular water tank and study of relevant codal provision, International Journal of Scientific & Engineering Research, Volume 4, Issue 11, November-2013 1551 ISSN 2229-5518 IJSER © 2013