in the population sciences published by the Max Planck Institute for Demographic Research Konrad-Zuse Str. 1, D-18057 Rostock · GERMANY www.demographic-research.org
DEMOGRAPHIC RESEARCH
VOLUME 18, ARTICLE 9, PAGES 263-284
PUBLISHED 15 APRIL 2008
http://www.demographic-research.org/Volumes/Vol18/9/ DOI: 10.4054/DemRes.2008.18.9
Research Article
Cohort fertility patterns and breast cancer
mortality among U.S. women, 1948-2003
Patrick M. Krueger
Samuel H. Preston
© 2008 Krueger & Preston.
This open-access work is published under the terms of the Creative Commons Attribution NonCommercial License 2.0 Germany, which permits use, reproduction & distribution in any medium for non-commercial purposes, provided the original author(s) and source are given credit.
1 Introduction and background 264
2 Data and methods 265
2.1 Missing data 266
2.2 Analyses 269
3 Results 269
4 Discussion 275
5 Conclusion 277
6 Acknowledgements 278
References 279
Cohort fertility patterns and breast cancer mortality among
U.S. women, 1948-2003
Patrick M. Krueger1 Samuel H. Preston2
Abstract
Epidemiological research has shown that women who have early and numerous births have reduced risks of being diagnosed with breast cancer. We use U.S. Vital Statistics and Census data and age-period-cohort models to examine whether cohort fertility patterns are associated with breast cancer mortality rates among women aged 40 and older in 1948-2003. Cohorts marked by higher proportions childless at ages 15-24 and lower cumulative second birth rates at ages 15-29 have higher rates of breast cancer mortality. This is the first demonstration that cohort fertility patterns have left a clear imprint on trends in U.S. breast cancer mortality rates.
1 University of Texas-Houston School of Public Health, Division of Management, Policy, and Community
Health; University of Texas-Austin Population Research Center; University of Pennsylvania, Leonard Davis Institute of Health Economics. E-mail: [email protected]
2 University of Pennsylvania, Department of Sociology, University of Pennsylvania, Population Studies
1. Introduction and background
Epidemiological studies using cohort and case-control designs have shown that reproductive factors – especially a woman’s age at first birth and her total number of births – affect the risk of death from breast cancer. Kelsey, Gammon, and John (1993) provide an early review of the vast amount of literature on the topic. A great deal of subsequent research has been conducted and reviewed by Althius et al. (2004) and Merrill et al. (2005). Nearly all studies find that giving birth at younger ages and giving birth to numerous children are protective against breast cancer mortality. The accumulation of evidence led the National Cancer Institute’s (2003) Workshop on Early Reproductive Events and Breast Cancer to conclude that the relationships between breast cancer and age at first birth and parity are “well established.”
Ma et al. (2006) perform a meta-analysis and conclude that age at first birth and parity are significant factors in estrogen and progesterone receptor positive breast cancers but not in other breast cancers, suggesting that the hormonal changes associated with fertility play a strong role in breast cancer incidence (see also Althuis et al. 2004). Although the duration of breastfeeding is also inversely associated with all types of breast cancers (Collaborative Group on Hormonal Factors in Breast Cancer 2002), it does not account for the relationship between early or numerous births and breast cancer. Further, the relationship between breast cancer and reproductive factors is stronger among older (e.g., postmenopausal) women, because pregnancy is a short-term risk factor for breast cancer (Kelsey, Gammon, and John 1993; Ursin et al. 2004).
The relationships between breast cancer and reproductive factors, combined with dramatic changes in cohort fertility among American women, should have left an imprint on U.S. breast cancer mortality patterns. One example of such a population-level imprint has been demonstrated among a half-million women in Norway. A 25% excess mortality from breast cancer among well-educated women in Norway was statistically reduced to a non-significant 8% in regressions by adjusting for the earlier childbearing among more poorly educated women (Strand et al. 2005).
among baby boomers, whereas the lower fertility among baby boomers would predict increasing rates.
Given the persistent finding that the timing of early births and total parity are predictive of breast cancer incidence and mortality, it is reasonable to hypothesize that those factors shape U.S. breast cancer mortality rates and to test that influence directly. We extend research in this area by modeling the impact of cohort fertility patterns on breast cancer mortality rates in an age-period-cohort framework, for calendar periods ranging from 1948-2003. Our fertility measures include the age-specific proportion of women who are childless and age-specific cumulative second birth rates when women in cohorts were aged 15-19, 20-24, and 25-29, and their cumulative birth rate at ages 35-39. We focus on breast cancer mortality among women aged 40 and older because the effects of reproductive factors on morality among older women may differ from those among younger women, and so that we can include a measure of fertility that is close to women’s completed family size.
2. Data and methods
We examine breast cancer mortality rates for women aged 40-44 to 85 and older, for every fifth calendar year from 1948 to 2003. By using five-year age groups during every fifth calendar year, we can uniquely identify five-year birth cohorts as they pass through life. The numerators (numbers of deaths) of the age-specific breast cancer mortality rates come from vital statistics data (National Center for Health Statistics various years-a; b), and the denominators (numbers of women at risk) come from U.S. Census data (U.S. Census Bureau various years).
calendar year, divided by the total number of women aged 35-39 in that year. Most women have completed most of their childbearing by age 39. Limiting our measures to completed fertility at ages 35-39 allows us to predict breast-cancer mortality rates among women aged 40 and older.
The cohort fertility measures for women aged 15 and older in 1917 and later are derived from U.S. vital statistics data (Heuser 1976; National Center for Health Statistics various years-b). We use U.S. Census tables and linear interpolation to identify additional data points for women in cohorts that were aged 15-39 between the
1900 and 1910 Censuses (Truesdell 1945; Carter et al. 2006).The Census data present
the age-specific proportion childless and the number of children ever born to ever married women. We recalculate these measures for all women by using counts of never married women and assuming that they had no children, a reasonable assumption given that women who had children out of wedlock likely would have reported being divorced or separated (Carter et al. 2006). The fertility rates derived from the Census data show excellent continuity with the rates collected from vital statistics. The Census tables do not provide cumulative second birth rates.
2.1 Missing data
Up to 28% of the values on some of the cohort fertility measures are missing because of lapses in the collection of historical data, with the highest percentages for fertility rates at the youngest ages. For example, U.S. vital statistics data provide annual age-specific fertility rates starting in 1917 (Heuser 1976). Because birth cohort is identified as calendar year minus age, we can use those data to identify fertility at ages 15-19 for women born in 1902, ages 20-24 for women born in 1897, and so on.
reasonably infer their fertility at younger ages; therefore, we drop these cohorts from our analyses. We estimate our models separately in each data set and combine the coefficients and standard errors as shown elsewhere (Rubin 1987). Variation across the data sets reflects our uncertainty about the imputed values and inflates our standard errors accordingly. Our results are quite similar when using imputed values, dropping all cases with missing data, or excluding different age groups to test the robustness of our findings (see Appendix).
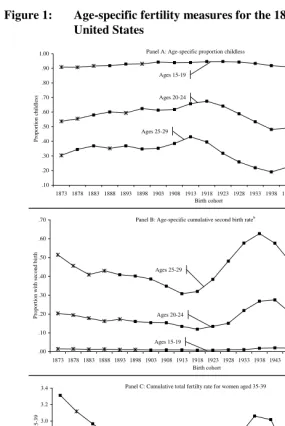
Figure 1: Age-specific fertility measures for the 1873-1963 birth cohorts in the United States
a. Asterisks indicated mean values of multiple imputed data and boxes denote values from Vital Statistics or Census data.
b. The cumulative second birth rates are missing more often than the proportion childless because they were not tabulated in the 1900 and 1910 Census Data.
Panel A: Age-specific proportion childless
.10 .20 .30 .40 .50 .60 .70 .80 .90 1.00
1873 1878 1883 1888 1893 1898 1903 1908 1913 1918 1923 1928 1933 1938 1943 1948 1953 1958 1963 Birth cohort P ro p o rt io n c h il d le ss Ages 15-19 Ages 20-24 Ages 25-29
Panel B: Age-specific cumulative second birth rateb
.00 .10 .20 .30 .40 .50 .60 .70
1873 1878 1883 1888 1893 1898 1903 1908 1913 1918 1923 1928 1933 1938 1943 1948 1953 1958 1963 Birth cohort P ro p o rt io n w it h s ec o n d b ir th Ages 15-19 Ages 20-24 Ages 25-29
Panel C: Cumulative total fertilty rate for women aged 35-39
1.8 2.0 2.2 2.4 2.6 2.8 3.0 3.2 3.4
2.2 Analyses
Statistically identifying the distinct impacts of age, period, and cohort is problematic because each variable is a linear combination of the other two variables. Many scholars resolve this issue by introducing constraints that are arbitrary or that can only identify non-linear trends (e.g., Tarone and Chu 2000; Arbeev et al. 2005). Instead of relying on those methods, we include direct measures of cohort fertility. Preston and Wang (2006) used a similar method to examine cohort smoking patterns and mortality trends. We use negative binomial regression to model the expected number of deaths as:
} )
exp{ln( ijk i i j j k ijk
ijk E x x f
C = +β +π +λ +ν
where Cijk equals the number of breast cancer deaths to women in age group i, period j,
and cohort k; Eijk indicates the population exposed to the risk of breast cancer mortality
in each age, period, and cohort; xi is a dummy variable indicating membership in age
group i; xj is a dummy variable indicating that the observation pertained to period j; fk
indicates the age-specific fertility measure for members of cohort k; and βi, πj, and λ
are estimated coefficients for the relationship between each variable and breast cancer mortality. We test for over-dispersion (i.e., the variance of breast cancer mortality rates
is greater than the mean) by allowing for an omitted variable νijkwhose exponential is
gamma distributed with a mean 1 and variance α. Increasing values of α indicate
greater over-dispersion; if α=0 then there is no evidence of over-dispersion and the
model could be fit more parsimoniously with Poisson regression. Stata (StataCorp
2005) parameterizes α as ln(α), which we report in our tables.
Our models sequentially add and remove each fertility measure to assess their impact on breast-cancer mortality rates; collinearity precludes including multiple
fertility measures simultaneously. We use F-tests to compare model fit when using
multiply imputed data, as described elsewhere (Allison 2002).We report our results in the form of exponentiated coefficients, or incidence rate ratios.
3. Results
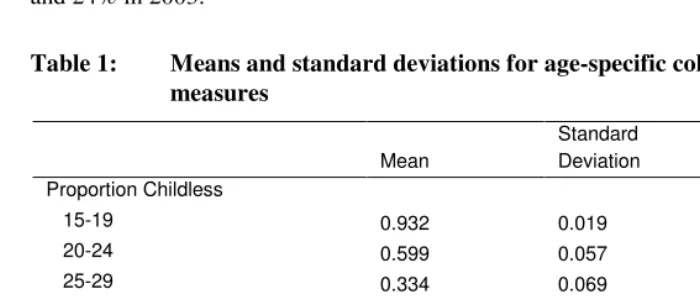
shows that women average 2.5 births in our data. Table 1 also shows that the proportion of values that are imputed declines with age and is highest for the cumulative second birth rates, for the reasons noted above.
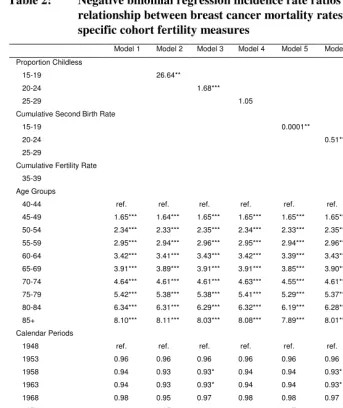
Table 2 presents incidence rate ratios for the relationship between breast cancer mortality rates and the age, period, and cohort fertility measures. Model 1 includes only the variables for age and period and shows that breast cancer mortality increases with age: compared to women aged 40-44, women aged 45-49 have 1.6 times, women aged 65-69 have 3.9 times, and women aged 85 and older have 8.1 times the rate of breast cancer mortality. Compared to breast cancer mortality rates in 1948, mortality was persistently but not significantly lower from 1953-1993, and then fell by 16% in 1998 and 24% in 2003.
Table 1: Means and standard deviations for age-specific cohort fertility measures
Mean
Standard Deviation
Proportion Imputed Proportion Childless
15-19 0.932 0.019 0.171
20-24 0.599 0.057 0.120
25-29 0.334 0.069 0.077
Cumulative Second Birth Rate
15-19 0.011 0.006 0.282
20-24 0.169 0.047 0.214
25-29 0.422 0.093 0.154
Cumulative Fertility Rate
35-39 2.53 0.387 0.034
N=117
Table 2: Negative binomial regression incidence rate ratios for the relationship between breast cancer mortality rates and the age-specific cohort fertility measures
Model 1 Model 2 Model 3 Model 4 Model 5 Model 6 Model 7 Model 8
Proportion Childless
15-19 26.64**
20-24 1.68***
25-29 1.05
Cumulative Second Birth Rate
15-19 0.0001**
20-24 0.51***
25-29 0.82**
Cumulative Fertility Rate
35-39 0.99
Age Groups
40-44 ref. ref. ref. ref. ref. ref. ref. ref.
45-49 1.65*** 1.64*** 1.65*** 1.65*** 1.65*** 1.65*** 1.65*** 1.65***
50-54 2.34*** 2.33*** 2.35*** 2.34*** 2.33*** 2.35*** 2.34*** 2.34***
55-59 2.95*** 2.94*** 2.96*** 2.95*** 2.94*** 2.96*** 2.95*** 2.95***
60-64 3.42*** 3.41*** 3.43*** 3.42*** 3.39*** 3.43*** 3.43*** 3.43***
65-69 3.91*** 3.89*** 3.91*** 3.91*** 3.85*** 3.90*** 3.91*** 3.92***
70-74 4.64*** 4.61*** 4.61*** 4.63*** 4.55*** 4.61*** 4.62*** 4.64***
75-79 5.42*** 5.38*** 5.38*** 5.41*** 5.29*** 5.37*** 5.39*** 5.42***
80-84 6.34*** 6.31*** 6.29*** 6.32*** 6.19*** 6.28*** 6.28*** 6.34***
85+ 8.10*** 8.11*** 8.03*** 8.08*** 7.89*** 8.01*** 8.03*** 8.11***
Calendar Periods
1948 ref. ref. ref. ref. ref. ref. ref. ref.
1953 0.96 0.96 0.96 0.96 0.96 0.96 0.96 0.96
1958 0.94 0.93 0.93* 0.94 0.94 0.93* 0.94 0.94
1963 0.94 0.93 0.93* 0.94 0.94 0.93* 0.94 0.94
1968 0.98 0.95 0.97 0.98 0.98 0.97 0.97 0.98
1973 0.98 0.95 0.96 0.98 0.97 0.96 0.97 0.97
1978 0.97 0.94 0.96 0.97 0.97 0.96 0.97 0.97
1983 0.96 0.94 0.96 0.96 0.97 0.96 0.97 0.96
1988 1.00 0.98 1.00 1.00 1.02 1.00 1.00 0.99
1993 0.95 0.94 0.96 0.96 0.98 0.96 0.96 0.95
1998 0.84*** 0.83*** 0.84*** 0.84*** 0.86** 0.84*** 0.84*** 0.84***
2003 0.76*** 0.75*** 0.76*** 0.76*** 0.78*** 0.76*** 0.77*** 0.76***
Ln(α) -4.91*** -5.22*** -5.02*** -4.91*** -5.11*** -5.03*** -4.96*** -4.91***
F-test vs. Model 1 p=.004 p=.001 p=.690 p=.022 p=.002 p=.034 p=.83
Model 3 estimates that a cohort that had no first births at age 20-24 would have a 68% higher breast cancer mortality rate than a cohort in which all women had children by age 20-24. Although the incidence ratio for the proportion childless at ages 20-24 is smaller than for ages 15-19, the standard deviation is larger (see Table 1); thus, a two standard deviation increase in the proportion childless at ages 20-24 is associated with a 6.1% increase in the breast cancer mortality rate. The proportion of women who are childless at ages 25-29 is not significantly associated with breast cancer mortality in our data (Model 4).
Models 5 through 7 examine the relationship between the cumulative second fertility rate and breast cancer mortality. Model 5 shows that a cohort in which all women aged 15-19 had second births would have a 99.99% lower rate of breast cancer mortality rate than if no women had second births. As with the proportion childless at age 15-19, this result may hold for individual women, but there is very little variability in the cumulative second birth rate at ages 15-19. Thus, a two standard deviation increase in the rate of childless at ages 15-19 is associated with a 10.1% decrease in the breast cancer mortality rate.
Model 6 predicts that cohorts in which all women had second births by ages 20-24 would have 49% lower breast cancer mortality rates than cohorts in which no women had second births. A two standard deviation increase in the cumulative second birth rate at ages 20-24 is associated with a 6.1% decrease in the breast cancer mortality rate. Model 7 estimates that cohorts where all women aged 25-29 have a second birth would have 18% lower breast cancer mortality rates than cohorts where no women had second
births. In the context of observed U.S. fertility patterns, a two standard deviation
increase in the cumulative second birth rate at ages 25-29 is associated with a 3.7% decrease in the breast cancer mortality rate.
Model 8 examines whether total parity is associated with breast cancer mortality and shows that cumulative fertility among women aged 35-39 is not significantly associated with breast cancer mortality among women aged 40 and older in these data. Separate models included the cumulative fertility rate at ages 35-39 as well as the age-specific proportion childless or the age-age-specific second birth rates. An unexpected result
emerged: cumulative fertility rates were associated with increased breast cancer
mortality in models that also adjusted for the proportion childless at ages 20-24, or the cumulative second birth rate at ages 20-24 or 25-29 (results not shown). The estimated relationships were modest in magnitude, and likely resulted from the high level of collinearity between the cumulative fertility rate and the proportion childless at ages
20-24 (r=-.62), the cumulative second birth rate at ages 20-24 (r=.50), and the cumulative
second birth rate at ages 25-29 (r=.71), even before adjusting for age and calendar
Introducing counterfactual fertility assumptions allows us to shed light on the role of reproductive factors in period trends in breast cancer mortality. We focus on the proportion childless at ages 20-24 because it is significantly related to breast cancer mortality in our models and in prior studies, and because it varies substantially over time and might leave a large imprint on period trends in mortality. Figure 2 graphs age-adjusted breast cancer mortality rates across calendar periods, as predicted by Model 3, Table 2. The solid line shows the predicted breast cancer mortality rate per 100,000 women, given the observed proportion childless at ages 20-24 among the birth cohorts that are present in each period. The mortality rates are fairly inconsistent from the early 1950s until the early 1980s, whereupon the rates increase until the late 1980s, and then decline substantially until 2003.
Figure 2: Predicted breast cancer mortality by calendar year, given different proportions childless at ages 20-24
60 65 70 75 80 85 90
1948 1953 1958 1963 1968 1973 1978 1983 1988 1993 1998 2003
Calendar year P re d ic te d b re as t ca n ce r m o rt al it y r at e p er 1 0 0 ,0 0 0 w o m en
Predicted age-adjusted breast cancer mortality rate given the observed proportion childless at ages 20-24 in each cohort
Predicted age-adjusted breast cancer mortality rate given the 1963 cohort's proportion childless at ages 20-24
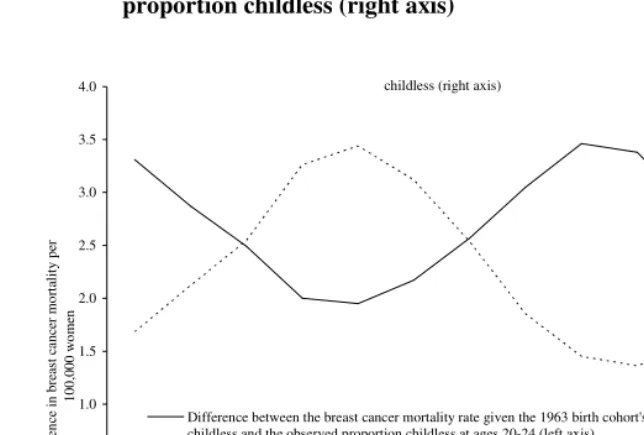
The dotted line shows the predicted breast cancer mortality rate that we would expect if all cohorts had the proportion childless at ages 20-24 of women in the 1963 birth cohort, which is marked by nearly the highest proportions childless in our data (see Figure 1, Panel A). Across all calendar periods, the breast cancer mortality rate would have been higher if all cohorts had the same proportion childless at ages 20-24 that was exhibited by the 1963 birth cohort. Breast cancer mortality would likely have been much higher in the past if not for the higher fertility of earlier cohorts. Conversely, the recent declines in breast cancer mortality would likely have been even greater if women had the higher levels of early fertility exhibited by earlier cohorts.
An additional counterfactual comparison estimates the share of breast cancer mortality that could be attributed to the observed variation in fertility. We compared the predicted breast cancer mortality rates from Model 3, Table 2 when holding the proportion childless at ages 20-24 at the lowest observed level (.48 in the 1938 cohort) and then at the highest observed level (.68 in the 1918 cohort), and holding age and period at their means (analyses not tabled). If cohorts had the 1918 proportion childless we would expect a breast cancer mortality rate of 79.57 per 100,000 women, or 10.5% higher than the expected mortality rate of 71.98 deaths per 100,000 if given the 1938 cohort’s proportion childless. Thus, cohort fertility patterns leave a substantial impact on national breast cancer mortality rates, although other factors that change on an age, period or cohort basis – including changes in nutrition, improved breast cancer detection, and more effective adjuvant therapies – are also important (Breen and Kessler 1994; Tarone and Chu 2000; Jatoi and Miller 2003).
Figure 3: Comparison of period trends in the difference between the age adjusted breast cancer mortality rates given the 1963 birth cohort’s and the observed proportions childless (left axis), and the observed proportion childless (right axis)
childless (right axis)
.0 .5 1.0 1.5 2.0 2.5 3.0 3.5 4.0
1948 1953 1958 1963 1968 1973 1978 1983 1988 1993 1998 2003
Calendar year D if fe re n ce i n b re as t ca n ce r m o rt al it y p er 1 0 0 ,0 0 0 w o m en .56 .57 .58 .59 .60 .61 .62 .63 P ro p o rt io n c h ild le ss a t a g es 2 0 -2 4
Difference between the breast cancer mortality rate given the 1963 birth cohort's proportion childless and the observed proportion childless at ages 20-24 (left axis)
Observed proportion childless at ages 20-24 (right axis)
4. Discussion
older women. Rusiecki and colleagues (2005) find that between 13% and 34% of tumors are both estrogen and progesterone receptor negative across 7 studies, depending on the sample and how receptor status was define.
Our results for the proportion childless are also consistent with studies showing that age 25 is the significant break-point in the relation between age at first birth and breast cancer mortality among older women (see Ursin et al. 2004: Table 2). We are aware of no epidemiologic studies of cumulative second birth rates with which we can compare our results. Prior studies have found that total parity is associated with breast cancer mortality (Althuis et al. 2004; Ursin et al. 2004; Ma et al. 2006). Total parity at ages 35-39 was unassociated with breast cancer mortality rates among women aged 40 and older, but separate analyses (not shown) tested for interactions between parity and age and found that total parity at ages 35-39 was inversely associated with breast cancer
mortality rates among women aged 80 and older (F(9, 766553)=1.68; p=.088). None of the
other fertility measures demonstrated significant interactions with age.
Given the highly correlated trends in the age-specific birth rates (see Figure 1), one might expect that the fertility variables would be largely interchangeable in the multivariate models. But this is not the case. Cumulative fertility at ages 35-39 did not demonstrate a significant association with breast cancer mortality in our data, and further analyses (not shown) found that the proportion childless and the cumulative second birth rate at ages 30-34 were unassociated with breast cancer mortality rates. Thus, even national level data show that giving birth to first and second children at earlier ages is significantly protective against breast cancer mortality.
The period trend in breast cancer mortality rates that we find in Table 2 and show in Figure 2, has been documented previously (Chu et al. 1996; Tarone, Chu, and Gaudette 1997; Wingo et al. 1998). The upward trend in the early 1980s has been attributed to the increased use of mammography, the earlier detection of palpable tumors, and the addition of progestin to hormone replacement therapy during the decade, and the sharp declines starting in the late 1980s likely reflect the benefits of both early detection and adjuvant therapy (Breen and Kessler 1994; Tarone and Chu 2000; Jatoi and Miller 2003). Although the incidence of breast cancer declined in 2003, possibly due to the declining usage of hormone replacement therapies (Ravdin et al. 2007) or reductions in mammography (Breen et al. 2007), it may take several years to ascertain whether there will be a concomitant decline in breast cancer mortality rates.
(Table 2), respectively. Consistent with Tarone and Chu (2000), the age-specific proportions childless were stronger predictors of breast cancer mortality for cohorts born before 1930, and they were relatively weaker predictors of breast cancer mortality rates among women born after 1930.
Fertility has many important demographic consequences, and the hormonal fluctuations during pregnancy and after giving birth have strong and well recognized biological connections to breast cancer mortality. But we do not have long-term population level data on other factors that might leave strong imprints on breast cancer incidence and mortality, such as the use of hormone replacement therapy or adjuvant therapy (Jatoi and Miller 2003; Ravdin et al. 2007), the population level utilization of preventive breast exams (Breen and Kessler 1994; Breen et al. 2007), or the duration between menarche and the age of first birth (Li et al. 2007). Further, despite the increased risks of breast cancer incidence and mortality, women may live longer if they delay childbearing or have fewer children, because reproduction requires resources that could otherwise be used for somatic maintenance (Westendorp and Kirkwood 1998; Westendorp et al. 2001). Future research could examine whether education or race shape the impact of fertility on breast cancer mortality trends.
5. Conclusion
Cancer is among the top three (and often among the top two) causes of death for women aged 40 and older in the U.S., and breast cancer is the second leading cause of cancer mortality after lung cancer (Hoyert et al. 2006; Heron and Smith 2007). Declines in fertility among some population subgroups in the U.S. presage a possible slowing of the declines in breast cancer mortality that are achieved by improved screening and therapies. Based on research that focuses on hormone receptor tumors, it also seems likely that declining fertility may lead to an increased prevalence of estrogen and progesterone receptor positive tumors (Althuis et al. 2004; Ma et al. 2006), which might shape the kinds of therapies that will be required most frequently. Jatoi and colleagues (2007) found that mortality from estrogen receptor positive breast cancers has declined more than mortality from estrogen receptor negative tumors between 1990 and 2003, suggesting that current adjuvant therapies and mammography may be more successful at identifying and treating hormone receptor positive tumors.
exhibited lower breast cancer mortality rates than cohorts with low fertility levels. Specifically, low proportions of childless women at ages 15-24, or high cumulative second birth rates at ages 15-29, are associated with significantly and substantially lower rates of breast cancer mortality in later life. In sum, this is the first demonstration that cohort fertility patterns have left a clear imprint on trends in U.S. breast cancer mortality rates.
6. Acknowledgements
References
Allison P. D. (2002). Missing data. Thousand Oaks, CA: Sage.
Althuis M. D., Fergenbaum J. H., Garcia-Closas M., Brinton L. A., Madigan M. P., and Sherman M. E. (2004). "Etiology of hormone receptor-defined breast cancer: a
systematic review of the literature." Cancer Epidemiology, Biomarkers, and
Prevention 13:1558-1568.
Arbeev K. G., Ukraintseva S. V., Arbeeva L. S., and Yashin A. I. (2005). "Decline in human cancer incidence rates at old ages: age-period-cohort considerations."
Demographic Research 12:273-300.
Breen N., Cronin K. A., Meissner H. I., Taplin S. H., Tangka F. K., Tiro J. A., and McNeel T. S. (2007). "Reported drop in mamography: is this cause for
concern?" Cancer 109:2405-2409.
Breen N. and Kessler L. (1994). "Changes in the use of screening mamography:
evidence from the 1987 and 1990 National Health Interview Surveys." American
Journal of Public Health 84:62-7.
Carter S. B., Gartner S. S., Haines M. R., Olmstead A. L., Sutch R., and Wright G. (2006). "Historical Statistics of the United States: Millennial Edition." Cambridge, UK: Cambridge University Press.
Chu K. C., Tarone R. E., Kessler L. G., Ries L. A. G., Hankey B. F., Miller B. A., and Edwards B. K. (1996). "Recent trends in U.S. breast cancer incidence, survival,
and mortality rates." Journal of the National Cancer Institute 88:1571-1579.
Collaborative Group on Hormonal Factors in Breast Cancer. (2002). "Breast cancer and
breastfeeding: collaborative reanalysis of individual data from 47
epidemiological studies in 30 countries, including 50,302 women with breast
cancer and 96,973 women without the disease." The Lancet 360:187-195.
Heron M. P. and Smith B. L. (2007). Deaths: leading causes for 2003. National vital
statistics reports. Hyattsville, MD: National Center for Health Statistics.
Heuser R. L. (1976). Fertility tables for birth cohorts by color: United States, 1917-73.
Rockville, MD: National Center for Health Statistics.
Hoyert D. L., Heron M. P., Murphy S. L., and Kung H.-C. (2006). Deaths: final data
Jatoi I., Chen B. E., Anderson W. F., and Rosenberg P. S. (2007). "Breast cancer mortality trends in the United States according to estrogen receptor status." Journal of Clinical Oncology 25:1683-1690.
Jatoi I. and Miller A. B. (2003). "Why is breast-cancer mortality declining?" The Lancet
Oncology 4:251-254.
Kelsey J. L., Gammon M. D., and John E. M. (1993). "Reproductive factors and breast
cancer." Epidemiological Reviews 15:36-47.
Li C. I., Maline K. E., Daling J. R., Potter J. D., Bernstein L., Marchbanks P. A., Strom B. L., Simon M. S., Press M. F., Ursin G., Burkman R. T., Folger S. G., Norman S. A., McDonald J. A., and Spirtas R. (2007). "Timing of menarche and first
full-term birth in relatin to breast cancer risk." American Journal of
Epidemiology 167:230-239.
Ma H., Bernstein L., Pike M. C., and Ursin G. (2006). "Reproductive factors and breast cancer risk according to joint estrogen and progesterone receptor status: a
meta-analysis of epidemiological studies." Breast Cancer Research 8:1-11.
Merrill R. M., Fugal S., Novilla L. B., and Raphael M. C. (2005). "Cancer risk
associated with early and late maternal age at first birth." Gynecologic Oncology
96:583-593.
National Cancer Institute. (2003). Summary report: early reproductive events and
breast cancer workshop: Online access at www.cancer.gov.
National Center for Health Statistics. (various years-a). National vital statistics reports.
Hyattsville, MD.
—. (various years-b). Vital Statistics of the United States. Hyattsville, MD: U.S.
Department of Health, Education, and Welfare.
Preston S. H. and Wang H. (2006). "Sex mortality differences in the United States: the
role of cohort smoking patterns." Demography 43:631-646.
Ravdin P. M., Cronin K. A., Howlader N., Berg C. D., Chlebowski R. T., Feuer E. J., Edwards B. K., and Berry D. A. (2007). "The decrease in breast-cancer
incidence in 2003 in the United States." New England Journal of Medicine
356:1670-1674.
Royston P. M. (2005). "Multiple imputation of missing values: update of ICE." The
Stata Journal 5:527-536.
Rusiecki J. A., Holford T. R., Zahm S. H., and Zheng T. (2005). "Breast cancer risk factors according to joint estrogent receptor and progesterone receptor status." Cancer Detection and Prevention 29:419-429.
Schafer J. L. (1997). Analysis of incomplete multivariate data. London: Chapman and
Hall.
StataCorp. (2005). "Stata statistical software: release 9." College Station, TX: Stata Press.
Strand B. H., Tverdal A., Claussen B., and Zahl P. H. (2005). "Is birth history the key to highly educated women's higher breast cancer mortality? A follow-up study of
500,000 women aged 35-54." International Journal of Cancer 117:1002-1006.
Tarone R. E. and Chu K. C. (1996). "Evaluation of birth cohort patterns in population
disease rates." American Journal of Epidemiology 143:85-91.
—. (2000). "Age-period-cohort analyses of breast-, ovarian-, endometrial-, and
cervical-cancer mortality rates for Caucasian women in the USA." Journal of
Epidemiology and Biostatistics 5:221-231.
Tarone R. E., Chu K. C., and Gaudette L. A. (1997). "Birth cohort and calendar period
trends in breast cancer mortality in the United States and Canada." Journal of the
National Cancer Institute 89:251-256.
Truesdell L. E. (1945). Differential fertility 1940 and 1910, women by number of
children ever born: sixteenth Census of the United States. Washington, DC: United States Government Printing Office.
U.S. Census Bureau. (various years). Current population reports, series 311,
P25-314, P25-519, P25-870, P20-441. Washington, DC.
Ursin G., Bernstein L., Wang Y., Lord S. J., Deapen D., Liff J. M., Norman S. A., Weiss l. K., Daling J. R., Marchbanks P. A., Malone K. E., Folger S. G., McDonald J. A., Burkman R. T., Simon M. S., Strom B. L., and Spirtas R. (2004). "Reproductive factors and risk of breast carcinoma in a study of White
and African-American women." Cancer 101:353-362.
Westendorp R. G. J. and Kirkwood T. B. (1998). "Human longevity at the cost of
reproductive success." Nature 396:743-746.
Westendorp R. G. J., van Dunne F. M., Kirkwood T. B., Halmerhorst F. M., and
Huizinga T. W. J. (2001). "Optimizing human fertility and survival." Nature
Wingo P. A., Ries L. A. G., Rosenberg H. M., Miller D. S., and Edwards B. K. (1998).
Appendix
Table 3 compares coefficients from models that exclude or include the multiply imputed data. Each coefficient comes from a separate model that further controls for age and calendar period. The first column presents coefficients (the natural logarithm of the incidence rate ratios) from models that include multiply imputed data on the fertility measures – these results correspond to those shown in Table 2. The second column excludes women aged 40-44 who might still bear children. The third column excludes women aged 85 and older who may be marked by selective mortality and who are not members of a uniquely-defined five-year cohort. The results from models that exclude specific age groups are similar in magnitude and significance to those that include all age groups, with the exception that the coefficient for the cumulative second fertility rate at ages 25-29 falls from significance when excluding women aged 85 and older. The fourth through sixth columns replicate the first three columns but come from models that exclude any cases with missing data on the fertility measures. In all cases, the coefficients are similar in magnitude and significance to those that include missing data, although the coefficients estimated with the imputed data often have smaller absolute values.
Table 3: Negative binomial regression coefficients for the relationship between cohort fertility measures and breast cancer mortality rates:
comparisons of results with imputed and non-imputed data.a, b
Multiply Imputed Data Non-Imputed Data
All Agesc Ages 45+ Ages 40-84 All Ages Ages 45+ Ages 40-84
Proportion Childless
15-19 3.28** 3.08** 3.21** 6.14*** 6.28*** 5.67***
20-24 0.52*** 0.61*** 0.43*** 0.63*** 0.79*** 0.52***
25-29 0.05 0.18 -0.05 0.04 0.18 -0.06
Cumulative Second Birth Rate
15-19 -9.07** -10.20* -8.65** -14.13*** -16.42*** -12.89***
20-24 -0.67*** -0.79*** -0.58*** -0.82*** -1.02*** -0.70***
25-29 -0.20** -0.26** -0.13 -0.20** -0.29*** -0.13
Cumulative Fertility Rate
35-39 -0.01 -0.01 0.01 -0.01 -0.02 0.01
* p<.10; ** p<.05; ***p<.01 (two tailed tests)
a. Coefficients are calculated as the natural logarithm of incidence rate ratios.