ISSN: 0976-3031
Research Article
SOFTWARE DEFECT PREDICTION USING ENHANCED RELEVANCE
VECTOR MACHINE
Vanithamani P* and Jaiganesh V
Department of Computer Science, Dr.N.G.P. College of Arts and Science,
Bharathiar University, Coimbatore, Tamil Nadu, India
DOI: http://dx.doi.org/10.24327/ijrsr.2018.0902.1550
ARTICLE INFO ABSTRACT
Data mining using machine learning techniques grabbed the interest of researchers in recent years. Software defect prediction is one of the thrust research area and data mining techniques are applied to identify the defects that are present in the datasets. In this research work an enhanced relevance vector machine (ERVM) is used for software defect prediction. From the extensive literature study it is observed that relevance vector machine classifier is comparably delivering better performance than that of support vector machine. This implication is taken for the research work. Datasets are collected from Promise software engineering repository [25] that has a collection of publicly available datasets and tools to serve researchers in building predictive software models (PSMs) and software engineering community at large. Two state of the art datasets namely PC1 and CM1 are taken for estimating the efficiency of the RVM and ERVM. MATLAB is used for implementing both RVM and ERVM. Defect prediction accuracy, sensitivity, specificity and time taken for execution are the performance metrics chosen and the results encompasses that ERVM performs better.
INTRODUCTION
Recently people around the world are evidently and impalpably getting benefitted by software industry. Reliance of people on software is propounding too many which results in necessity of quality software. Commonly, the quality measure of the software is perceived by uncovering the defects in it. One of the metric to forecast / predict the software quality is software defect density that tends to analyze the same. The defect density of the software is computed by splitting the dimension of the software with total number of defects in it. In several literatures it is stated that a software defect is a product anomaly. The software reliability of software is described as the probability that software will not be the reason for the crash of a system in for a particular amount of time beneath the precise conditions. Software defect prediction is the primary component during the development of reliable software. In each step of software development life cycle for attaining target defect guesstimate, it is required to predict the defect density indicator. For the past decades several models have been proposed for software reliability estimation and prediction. It is noted that conventional software reliability prediction models
are not more triumphant in predicting the reliability of the software. Also such proposed models are not user friendly and many of such models are probabilistic based approaches. To add up with the above said things, failure data are also not available in the early phases of the software development life cycle. Whilst some of them are presented in the form of expert knowledge through certain software metrics. This paper is organized as follows: this section introduces about software defect prediction.
Section 2 briefly presents the related works. Section 3 portrays the background of support vector machine. Section 4 proposes enhanced relevance vector machine classifier for software defect prediction. Section 5 projects the simulation results. Section 6 emphasizes the concluding remarks of the paper.
Related Works
Building defect-related feature space is one among the primary works in software defect classification. In order to classify the software defect-related attributes, several approaches were presented that depends on diverse information [1], namely code metrics [2], process metrics [3], previous defects [4] and more
Available Online at http://www.recentscientific.com
International Journal of
Recent Scientific
Research
International Journal of Recent Scientific Research
Vol. 9, Issue, 2(B), pp. 23860-23864, February, 2018
Copyright © Vanithamani P and Jaiganesh V, 2018, this is an open-access article distributed under the terms of the Creative Commons Attribution License, which permits unrestricted use, distribution and reproduction in any medium, provided the original work is properly cited.
DOI: 10.24327/IJRSR
CODEN: IJRSFP (USA)
Article History:
Received 20th November, 2017
Received in revised form 29th December, 2017
Accepted 30th January, 2018 Published online 28th February, 2018
Key Words:
Vanithamani P and Jaiganesh V., Software Defect Prediction Using Enhanced Relevance Vector Machine
[5,6]. Many literatures mentioned that LOC data performs better in software defect prediction [7, 8]. D’Ambros et al. [9] mentioned in their article that change coupling correlates with defects. In [10], the authors Nagappan and Ball [10] applied code churn and also dependency metrics in order to predict defect-prone modules. Khoshgoftaar and Seliya [11] had chosen 14 process metrics. Weyuker et al. [12] built a defect-count prediction model by taking into acdefect-count of certain number of process measures along with structural measures. Feature selection on group of metrics also implemented by various researchers for improving the performance of the classifier and can be found in [13, 14, 15, 16]. It is to be noted that there exists several statistical models and machine learning algorithms have been applied. In the literature that can be found in [17], Olague et al. applied logistic regression to predict defects in software. Mizuno and Kikuno [18] stated in the literature a type of Markov model named Orthogonal Sparse Bigrams suited best for software defect prediction. In the literature [19] Bibi et al. implemented Regression through Classification mechansim in software defect prediction. Khoshgoftaar et al. [20] constructed a classification tree that is based on TREEDISC algorithm for predicting module that was likely to have defects which is based on software product, process, and execution metrics. Early software defects prediction using fuzzy logic is proposed in [21]. Software defect prediction using Bayesian networks can be found in the literature [22]. Combining the requirement information for software defect estimation in design time has been implemented in the paper [23]. Incremental updating approximations in probabilistic rough sets under the variation of attributes are discussed in [24].
Enhanced Relevance Vector Machine for Software Defect Prediction
As one of the state-of-the-art tools for machine learning, support vector machines (SVMs) produce a model function dependent only on a subset of kernel basis functions associated with some of the training samples, i.e., support vectors. Although the SVM produces a sparse model, in some cases the number of support vectors is still quite large. Relevance vector machine (RVM) is a new supervised learning method proposed in 2001 by Tipping[3], which can be used to solve regression and classification problems, resulting from their sparsity and mathematical tractability. Compared with SVM, RVM can have probabilistic output and more sparse, and kernel function to choose more freely and so on. The Bayesian formulation of the RVM provides a better sparsity, as well as an automatic estimation of hyper parameters and probabilistic outputs, while predicting accuracy is not traded off.
The RVM can be categorized into a pruning method of the RBF networks, using kernel function as the candidate basis functions, i.e.,
i
x
k
x
,
x
i
, which defines one basis function for each example in the training setX
x
i ki1.The majority of the weights are trained to be zero, while only those “relevant vectors” corresponding non-zero weights are selected to construct the model in Equation (1). To achieve such a sparsity but avoid overfitting, the RVM imposes a spherical Gaussian prior on the weights, and a Gamma
hyperprior distribution for the variance. Given an input x, the output of the RVM is that of the form
k
i i
i
x
w
w
w
x
y
1
0
:
… (1)
The performance of the original RVM in terms of sparsity is determined by the smoothness of the prior. However the lack of an explicit prior structure over the weight variance means that the sparsity actually depends on the choice of kernel functions and/or kernel parameters. This may lead to severe overfitting or underfitting. To control sparsity in Bayesian regression by incorporating a flexible noise dependent smoothness prior to replace the Gamma prior in the classic RVM, the symmlets with smoothness prior make the RVM regression suitable for a large variety of signals, requiring no additional kernel parameters to be determined by cross-validation. The objective of the E-RVM learning is to obtain the best set of the relevance vectors in terms of goodness of fit to data, as well as the sparsity, i.e. the least number of relevance vectors.
Considering the three random processes, x, t, j, in the RVM training phase, the joint distribution among them can be calculated by either of these two formulae:
x
t
j
p
x
p
t
x
p
j
t
x
p
,
,
|
|
,
… (2)
x
t
j
p
j
p
x
j
p
t
x
j
p
,
,
|
|
,
… (3) In the ideal scenarios, Equation (2) and Equation (3) would return the same result, however, they are not so unless j corresponds to the optimal set of the relevance vectors. The breakdown of the right hand sides of Equation (2) indicates that it is a forward pathway to obtain the solution from the known training data and targets, whereas Equation (3) follows the backward pathway to test the performance of current solution. When we usep
train
x
,
t
,
j
andp
test
x
,
t
,
j
to denote the two joint probabilities of Equations (2) and (3) respectively, the best match between them, corresponding to the popular mean square error (MSE) and maximum likelihood(ML), can be achieved by the minimization of the classic Kullback-Leibler divergence:
x t jtest train train
j t x test
train d dd
j t x p
j t x p j t x p p
p KL
, ,
, , log , , |
,,… (4)
Which can push
ptrain
x
,
t
,
j
to matchp
test
x
,
t
,
j
, such that the solution will fit the training data most. However, the problem with the KL-based learning is the low generalization ability due to the lack of control on least complexity. In Equation (4), the distribution ofp
trainis the fixed prior reference distribution, and the distribution ofp
testis optimized to matchp
train under the KL divergence minimization. The following negative cross entropy will be maximized to construct the RVM:
j t
x train test x t j
test
train
p
p
x
t
j
p
x
t
j
d
d
d
p
,
,
,
,
log
,
,
||
H
International Journal of Recent Scientific Research
Comparing Equations (4) and (5), we can see that
p
trainp
test
KL
p
trainp
test
H
p
trainH
||
||
indicates that the maximization of Train-Testentropy consists of two parts, namely, the minimization of KL divergence between Test and Training, and the maximization of entropy in Training space. The former leads to the goodness of fit to data, whereas the latter leads to the least complexity under some constraints. As the training data are in the paired form
particularly the model
x
t
j
p
x
t
p
j
t
x
ptrain
,
,
,
|
,
with the following structures
n
N
n
x
x
nt
t
N
t
x
p
,
1
1
j
t
x
p
|
,
is free In the backward testing phrase, the “true” probability distribution isptest
x
,
t
,
j
p
x
p
corresponding to the backward testing pathway, where the ERVM constructed by the candidate relevance vectors j is tested whether it outputs the target t given an
denoted as
j
p
jp
which is subject to
pj
0
and
p
j
software defect and 0 denotes software non-defect.RESULTS
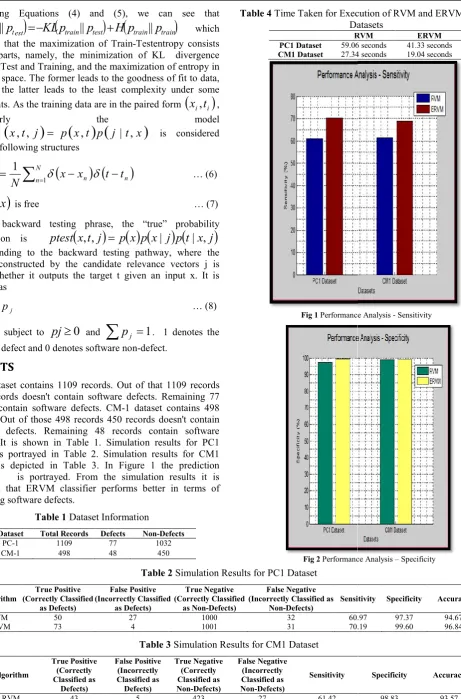
PC-1 dataset contains 1109 records. Out of that 1109 records 1032 records doesn't contain software defects. Remaining 77 records contain software defects. CM-1 dataset contains records. Out of those 498 records 450 records doesn't contain software defects. Remaining 48 records contain software defects. It is shown in Table 1. Simulation results for PC1 dataset is portrayed in Table 2. Simulation results for CM1 dataset is depicted in Table 3. In Figure 1 the prediction accuracy is portrayed. From the simulation results it is observed that ERVM classifier performs better in terms of predicting software defects.
Table 1 Dataset Information
Dataset Total Records Defects Non
PC-1 1109 77 CM-1 498 48
Table 2
Algorithm
True Positive (Correctly Classified
as Defects)
False Positive (Incorrectly Classified
as Defects)
RVM 50 27
ERVM 73 4
Table 3
Algorithm
True Positive (Correctly Classified as
Defects)
False Positive (Incorrectly Classified as
Defects)
RVM 43 5
ecent Scientific Research Vol. 9, Issue, 2(B), pp. 23860-23864, February, 2018
Comparing Equations (4) and (5), we can see that
train
train
||
p
which Testentropy consists of two parts, namely, the minimization of KL divergence ing, and the maximization of entropy in Training space. The former leads to the goodness of fit to data, whereas the latter leads to the least complexity under some constraints. As the training data are in the paired form
x
i,
t
i
,ly the model
is considered… (6)
… (7) In the backward testing phrase, the “true” probability
x
j
p
t
x
j
p
|
|
,
corresponding to the backward testing pathway, where the ERVM constructed by the candidate relevance vectors j is tested whether it outputs the target t given an input x. It is
… (8)
1
. 1 denotes the defect.1 dataset contains 1109 records. Out of that 1109 records 1032 records doesn't contain software defects. Remaining 77 1 dataset contains 498 records. Out of those 498 records 450 records doesn't contain software defects. Remaining 48 records contain software defects. It is shown in Table 1. Simulation results for PC1 dataset is portrayed in Table 2. Simulation results for CM1 icted in Table 3. In Figure 1 the prediction accuracy is portrayed. From the simulation results it is observed that ERVM classifier performs better in terms of
Dataset Information
Non-Defects
1032 450
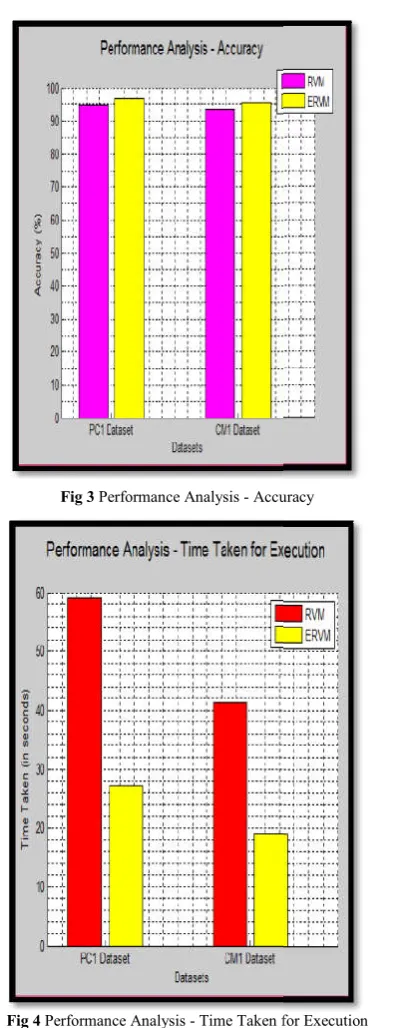
Table 4 Time Taken for Execution of RVM and ERVM for the Datasets
RVM PC1 Dataset 59.06 seconds
CM1 Dataset 27.34 seconds
Fig 1 Performance Analysis
Table 2 Simulation Results for PC1 Dataset
False Positive (Incorrectly Classified
as Defects)
True Negative (Correctly Classified
as Non-Defects)
False Negative (Incorrectly Classified as
Non-Defects)
Sensitivity
1000 32 60.97
1001 31 70.19
Table 3 Simulation Results for CM1 Dataset
False Positive (Incorrectly Classified as Defects)
True Negative (Correctly Classified as Non-Defects)
False Negative (Incorrectly Classified as Non-Defects)
Sensitivity
423 27 61.42
Fig 2 Performance Analysis
23864, February, 2018
Time Taken for Execution of RVM and ERVM for the Datasets
RVM ERVM
59.06 seconds 41.33 seconds 27.34 seconds 19.04 seconds
Performance Analysis - Sensitivity
Sensitivity Specificity Accuracy
60.97 97.37 94.67 70.19 99.60 96.84
Specificity Accuracy
Vanithamani P and Jaiganesh V
Fig 3 Performance Analysis - Accuracy
Fig 4 Performance Analysis - Time Taken for Execution
CONCLUSIONS
This research work aims to propose an enhanced relevance vector machine classifier for software defect prediction. Two datasets are obtained from Promise software engineering repository. Kullback-Leibler divergence factor is included in ERVM in order to reduce the time complexity of
Implementations are carried out using MATLAB. The obtained results proved that the proposed ERVM consumes less time than that of RVM and also accuracy has been improved.
References
1. M. D’Ambros, M. Lanza, R. Robbes, Evaluating defect prediction approaches: a benchmark and an extensive comparison, Empir. Softw. Eng. 17 (4) (2012) 531
Vanithamani P and Jaiganesh V., Software Defect Prediction Using Enhanced Relevance Vector Machine
Accuracy
Time Taken for Execution
propose an enhanced relevance vector machine classifier for software defect prediction. Two datasets are obtained from Promise software engineering Leibler divergence factor is included in ERVM in order to reduce the time complexity of the classifier. Implementations are carried out using MATLAB. The obtained results proved that the proposed ERVM consumes less time than that of RVM and also accuracy has been improved.
M. D’Ambros, M. Lanza, R. Robbes, Evaluating defect iction approaches: a benchmark and an extensive comparison, Empir. Softw. Eng. 17 (4) (2012) 531-577.
2. N. Nagappan, T. Ball, A. Zeller, Mining metrics to predict component failures, in: Proceedings of the 2006 International Conference on Software Engineerin 2006, pp. 452-461.
3. A.E. Hassan, Predicting faults using the complexity of code changes, in: Proceedings of the 2009 International Conference on Software Engineering, 2009, pp. 78 4. S. Kim, T. Zimmermann, E. Whitehead Jr, A. Zeller,
Predicting faults from cached history, in: Proceedings of the 2007 International Conference on Software Engineering, 2007, pp. 489
5. E. Arisholm, L.C. Briand, M.J. Fuglerud, Data mining techniques for building faultproneness models in telecom java software, in: Proceedin
International Symposium on Software Reliability Engineering, 2007, pp. 215
6. T.J. Ostrand, E.J. Weyuker, How to measure success of fault prediction models, in: Proceedings of the Fourth InternationalWorkshop on Software Quality Assur in Conjunction with the 6th ESEC/FSE Joint Meeting, 2007, pp. 25-30.
7. H.Y. Zhang, An investigation of the relationships between lines of code and defects, in: Proceedings of 2009 IEEE International Conference on Software Maintainance, 2009, pp. 274
8. Y.M. Zhou, B.W. Xu, H. Leung, On the ability of complexity metrics to predict faultprone classes in object-oriented systems,
660-674.
9. M. D’Ambros, M. Lanza, R. Robbes, On the relationship between change coupling and softw
Proceedings of the 16thWorking Conference on Reverse Engineering, 2009, pp. 135
10. N. Nagappan, T. Ball, Using software dependencies and churn metrics to predict field failures: An empirical case study, in: Proceedings of First Internati
on Empirical Software Engineering and Measurement, 2007, pp. 364-373.
11. T.M. Khoshgoftaar, N. Seliya, Analogy
classification rules for software quality estimation, Empir. Softw. Eng. 8 (4) (2003) 325
12. E.J. Weyuker, T.J. Ost
information as a factor for fault prediction, in: Proceedings of the 3rd International Workshop on Predictor Models in Software Engineering, 2007, pp. 1 7.
13. C. Bird, N. Nagappan, H. Gall, B. Murphy, P. Devanbu, Putting it all together: using socio
predict failures, in: Proceedings of the 20th International Symposium on Software Reliability Engineering, 2009, pp. 109-119.
14. T.M. Khoshgoftaar, K. Gao, N. Seliya, Attribute selection and imbalanced data: probl
defect prediction, in: Proceedings of the 22nd IEEE International Conference on Tools with Artificial Intelligence, 1, 2010, pp. 137
15. M.X. Liu, L.S.Miao, D.Q. Zhang, Two
sensitive learning for software defect prediction, IEEE T. Reliab. 63 (2) (2014) 676
Software Defect Prediction Using Enhanced Relevance Vector Machine
N. Nagappan, T. Ball, A. Zeller, Mining metrics to predict component failures, in: Proceedings of the 2006 International Conference on Software Engineering, A.E. Hassan, Predicting faults using the complexity of code changes, in: Proceedings of the 2009 International Conference on Software Engineering, 2009, pp. 78-88. S. Kim, T. Zimmermann, E. Whitehead Jr, A. Zeller,
from cached history, in: Proceedings of the 2007 International Conference on Software Engineering, 2007, pp. 489-498.
E. Arisholm, L.C. Briand, M.J. Fuglerud, Data mining techniques for building faultproneness models in telecom java software, in: Proceedings of the 18th IEEE International Symposium on Software Reliability Engineering, 2007, pp. 215-224.
T.J. Ostrand, E.J. Weyuker, How to measure success of fault prediction models, in: Proceedings of the Fourth InternationalWorkshop on Software Quality Assurance: in Conjunction with the 6th ESEC/FSE Joint Meeting, H.Y. Zhang, An investigation of the relationships between lines of code and defects, in: Proceedings of 2009 IEEE International Conference on Software Maintainance, 2009, pp. 274-283.
Y.M. Zhou, B.W. Xu, H. Leung, On the ability of complexity metrics to predict faultprone classes in oriented systems, J. Syst. Software 83 (4) (2010) M. D’Ambros, M. Lanza, R. Robbes, On the relationship between change coupling and software defects, in: Proceedings of the 16thWorking Conference on Reverse Engineering, 2009, pp. 135-144.
N. Nagappan, T. Ball, Using software dependencies and churn metrics to predict field failures: An empirical case study, in: Proceedings of First International Symposium on Empirical Software Engineering and Measurement, T.M. Khoshgoftaar, N. Seliya, Analogy-based practical classification rules for software quality estimation, Empir. Softw. Eng. 8 (4) (2003) 325-350.
E.J. Weyuker, T.J. Ostrand, R.M. Bell, Using developer information as a factor for fault prediction, in: Proceedings of the 3rd International Workshop on Predictor Models in Software Engineering, 2007, pp. 1-C. Bird, N. Nagappan, H. Gall, B. Murphy, P. Devanbu,
l together: using socio-technical networks to predict failures, in: Proceedings of the 20th International Symposium on Software Reliability Engineering, 2009, T.M. Khoshgoftaar, K. Gao, N. Seliya, Attribute selection and imbalanced data: problems in software defect prediction, in: Proceedings of the 22nd IEEE International Conference on Tools with Artificial Intelligence, 1, 2010, pp. 137-144.
International Journal of Recent Scientific Research Vol. 9, Issue, 2(B), pp. 23860-23864, February, 2018
16. S. Shivaji, E.J. Whitehead Jr, R. Akella, S. Kim, Reducing features to improve code change-based bug prediction, IEEE T. Softw. Eng. 39 (4) (2013) 552-569. 17. H.M. Olague, L.H. Etzkorn, S. Gholston, S.
Quattlebaum, Empirical validation of three software metrics suites to predict fault-roneness of object-oriented classes developed using highly iterative or agile software development processes, IEEE T. Softw. Eng. 33 (6) (2007) 402-419.
18. O. Mizuno, T. Kikuno, Training on errors experiment to detect fault-prone software modules by spam filter, in: Proceedings of the 6th joint meeting of the European software engineering conference and the ACM SIGSOFT symposium on The foundations of software engineering, 2007, pp. 405-414.
19. S. Bibi, G. Tsoumakas, I. Stamelos, I.P. Vlahavas, Software defect prediction using regression via classification, in: Proceedings of IEEE International Conference on Computer Systems and Applications, 2006, pp. 330-336.
20. T.M. Khoshgoftaar, X.J. Yuan, E.B. Allen, W.D. Jones, J.P. Hudepohl, Uncertain classification of fault-prone software modules, Empir. Softw. Eng. 7 (4) (2002) 297-318.
21. D.K. Yadav, S.K. Charurvedi, R.B. Mishra, Early software defects prediction using fuzzy logic, Int. J. Performability Eng. 8 (4) (2012) 399-408.
22. Okutan, O.T. Yildiz, Software defect prediction using Bayesian networks, Empirical Softw. Eng. 19 (1) (2014) 154-181.
23. Y. Maa, S. Zhua, K. Qin, G. Luo, Combining the requirement information for software defect estimation in design time, Inform. Process. Lett. 114 (9) (2014) 469-474.
24. D. Liu, T.R. Li, J.B. Zhang, Incremental updating approximations in probabilistic rough sets under the variation of attributes, Knowl-Based Syst. 73 (2015) 81-96.
25. PC1 and CM1 dataset - http://promise.site.uottawa.ca/ SERepository
*******
How to cite this article: