R E S E A R C H
Open Access
Vancomycin-resistant enterococci (VRE)
screening and isolation in the general
medicine ward: a cost-effectiveness analysis
Stephen Mac
1,2*, Tiffany Fitzpatrick
3, Jennie Johnstone
3,4,5and Beate Sander
1,2,5,6Abstract
Background:Vancomycin-resistant enterococci (VRE) are a serious antimicrobial resistant threat in the healthcare setting. We assessed the cost-effectiveness of VRE screening and isolation for patients at high-risk for colonisation on a general medicine ward compared to no VRE screening and isolation from the healthcare payer perspective. Methods:We developed a microsimulation model using local data and VRE literature, to simulate a 20-bed general medicine ward at a tertiary-care hospital with up to 1000 admissions, approximating 1 year. Primary outcomes were accrued over the patient’s lifetime, discounted at 1.5%, and included expected health outcomes (VRE colonisations, VRE infections, VRE-related bacteremia, and deaths subsequent to VRE infection), quality-adjusted life years (QALYs), healthcare costs, and incremental cost-effectiveness ratio (ICER). Probabilistic sensitivity analysis (PSA) and scenario analyses were conducted to assess parameter uncertainty.
Results:In our base-case analysis, VRE screening and isolation prevented six healthcare-associated VRE colonisations per 1000 admissions (6/1000), 0.6/1000 VRE-related infections, 0.2/1000 VRE-related bacteremia, and 0.1/1000 deaths subsequent to VRE infection. VRE screening and isolation accrued 0.0142 incremental QALYs at an incremental cost of $112, affording an ICER of $7850 per QALY. VRE screening and isolation practice was more likely to be cost-effective (> 50%) at a cost-cost-effectiveness threshold of $50,000/QALY. Stochasticity (randomness) had a significant impact on the cost-effectiveness.
Conclusion:VRE screening and isolation can be cost-effective in majority of model simulations at commonly used cost-effectiveness thresholds, and is likely economically attractive in general medicine settings. Our findings
strengthen the understanding of VRE prevention strategies and are of importance to hospital program planners and infection prevention and control.
Keywords:Infection control, Vancomycin-resistant enterococci, VRE, Hospital-acquired infection, Antimicrobial resistance, Health economics, Cost-effectiveness analysis
Introduction
Vancomycin-resistant enterococci (VRE) are a class of antimicrobial resistant (AMR) bacteria most commonly transmitted within healthcare settings [1]. While im-munocompetent patients have a low risk of acquiring VRE infections post-colonisation, other patient groups
(e.g. immunocompromised, oncology, transplant) are at a higher risk of developing VRE-related bacteremia and other infections [2]. Consequently, patients who develop VRE-related infections require longer hospital stays, have a higher risk of mortality, and substantially higher medical costs. A study from Canada estimated the mean attributable cost and length of stay for patients with VRE colonisation/infection to be $17,949 and 13.8 days, respectively, when compared to patients without VRE [3].
Guidelines for control of VRE from health agencies (e.g. Centers of Disease Control and Prevention) in the United States and the United Kingdom recommend
© The Author(s). 2019Open AccessThis article is distributed under the terms of the Creative Commons Attribution 4.0 International License (http://creativecommons.org/licenses/by/4.0/), which permits unrestricted use, distribution, and reproduction in any medium, provided you give appropriate credit to the original author(s) and the source, provide a link to the Creative Commons license, and indicate if changes were made. The Creative Commons Public Domain Dedication waiver (http://creativecommons.org/publicdomain/zero/1.0/) applies to the data made available in this article, unless otherwise stated. * Correspondence:[email protected]
1Institute of Health Policy, Management and Evaluation, University of Toronto, 155 College Street, Suite 425, Toronto, ON M5T 3M6, Canada 2Toronto Health Economics and Technology Assessment (THETA) Collaborative, University Health Network, 200 Elizabeth Street, 10th Floor, Room 247, Toronto, ON M5G 2C4, Canada
control of VRE spread through vancomycin usage, screening and isolation of patients with VRE in hospital settings, education, cleaning and contact precautions
(e.g. gloves) [4, 5]. Similarly in Canada, provincial
com-mittees recommend the implementation of active VRE screening programs for patients at high-risk of VRE col-onisation [6]. Risk factors for VRE colcol-onisation include: previous admission to healthcare facilities (e.g. hospital); dialysis recipient; transfer from long-term care facilities; and previous receipt of certain classes of antibiotics (e.g. cephalosporin) [6].
In 2014, the Canadian Agency for Drugs and Technol-ogy for Health (CADTH) conducted a rapid response re-view on the cost-effectiveness of patient screening and isolation for VRE and identified one economic evaluation from France, where the direct cost of an outbreak trig-gered by a failure in systematic VRE screening had a direct
cost of€60,524 [7]. Two economic evaluations from
hos-pital settings reported a net benefit of using a VRE control strategy [8,9].
Based on the current literature, there are no cost-effectiveness analyses for VRE screening and isolation practices that included health outcomes in evaluating the value of this control strategy. The objective of our study was to conduct a cost-effectiveness analysis of ac-tive VRE screening and isolation compared to no VRE screening and isolation in the general medicine ward of a tertiary care hospital. Due to conflicting evidence on the value of prevention programs for VRE, we decided to model a general medicine ward instead of an intensive care unit (ICU) because of its heterogeneous nature (i.e. varying patient risk for VRE colonisation and in-fections). Evidence from this model can inform decision-makers, program planners and clinicians contemplating control strategies for healthcare-associated VRE-related infections.
Methods
A cost-effectiveness analysis (CEA) was conducted from the Ontario healthcare payer perspective (Ministry of Health and Long-Term Care). Health outcomes were
accrued over a patients’ lifetime and included:
healthcare-associated VRE colonisations, VRE-related infections (e.g. bacteremia and other infections), deaths subsequent to VRE infection, and quality-adjusted life years (QALY). All publicly-funded healthcare costs (2017 Canadian dollars) were included. The primary outcomes were total healthcare costs, QALYs, and the incremental cost-effectiveness ratio (ICER) expressed in $ per QALY gained. Cost-effectiveness of VRE screen-ing and isolation was assessed against the commonly used cost-effectiveness threshold (CET) of $50,000 per QALY gained [10]. We followed CADTH guidelines and reported outcomes discounted at 1.5% [11].
Model structure and patient population
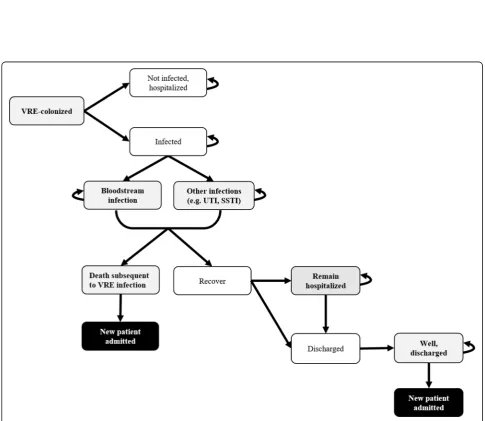
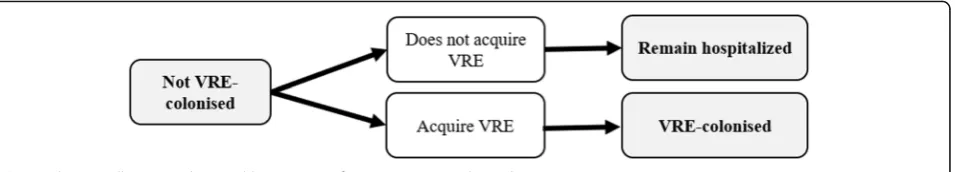
A microsimulation model was developed to capture the natural history of VRE health burden starting at hospital admission. Schematics of the model are presented in
Figs.1,2and3. The model simulated a dynamic
popula-tion of 20 patients in the general medicine ward, i.e., pa-tient flow was simulated by admitting a new papa-tient to the ward once an existing patient was discharged back into the community, or died during their hospital stay. Admitted patients were considered to be from the commu-nity; we did not take into account entry from long-term care facilities, readmissions, or ICU step-downs. For base-case analysis, we evaluated the cost-effectiveness of VRE screening and isolation through 1000 admissions, approxi-mating 1 year. After 1000 admissions, hospital admissions stopped, and patients were followed over their lifetime. All modelling and analyses were conducted using TreeAge Pro 2018 (TreeAge Software, Inc., Williamstown, MA).
VRE transmission
A two-state dynamic transmission component simulated VRE transmission. The probability of acquiring VRE re-sponds to changes to the number of VRE-colonised pa-tients in the ward who are not isolated and was modeled using the following equation [12]:
Ctþ1=St¼1‐e‐βCt=N
Where t represents the specific cycle or time period,
Ct + 1 is the number of patients who are VRE colonised
(but not isolated) in the current cycle, N is total number
of patients, St represents the total number of patients
susceptible to VRE colonisation in the previous cycle,
and β is the basic reproductive number of VRE. The
basic reproductive number was defined as the number of new infections generated per infected (non-isolated) in-dividual per unit of time. For our model, we assumed a constant basic reproductive number of 1.32.
Key assumptions
Several key assumptions were made on VRE transmis-sion and isolation parameters. These included: 1) VRE rectal swab screen are completed concurrently with
Methicillin-resistantStaphylococcus aureus(MRSA)
Fig. 1Schematic illustrating the possible trajectory of an admitted inpatient (screened or not, depending on the strategy)
status of the prior patient in the room was not factored into transmission.
Data sources
A targeted literature search was conducted to extract outcome probabilities, costs and quality-of-life
parame-ters related to VRE health states (Table 1). When
pos-sible, Canadian-specific parameters were used. Where
“assumption”is indicated in Table 1, we were guided by
expert opinion.
Probabilities
The basic reproductive rate for VRE was uncertain and can vary depending on the environment. We used results from a meta-analysis of 10 studies that reported a repro-ductive rate of 1.32 (95% CI, 1.03–1.46) [13]. Length of stay (LOS) estimates used for patients with VRE infections was
39 days (IQR, 22–81 days) and without VRE infections was
3 days (IQR, 1–6 days), extracted from a case-control study in Canada [2]. We used a screening rectal swab sensitivity of 0.99 (95% CI, 0.952–1.00) and specificity of 0.948 (95%
CI, 0.922–0.968) from an United States study evaluating
the swab detection ofE. faeciumandE. faecalis[16]. Preva-lence of VRE for low-risk patients was 0.023, which was extracted from a Canadian study in 2012 [14]. The prob-ability that a patient was at“high-risk”of colonisation was guided by the average age (61 years) of the cohort of pa-tients who acquired VRE-bacteremia in Canada [2]. All-cause mortality from all-All-causes were derived from life ta-bles from Statistics Canada [29].
Utilities
To properly value health outcomes for CEAs, we used health state utility values (utilities), which is a preference-based value expressing the quality-of-life associated with health states [30]. Utilities for this study could have ranged between 0 (health state equivalent to death) to one (per-fect health). The utility of a VRE-colonised patient was considered to be the same as that of a general inpatient (0.642), which was obtained from a mixed population of inpatients using the EuroQol rating scale [25]. The utility for the well outpatient state was derived from a study of community-dwelling adults using the Health Utilities Index to be 0.93 (0.86 for patients who recovered from a
VRE-related infection) [28]. Due to data limitations, bacteremia utility (0.56) was extracted from a MRSA-related bacteremia study [23]. Since urinary tract infec-tions (UTI) represented the greatest percentage of VRE-related infections [3, 31], we used the UTI utility of 0.60 for all other infections [24]. We assumed a disutility with being isolated (i.e. being isolated leads to less visits from healthcare workers, reduced socialization, and space con-finement), which was equivalent to mild depression (un-treated), and applied a multiplicative 0.895 reduction factor [27].
Costs
All direct costs were extracted from the literature (Table 1). We counted the cost of the screening as a one-time up-front cost at ward admission between $12 and $24, depending on the culture result (positive results being more expensive due to additional microbiologist time re-quired) [9]. All costs were converted and standardized to 2017 Canadian dollars. For private room costs, we used the median from estimates across Ontario ($290 per night) [21].
Analysis
The base-case analysis was defined as follows: screening with 95% specificity and 99% sensitivity, VRE basic re-productive number of 1.32 [13], and mean age of high-risk patients at 61 years [2]. The baseline prevalence of VRE was 0.023 and we assumed patients at higher risk for VRE colonisation were four times more likely to be colonised (0.092). The base-case analysis was conducted from a Canadian perspective.
We conducted multiple scenario analysis including: uni-versal screening and isolation for all patients, increased duration of the program (5000 admissions), number of beds, and a lower effectiveness (compliance) of the isola-tion program.
We conducted a probabilistic sensitivity analysis (PSA) using gamma distributions for costs, beta distributions for utilities and transitional probabilities, and normal distributions for other patient or VRE-related
parame-ters (see Table 1). From the PSA, we generated a
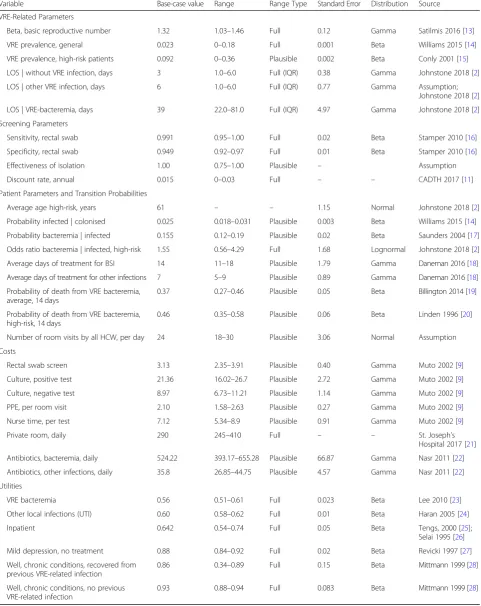
Table 1Input parameter base-case values, plausible ranges and distributions
Variable Base-case value Range Range Type Standard Error Distribution Source
VRE-Related Parameters
Beta, basic reproductive number 1.32 1.03–1.46 Full 0.12 Gamma Satilmis 2016 [13] VRE prevalence, general 0.023 0–0.18 Full 0.001 Beta Williams 2015 [14] VRE prevalence, high-risk patients 0.092 0–0.36 Plausible 0.002 Beta Conly 2001 [15] LOS | without VRE infection, days 3 1.0–6.0 Full (IQR) 0.38 Gamma Johnstone 2018 [2] LOS | other VRE infection, days 6 1.0–6.0 Full (IQR) 0.77 Gamma Assumption;
Johnstone 2018 [2] LOS | VRE-bacteremia, days 39 22.0–81.0 Full (IQR) 4.97 Gamma Johnstone 2018 [2] Screening Parameters
Sensitivity, rectal swab 0.991 0.95–1.00 Full 0.02 Beta Stamper 2010 [16] Specificity, rectal swab 0.949 0.92–0.97 Full 0.01 Beta Stamper 2010 [16]
Effectiveness of isolation 1.00 0.75–1.00 Plausible – Assumption
Discount rate, annual 0.015 0–0.03 Full – – CADTH 2017 [11]
Patient Parameters and Transition Probabilities
Average age high-risk, years 61 – – 1.15 Normal Johnstone 2018 [2]
Probability infected | colonised 0.025 0.018–0.031 Plausible 0.003 Beta Williams 2015 [14] Probability bacteremia | infected 0.155 0.12–0.19 Plausible 0.02 Beta Saunders 2004 [17] Odds ratio bacteremia | infected, high-risk 1.55 0.56–4.29 Full 1.68 Lognormal Johnstone 2018 [2] Average days of treatment for BSI 14 11–18 Plausible 1.79 Gamma Daneman 2016 [18] Average days of treatment for other infections 7 5–9 Plausible 0.89 Gamma Daneman 2016 [18] Probability of death from VRE bacteremia,
average, 14 days
0.37 0.27–0.46 Plausible 0.05 Beta Billington 2014 [19] Probability of death from VRE bacteremia,
high-risk, 14 days
0.46 0.35–0.58 Plausible 0.06 Beta Linden 1996 [20] Number of room visits by all HCW, per day 24 18–30 Plausible 3.06 Normal Assumption
Costs
Rectal swab screen 3.13 2.35–3.91 Plausible 0.40 Gamma Muto 2002 [9]
Culture, positive test 21.36 16.02–26.7 Plausible 2.72 Gamma Muto 2002 [9] Culture, negative test 8.97 6.73–11.21 Plausible 1.14 Gamma Muto 2002 [9] PPE, per room visit 2.10 1.58–2.63 Plausible 0.27 Gamma Muto 2002 [9] Nurse time, per test 7.12 5.34–8.9 Plausible 0.91 Gamma Muto 2002 [9]
Private room, daily 290 245–410 Full – – St. Joseph’s
Hospital 2017 [21] Antibiotics, bacteremia, daily 524.22 393.17–655.28 Plausible 66.87 Gamma Nasr 2011 [22] Antibiotics, other infections, daily 35.8 26.85–44.75 Plausible 4.57 Gamma Nasr 2011 [22] Utilities
VRE bacteremia 0.56 0.51–0.61 Full 0.023 Beta Lee 2010 [23]
Other local infections (UTI) 0.60 0.58–0.62 Full 0.01 Beta Haran 2005 [24]
Inpatient 0.642 0.54–0.74 Full 0.05 Beta Tengs, 2000 [25];
Selai 1995 [26] Mild depression, no treatment 0.88 0.84–0.92 Full 0.02 Beta Revicki 1997 [27] Well, chronic conditions, recovered from
previous VRE-related infection
0.86 0.34–0.89 Full 0.15 Beta Mittmann 1999 [28] Well, chronic conditions, no previous
VRE-related infection
0.93 0.88–0.94 Full 0.083 Beta Mittmann 1999 [28] BSIbloodstream infection,CADTHCanadian Agency for Drugs and Technology in Health,HCWhealthcare workers,IQRinterquartile range,LOSlength of stay,PPE
cost-effective at CET of $0 to $100,000 per QALY. We also assessed expected value of perfect information at several CETs to assess the value of information; i.e., whether or not to invest more resources to reduce par-ameter uncertainty. As recommended by CADTH, we did not conduct deterministic sensitivity analysis because of model stochasticity and the non-linear relationship of VRE prevalence and transmission parameters. We re-ported results following the Consolidated Health
Eco-nomic Evaluation Reporting Standards (CHEERS)
Guidelines (Additional file1) [32].
Results
Base-case analysis
In Table 2, we summarized the estimated health
out-comes, costs and ICER for the VRE screening and isola-tion strategy compared to no VRE screening and isolation over 1000 admissions for our base-case ana-lysis. We calculated the difference in the health
out-comes and the relative change using the “no VRE
screening and isolation” strategy as the baseline. VRE
screening and isolation reduced healthcare-associated VRE colonisations by six per 1000 patients (2/1000 with screening and isolation vs. 8/1000 without, 73% reduc-tion), VRE-related infections by 0.6 per 1000 patients (5.7/1000 with screening and isolation vs. 6.3/1000 with-out, 10%), VRE-related bacteremia by 0.2 per 1000 pa-tients (2.5/1000 with screening and isolation vs. 2.7/1000 without, 7%) and deaths subsequent to VRE infection by 0.1 per 1000 (0.5/1000 with screening and isolation vs. 0.6/1000 without, 8%).
The incremental cost and effect for VRE screening and isolation was $110 ($118.37 with screening and isolation vs. $6.72 without), and 0.0142 QALY gained (20.5607 QALY with screening and isolation vs. 20.5465 QALY without), respectively. The ICER for VRE screening and isolation was $7850 per QALY gained.
Uncertainty: probabilistic sensitivity analysis
Figure 4 illustrates a CEAC where at low CETs below
$7500/QALY, it was unlikely that VRE screening and isolation was a cost-effective strategy. At a CET of ap-proximately $7500/QALY, VRE screening and isolation became more likely to be cost-effective (over 50% of the iterations). As the CET increased to $50,000 per QALY, the probability of this program being cost-effective as-ymptotes at approximately 51.4%.
Since VRE screening and isolation reached a plateau of 51% likelihood of being cost-effective, an expected value of perfect information (EVPI) analysis was conducted to determine the value of reducing further uncertainty at three points. At a CET of $7500, and $50,000 per QALY, the EVPI (assuming 1000 patients) was $1065, and $7093, respectively.
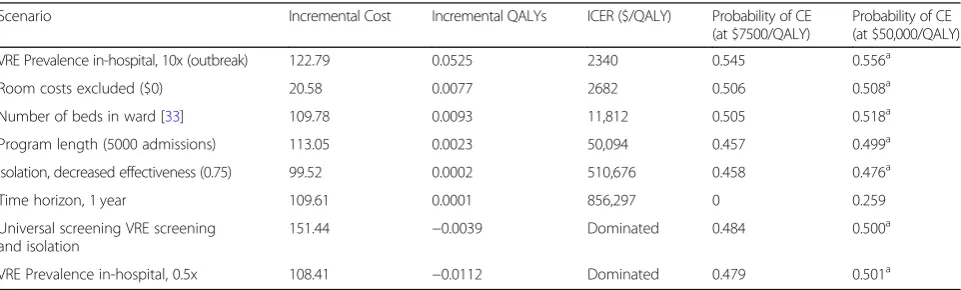
Scenario analysis
In the scenario where the prevalence is lower (i.e. reduced by half; 0.0115), VRE screening and isolation becomes a dominated strategy: the program cost an additional $123 but resulted in fewer QALYs. On the other hand, we mod-eled a scenario similar to outbreaks in the literature where the VRE prevalence was about 10-fold higher (0.23), and estimated that VRE screening and isolation cost $122.79 for an incremental increase of 0.0525 QALY. Under this increased prevalence scenario over 1000 hospital admis-sions, the ICER was $2340/QALY. All scenarios are sum-marized in Table3.
Scenario analysis was conducted where the private room costs were excluded due to conflicting views on whether these costs are considered from the Ontario healthcare payer perspective. In this scenario, VRE screening and iso-lation program cost an additional $20.58 for 0.0077 QALYs, resulting in an ICER of $2682/QALY. The num-ber of beds in the simulated general medicine ward was increased to 30. The cost-effectiveness of VRE screening and isolation over 5000 admissions was also estimated.
Table 2Base-case results (health and economic outcomes)
Outcomes VRE screening and isolation No VRE screening and isolation Differencea(%)
Non-isolated cases 11/1000 60/1000 −49/1000 (82%)
Healthcare-associated VRE-colonisation 2/1000 8/1000 −6/1000 (73%)
Infected cases 5.7/1000 6.3/1000 −0.6/1000 (10%)
VRE-related bacteremia 2.6/1000 2.8/1000 −0.2/1000 (7%)
Other VRE infections (e.g. UTI) 3.2/1000 3.6/1000 −0.4/1000 (12%)
Deaths subsequent to VRE infection 0.5/1000 0.6/1000 −0.1/1000 (8%)
ICER ($/QALY) 7850
Total costs ($) 118.37 6.72 112
Total QALY gained 20.5607 20.5465 0.0142
a
Difference for health outcomes were calculated by subtracting“no VRE screening and isolation strategy”outcomes from“VRE screening and isolation strategy”
outcomes. Percentage change was calculated relative to“no VRE screening and isolation strategy”outcomes
The estimated ICERs for these scenarios were $11,812/ QALY and $50,094/QALY, respectively.
Universal VRE screening and isolation for all patients, regardless of whether they identified as high-risk for col-onisation, was a dominated strategy (i.e. resulted in in-cremental cost of $151.44 and QALYs lost). We also estimated the cost-effectiveness of this program if the isolation effectiveness was reduced to 75%. In this sce-nario, VRE screening and isolation cost an additional $99.52 for 0.0002 QALYs, resulting in an ICER of $510, 676/QALY.
Discussion
Based on our base-case analysis, VRE screening and isola-tion for patients at high-risk for VRE colonisaisola-tion pre-vented healthcare-associated colonisations, and ultimately VRE-related infections and deaths subsequent to infec-tions. The program was considered cost-effective with an
ICER of $7850 per QALY when compared to commonly used cost-effectiveness thresholds of $50,000/QALY [10].
Overall, our model’s results were consistent with the
findings of several other published studies [34–37]. A
study by Shadel et al. found that active VRE screening and isolation resulted in 91% of VRE colonisations being identified on an ICU; our model suggested 82% of VRE positive patients were isolated under an active, targeted screening strategy in a general medicine ward [34]. A mathematical model of a 10-bed ICU active screening program for VRE predicted 9.9 cases of VRE colonisa-tion/infection prevented over 1000 model simulations in the ICU with a prevalence rate of 5% [35]. Similarly, our model predicts a reduction of 6 cases of VRE colonisa-tions over 1000 admissions. Our model underestimated the effect of the VRE screening and isolation compared to both studies, likely because it was modeled after a general medicine ward which has a lower proportion of high-risk patients (for VRE colonisation and infection) than the Fig. 4Cost-effectiveness acceptability curve (CEAC) for cost-effectiveness thresholds from $0 to $50,000/QALY
Table 3Incremental cost-effectiveness ratios for VRE screening and isolation program in various scenarios
Scenario Incremental Cost Incremental QALYs ICER ($/QALY) Probability of CE (at $7500/QALY)
Probability of CE (at $50,000/QALY)
VRE Prevalence in-hospital, 10x (outbreak) 122.79 0.0525 2340 0.545 0.556a
Room costs excluded ($0) 20.58 0.0077 2682 0.506 0.508a
Number of beds in ward [33] 109.78 0.0093 11,812 0.505 0.518a
Program length (5000 admissions) 113.05 0.0023 50,094 0.457 0.499a
Isolation, decreased effectiveness (0.75) 99.52 0.0002 510,676 0.458 0.476a
Time horizon, 1 year 109.61 0.0001 856,297 0 0.259
Universal screening VRE screening and isolation
151.44 −0.0039 Dominated 0.484 0.500a
VRE Prevalence in-hospital, 0.5x 108.41 −0.0112 Dominated 0.479 0.501a
a
Signifies asymptote at that probability at $50,000/QALY
ICU. However, similar to other studies, our model esti-mated that active VRE screening and isolation strategy was cost-effective by reducing the number of VRE-related bacteremia events by 2/10,000 patients [36,37].
Our study has several limitations. Health state utilities were not specific to VRE infections and preference elicit-ation was heterogeneous. To address this and other param-eter uncertainty (e.g. costs and transition probabilities), we conducted a PSA with the appropriate underlying distribu-tion for all parameters to generate a CEAC for cost-effectiveness thresholds of $0 to $50,000/QALY. VRE screening and isolation was more likely to be cost-effective than no VRE screening and isolation at a CET of $7500/ QALY or greater. However, as the CET increased to $50, 000/QALY, the likelihood of the program being cost-effective in extended simulations remained steady at 51%, suggesting that stochasticity (randomness) is a significant factor in determining the value of this control program. This was expected for this type of intervention since indi-vidual level uncertainty with patients entering a general medicine ward and the baseline VRE prevalence can influ-ence VRE transmission.
Our study assumed a general medicine ward that was set up with 20 single bed rooms, which may not be the configuration of all general medicine wards. In a sce-nario where 30-beds were used, the ICER increased to $11,812/QALY. These results suggest that an increase in the number of beds would still yield cost-effective VRE screening and isolation practices due to the homoge-neous mixing assumption. This assumption was made despite knowing that VRE transmission can be highly complex and depend on colonization pressure and dens-ity of bacteria [33]. Incorporating such detail of VRE colonization levels within the transmission modeling of this CEA would require much more sophisticated VRE surveillance data that was not available. We did not ex-plore the value of this program in which patients shared rooms. However, based on Hamel et al., the hazard ratio
for VRE colonisation was 1.11 (95% CI, 1.02–1.21) for
the number of roommate exposures per day [38]. Our estimates using a single-bed room assumption was a conservative approach, and therefore likely underesti-mated the cost-effectiveness of a VRE screening and iso-lation control program. Our model likely provided a conservative estimate of the cost-effectiveness (i.e. un-derestimates the value) of VRE screening and isolation due to key assumptions required for our analysis (e.g. did not incorporate time dependency within the ward, or re-admissions).
Isolation was assumed to be completely effective in our base-case analysis, which can be considered optimis-tic in current healthcare settings given the potential for human errors, and overall burden on healthcare workers [39, 40]. We performed a scenario analysis based on a
study by Huskins and colleagues suggesting prevention
effectiveness of 75% (range 62–82%) [40], and the ICER
increased to $510,676/QALY. In this scenario, VRE screening and isolation would unlikely be cost-effective at commonly used thresholds. Due to stochasticity (ran-domness), it is likely that the cost-effectiveness and iso-lation effectiveness have a nonlinear reiso-lationship. This may be of note to decision-makers and infection preven-tion and control practipreven-tioners, to ensure implementapreven-tion of this program is as seamless as possible.
Cost-effectiveness analyses for screening programs of other AMR bacteria such as carbapenemase-producing
Enterobacteriaceae and MRSA have been published in
the literature [41, 42]. Similar to these other economic
evaluations on AMR bacteria screening and isolation, our results indicated that VRE screening and isolation was likely to be cost-effective. To our knowledge, this is the first cost-effectiveness analysis for VRE screening and isolation in any hospital setting that incorporated costs, health outcomes, and QALYs, accrued over a
pa-tient’s lifetime. We reported health outcomes per 1000
patients to allow for transferability of our results to gen-eral medicine wards in different jurisdictions. Moreover, the results of this cost-effectiveness analysis can be generalizable to other jurisdictions (countries) with simi-lar healthcare system financing to Canada such as Australia, the United Kingdom, and parts of Europe. We also estimated the cost-effectiveness of this program in varying scenarios (e.g. varying VRE prevalence, number of beds) to provide decision-makers with economic evi-dence to support local health policy given the import-ance of local context.
Given the limited body of evidence in this area, we were unable to find a suitable source of data against which to validate our results. As more local research on AMR bac-teria continues, it will allow for future models to be cross-validated to health outcomes using health administrative data, ward caseload (e.g. bed capacity), admission data (e.g. population characteristics), and number of VRE-related bacteremia cases.
Conclusion
Supplementary information
Supplementary informationaccompanies this paper athttps://doi.org/10. 1186/s13756-019-0628-x.
Additional file 1.CHEERS Checklist.
Abbreviations
AMR:Antimicrobial resistant; CADTH: Canadian Agency for Drugs and Technology for Health; CEAC: Cost-effectiveness acceptability curve; CET: Cost-effectiveness threshold; CHEERS: Consolidated Health Economic Evaluation Reporting Standards; CI: Confidence interval; EVPI: Expected value of perfect information; ICER: Incremental cost-effectiveness ratio;
ICU: Intensive care unit; IQR: Interquartile range; LOS: Length of stay; MRSA: Methicillin-resistantStaphylococcus aureus; PPE: Personal protective equipment; PSA: Probabilistic sensitivity analysis; QALY: Quality-adjusted life year; UTI: Urinary tract infection; VRE: Vancomycin-resistantenterococci
Acknowledgements
Not applicable.
Authors’contributions
SM developed the model, acquired the data, carried out analyses, interpreted the results, and drafted the manuscript. TF developed the model, acquired the data, and drafted the manuscript. JJ initiated the study, acquired the data and interpreted the results. BS initiated the study, interpreted the results, and supervised the study. All authors critically reviewed and revised the manuscript, and approved the final version of the manuscript.
Funding
This study did not receive any source of funding. Presentation of interim results at 2018 AMMI Canada–CACMID Annual Conference was supported by the Canadian Institute for Health Research (CIHR) Institute Community Support Travel Award (ISU-157466).
Availability of data and materials
All data generated or analysed during this study are included in this article.
Ethics approval and consent to participate
Not applicable.
Consent for publication
Not applicable.
Competing interests
The authors declare that they have no competing interests.
Author details
1Institute of Health Policy, Management and Evaluation, University of Toronto, 155 College Street, Suite 425, Toronto, ON M5T 3M6, Canada. 2Toronto Health Economics and Technology Assessment (THETA) Collaborative, University Health Network, 200 Elizabeth Street, 10th Floor, Room 247, Toronto, ON M5G 2C4, Canada.3Dalla Lana School of Public Health, University of Toronto, 155 College Street, 6th Floor, Toronto, ON M5T 3M7, Canada.4Department of Laboratory Medicine and Pathobiology, University of Toronto, 1 King’s College Circle, Toronto, ON M5S 1A8, Canada. 5Public Health Ontario, 480 University Avenue, Suite 300, Toronto, ON M5G 1V2, Canada.6ICES, G1 06, 2075 Bayview Avenue, Toronto, ON M4N 3M5, Canada.
Received: 1 August 2019 Accepted: 16 October 2019
References
1. Government of Canada. Canadian Antimicrobial Resistance Surveillance System 2017 Report [Internet]. 2017 [cited 2018 Apr 1]. Available from:
https://www.canada.ca/en/public-health/services/publications/drugs-health- products/canadian-antimicrobial-resistance-surveillance-system-2017-report-executive-summary.html#fn3
2. Johnstone J, Chen C, Rosella L, Adomako K, Policarpio ME, Lam F, et al. Patient- and hospital-level predictors of vancomycin-resistant Enterococcus (VRE) bacteremia in Ontario, Canada. Am J Infect Control. 2018;46(11):1266–71. 3. Lloyd-Smith P, Younger J, Lloyd-Smith E, Green H, Leung V, Romney MG.
Economic analysis of vancomycin-resistant enterococci at a Canadian hospital: assessing attributable cost and length of stay. J Hosp Infect. 2013;85(1):54–9. 4. Siegel JD, Rhinehart E, Jackson M, Chiarello L, Gordon SM, Harrell LJ, et al.
2007 guideline for isolation precautions: preventing transmission of infectious agents in health care settings. Am J Infect Control. 2007;35:S65–164. 5. Cookson BD, Macrae MB, Barrett SP, Brown DFJ, Chadwick C, French GL,
et al. Guidelines for the control of glycopeptide-resistant enterococci in hospitals *. J Hosp Infect. 2006;62:6–21.
6. Ontario Agency for Health Protection and Promotion PIDAC. Annex A: Screening, Testing and Surveillance for Antibiotic-Resistant Organisms (AROs) in All Health Care Settings. Toronto, ON; 2013.
7. Canadian Agency for Drugs and Technologies in Health. Vancomycin-Resistant Enterococci Isolation and Screening Strategies: Clinical Evidence and Cost-Effectiveness. 2014.
8. Bodily M, McMullen KM, Russo AJ, Kittur ND, Hoppe-Bauer J, Warren DK. Discontinuation of reflex testing of stool samples for Vancomycin-resistant enterococci resulted in increased prevalence. Infect Control Hosp Epidemiol. 2013;34(08):838–40.
9. Muto CA, Giannetta ET, Durbin LJ, Simonton BM, Hew CLT, Farr BM. Cost-effectiveness of perirectal Surevillance cultures for controlling Vancomycin-resistant Enterococcus. Infect Control Hosp Epidemiol. 2002;23(8):429–35. 10. Grosse SD. Assessing cost-effectiveness in healthcare: history of the $50,000
per QALY threshold. Expert Rev Pharmacoecon Outcomes Res. 2008; 8(2):165–78.
11. Canadian Agency for Drugs and Technologies in Health (CADTH). Guidelines for the Economic Evaluation of Health Technologies: Canada. 4th ed. 2017. 1–76 p.
12. Anderson RM, May RM. Infectious diseases of humans: dynamics and control. Cambridge, U.K.: Oxford University Press; 1992.
13. Satilmis L, Vanhems P, Bénet T. Outbreaks of Vancomycin-resistant enterococci in hospital settings: a systematic review and calculation of the basic reproductive number. Infect Control Hosp Epidemiol. 2016; 37(3):289–94.
14. Williams V, Simor A, Kiss A, McGeer A, Hirji Z, Larios OE, et al. Is the prevalence of antibiotic-resistant organisms changing in Canadian hospitals? Comparison of point-prevalence survey results in 2010 and 2012. Clin Microbiol Infect. 2015;21:553–9.
15. Conly JM, Ofner-Agostini M, Paton S, Johnston L, Mulvey M, Kureishi A, et al. The emerging epidemiology of VRE in Canada: results of the CNISP passive reporting network, 1994 to 1998. Can J Infect Dis. 2001;12(6):364–70. 16. Stamper PD, Shulder S, Bekalo P, Manandhar D, Ross TL, Speser S, et al.
Evaluation of BBL CHROMagar VanRE for detection of vancomycin-resistant enterococci in rectal swab specimens. J Clin Microbiol. 2010;48(11):4294–7. 17. Saunders L. Morbidity and Mortality Comparing Vancomycin-SensitiveE.
faeciumand Vancomycin-Resistant E. faeciu. Am J Infect Control [Internet]. 2004 May 1 [cited 2019 Apr 6];32(3):E16–7. Available from:https:// linkinghub.elsevier.com/retrieve/pii/S0196655304001269
18. Daneman N, Rishu A, Xiong W, Palmay L, Fowler RA. Antimicrobial cost savings assocaited with shorter duration treatment for bloodstream infections. J Assoc Med Microbiol Infect Dis Canada. 2016;1(2):33–4. 19. Billington EO, Phang SH, Gregson DB, Pitout JDD, Ross T, Church DL, et al.
Incidence, risk factors, and outcomes for Enterococcus spp. blood stream infections: a population-based study. Int J Infect Dis. 2014;26:76–82. 20. Linden PK, Pasculle AW, Manez R, Kramer DJ, Fung JJ, Pinna AD, et al.
Differences in outcomes for patients with bacteremia due to vancomycin-resistant Enterococcus faecium or vancomycin-susceptible E. faecium. Clin Infect Dis. 1996;22(4):663–70.
21. St. Joseph’s Health Center. Types of Rooms [Internet]. [cited 2017 Dec 10]. Available from: https://stjoestoronto.ca/patient-care-and-services/what-to-expect-as-a-patient/types-of-rooms
22. Nasr G, Canchi D, Large J, Martin S, Sandin R, Greene J. A hospital based VRE screening for patients with hematological malignancies: a cost benefit analysis. IDSA Poster Abstr. 2011.
24. Haran MJ, Lee BB, King MT, Marial O, Stockler MR. Health status rated with the medical outcomes study 36-item short-form health survey after spinal cord injury. Arch Phys Med Rehabil. 2005;86(12):2290–5.
25. Tengs T, Wallace AMY. One thousand health-related quality-of-life estimates. Med Care. 2000;38(6):583–637.
26. Selai C, Rosser R. Eliciting EuroQol descriptive data and utility scale values from inpatients. Pharmacoeconomics. 1995;8(2):147–58.
27. Revicki D, Wood M. Patient-assigned health state utilities for depression-related outcomes: differences by depression severity and antidepressant medications. J Affect Disord. 1998;48:25–36.
28. Mittmann N, Trakas K, Risebrough N, Liu BA. Utility scores for chronic conditions in a community-dwelling population. Pharmacoeconomics. 1999; 15(4):369–76.
29. Statistics Canada. Life Tables, Canada, Provinces and Territories 1980/1982 to 2014/2016 [Internet]. 2018 [cited 2018 Nov 29]. Available from:https:// www150.statcan.gc.ca/n1/pub/84-537-x/84-537-x2018002-eng.htm
30. Torrance GW. Measurement of health state utilities for economic appraisal: A review. J Health Econ [Internet]. 1986 Mar 1 [cited 2019 Mar 6];5(1):1–30. Available from:https://www.sciencedirect.com/science/article/pii/01676296 86900202?via%3Dihub
31. Public Health Agency of Canada. Vancomycin-Resistant Enterococci Infections in Canadian Acute-Care Hospitals. 2013.
32. Husereau D, Drummond M, Petrou S, Carswell C, Moher D, Greenberg D. Consolidated health economic evaluation reporting standards (CHEERS)--explanation and elaboration: a report of the ISPOR health economic evaluations publication guidelines task force. Value Health. 2013;16:231–50. 33. Ajao AO, Harris AD, Roghmann M-C, Johnson JK, Zhan M, McGregor JC,
et al. Systematic review of measurement and adjustment for colonization pressure in studies of methicillin-resistantStaphylococcus aureus, vancomycin-resistant enterococci, andClostridium difficile acquisition. Infect Control Hosp Epidemiol [Internet]. 2011 May [cited 2019 Jul 29];32(5):481–9. Available from:http://www.ncbi.nlm.nih.gov/pubmed/21515979. 34. Shadel BN, Puzniak LA, Gillespie KN, Lawrence SJ, Kollef M, Mundy LM.
Surveillance for Vancomycin-resistant enterococci: type, rates, costs, and implications. Infect Control Hosp Epidemiol. 2006;27(10):1068–75. 35. Perencevich EN, Fisman DN, Lipsitch M, Harris AD, Morris JG Jr, Smith DL.
Projected benefits of active surveillance for Vancomycin-resistant enterococci in intensive care units. Clin Infect Dis. 2004;38(8):1108–15. 36. Faron ML, BWB NAL. Resistance Mechanisms , Epidemiology , and
Approaches to Screening. J Clin Microbiol. 2016;54(10):2436–47.
37. Montecalvo MA, Jarvis WR, Uman J, Shay DK, Petrullo C, Horowitz HW, et al. Costs and savings associated with infection control measures that reduced transmission of vancomycin-resistant enterococci in an endemic setting. Infect Control Hosp Epidemiol. 2001;22(7):437–42.
38. Hamel M, Zoutman D, O’Callaghan C. Exposure to hospital roommates as a risk factor for health care-associated infection. Am J Infect Control. 2010; 38(3):173–81.
39. Derde LPG, Cooper BS, Goossens H, Malhotra-Kumar S, Willems RJL, Gniadkowski M, et al. Interventions to reduce colonisation and transmission of antimicrobial-resistant bacteria in intensive care units: an interrupted time series study and cluster randomised trial. Lancet Infect Dis. 2014;14(1):31–9. 40. Huskins WC, Huckabee CM, O’Grady NP, Murray P, Kopetskie H, Zimmer L,
et al. Intervention to reduce transmission of resistant Bacteria in intensive care. N Engl J Med. 2011;364(15):1407–18.
41. Lapointe-Shaw L, Voruganti T, Kohler P, Thein H-H, Sander B, McGeer A. Cost-effectiveness analysis of universal screening for carbapenemase-producing Enterobacteriaceae in hospital inpatients. Eur J Clin Microbiol Infect Dis. 2017;36(6):1047–55.
42. Papia G, Louie M, Tralla A, Johnson C, Collins V, Simor AE. Screening high-risk patients for methicillin-resistant staphylococcus Aureus on admission to the hospital is it cost effective? Infect Control Hosp Epidemiol. 1999; 20(07):473–7.
Publisher’s Note