Chapter 3
Page
National Energy Context . . . 49
Current Picture and Trends . . . 49
Future Prospects . . . 50
implications for Cogeneration . . . 51
Conclusion .. .. .. .. .. .. . . 54
Electric Utilities Context . . . 54
The Electric Power Industry . . . 55
Current Status of Electric Utilities . . . 72
Regulation and Financing of Cogeneration . . . 76
Federal and State Regulation . . . 76
Financing and Ownership . . . 104
Chapter 3 References . . . 112
Tables Table No. Page 6. 1980 U.S. Energy Demand . . . 50
7. Ratio of Annual Energy Demand to GNP Growth Rates. . . . . . 50
8. Comparison of Energy Demand Projections . . . 50
9. Thermal Energy Demand. . . 53
10. U.S. Electric Power System Statistics, 1980 . . . 55
11. installed Generating Capacity, by Type of Prime Mover 1978 . . . 61
12. Differences in Financing by Form of Ownership. . . 64
13. New Capacity Additions . . . 65
14. Capital Structure for Private Utilities . . . 65
15. Sources of Long-Term Financing to REA Electric Borrowers . . . 66
16. Taxes Paid by investor-Owned Electric Utilities-Electric Department Only, 1980.. 67
17. Energy Property Eligible for ITC Under the Energy Tax Act of 1978.... . . 68
18. State Regulation of Utiiity Service and Operations.. . . 69
19. Rates for Power Purchased From Quality Facilities by State-Regulated Utilities . . . . 86
20. Capital Recovery Factors for Cogeneration . . . 106
Figures Figure No. Page 8. North American Electric Reliability Council Regions.. . . 58
9. The General Patterns of an Electric Power System . . . 59
IO. Daily Load Shapes for Five Representative Weekdays . . . 60
11. Typical Electric Distribution System . . . 62
12. Allocation of Electricity Costs . . . 63
13. Statewide Utility Resource Plan Additions 1981-82: Renewable/Innovative Technologies . . . 91
14. CWE Average Avoided Cost Paths: Baseline Construction . . . 95
Chapter 3
Context for Cogeneration
Cogeneration has attracted widespread atten-tion in recent years because of its potential for increased energy efficiency, and therefore, lower energy costs. A decision by an industrial concern, a commercial building owner, or a utility to in-vest in a cogeneration system will be based on an evaluation of the supply and price of fuel, regulatory considerations, the cost and availability of capital, tax incentives, and the technical, cost, and output characteristics of cogeneration rel-ative to conventional separate electric and ther-mal energy systems. This chapter will review the institutional, regulatory, and financial context within which cogeneration must compete against
conventional energy supplies, including the na-tional energy context (supply of and demand for electricity and fuels), the structure and operations of the electric power industry (as they may af-fect a utility’s choice of investing in a conven-tional baseload or peakload powerplant or in cogeneration), and the regulation and financing of cogeneration technologies. Subsequent chap-ters will describe cogeneration technologies and their cost and output characteristics, promising cogeneration applications in the industrial and commercial sectors and in rural areas, and the potential environmental and economic impacts of cogeneration.
NATIONAL ENERGY CONTEXT
Cogeneration systems could affect both the supply of and demand for fuels and electricity. The greater operating efficiency that can result from cogeneration’s dual energy output could reduce the amount of fuel needed to supply elec-tric and thermal energy for the industrial and commercial sectors. In many cases, depending on the fuel used by the cogenerator and by the utility capacity it would displace, the fuel saved with cogeneration could be oil or natural gas. Moreover, the widespread use of cogeneration could reduce the demand for electricity from cen-tral generating plants. In order to analyze these potential effects, it is first necessary to understand the current supply and demand picture for fuels and electric power—the national energy context in which cogenerators would operate.
This section discusses cogeneration with refer-ence to the current and projected energy picture in the United States. First, the present energy situation and recent trends are reviewed briefly. Then, some projections of energy demand–par-ticularly of electric and thermal demand in the industrial and commercial sectors—are discussed. In doing so, this section also briefly outlines some of the factors that could alter the energy picture in these sectors which, in turn, would affect the market penetration of cogeneration.
Current Picture and Trends
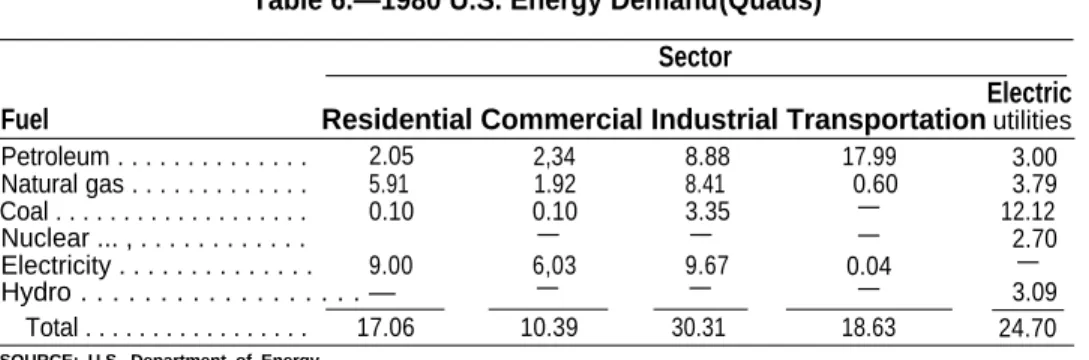
Table 6 presents 1980 U.S. energy demand by fuel and sector. Electricity is shown both as a de-mand and as a “fuel, ” with losses distributed to each final demand sector.
Total energy demand in 1980 was 76.3 quad-rillion Btu (Quads), a decline of 3.4 percent from the 1979 total of 79.0 Quads. The size of this de-cline—the largest annual drop in energy demand ever experienced by this country—was due in part to the very large increase in oil prices in 1979 and in part to investments in energy efficiency made as a result of the 1973-74 price rise. This can readily be seen by the 7.8-percent (2.9 Quads) decline in petroleum consumption from 1979 to 1980, and by the substantial decrease in the rate of growth in energy demand since the 1973 Arab oil embargo. Since 1973, overall U.S. energy demand has grown by approximately 0.8 percent annually, as compared with an average yearly growth of about 3.5 percent between 1950 and 1972. The most telling change in the overall U.S. energy growth picture, however, is that while energy growth has slowed dramatically, gross national product (GNP) has continued to grow at near historical rates. Table 7 shows the growth rates for both energy demand and GNP
50 . Industrial and Commercial Cogeneration
Table 6.—1980 U.S. Energy Demand (Quads) Sector
Electric
Fuel Residential Commercial Industrial Transportation utilities
Petroleum . . . 2.05 2,34 8.88 17.99 3.00 Natural gas . . . 5.91 1.92 8.41 0.60 3.79 Coal . . . 0.10 0.10 3.35 — 12.12 Nuclear ... , . . . — — — 2.70 Electricity . . . 9.00 6,03 9.67 0.04 Hydro . . . — — — — — 3.09 Total . . . 17.06 10.39 30.31 18.63 24.70
SOURCE: U.S. Department of Energy.
Table 7.—Ratio of Annual Energy Demand to GNP Growth Rates
GNP rate Energy demand rate Period (percent) (percent) Ratio 1950-60 . . . 3.29 2.76 0.84 1960-70 . . . 3.85 4.24 1.10 1970-80 . . . 3.26 1.31 0.40
SOURCE: Office of Technology Assessment.
over the last three decades, as well as the ratio of energy demand to GNP growth rates for each of those decades. This latter measure indicates that a healthy economic growth rate can be sus-tained with a wide variety of energy growth rates, and demonstrates the conservation potential of the U.S. energy economy.
In addition to the cost effectiveness of conser-vation, other important national energy trends that have emerged during the past 8 years include the steady decline of domestic oil and natural gas production, and the increasing financial problems of electric utilities. The latter are, in large part, due to the large drop in electricity demand growth and the rapidly escalating costs of cen-tral station electricity generation. The unexpected rapid decline in the growth of electric energy de-mand (from 7.9 percent per year for 1950-72 to 3.5 percent annually for 1972-80) found most utilities with far greater capacity under construc-tion than needed to meet the new growth. When it became evident that the lower growth rates were here to stay—in fact they might even get smaller—electric utilities deferred or canceled as much of their construction budget as they could. Many utilities were still left, however, with substantial excess capacity.
In addition, several factors combined to make new capacity much more expensive. These in-cluded longer construction times, increased en-vironmental and regulatory review, higher in-terest rates, and high inflation. One major con-sequence of these considerations is that, in most cases, the marginal cost of new central station electricity now exceeds the average cost. As a result, electric utilities face severe financial prob-lems, and those utilities that are experiencing de-mand growth or that need to displace oil-fired capacity may be unable to raise capital for any new plant construction (see “Electric Utilities Context,” below).
Future Prospects
All energy demand projections show a con-tinuation of the trend toward increased energy efficiency, although there is still considerable variation as to how much (see table 8). The range of the projections shown in table 8 is due prin-cipally to different assumptions about consumer responses to changes in energy prices. In all cases, however, these projections recognize that changes in demand will be the dominant factor in the energy future of the United States for the next few decades.
Table 8.—Comparison of Energy Demand projections (Quads)
Forecaster 1980 1990 2000
Energy Information Administration . . 76.3 87.0 102.5 Exxon . . . 76.3 81.0 91.0 Edison Electric Institute . . . 76.3 — 117.2 National Energy Policy Plan. . . 76.3 80-90 90-110 SOURCE: Office of Technology Assessment
Another trend mentioned above–the decline in domestic petroleum and natural gas produc-tion—also is very likely to continue. In a technical memorandum, World Petroleum Availability:
79802000, OTA estimated U.S. oil production
at 4 million to 7 million barrels per day (MMB/D) by 2000 compared to today’s 10.2 MMB/D (52). Exxon also has projected a drop to about 7.5 MMB/D in 2000 (26). The Energy Information Ad-ministration (EIA), on the other hand, projects a slight increase above today’s level to about 10.9 MMB/D (23). Despite the rapid increase in drill-ing activity since 1979, OTA has not yet seen any evidence to contradict findings of a net decline of between 3 to 6 MMB/D by the end of the century.
Natural gas production is even more uncertain due to the existence of large quantities of un-conventional gas (Devonian shale, tight sands, coal seam methane, and geopressurized brine). For most types of unconventional gas, the uncer-tainty is not so much the size of the resource base, but the production rates that can be ob-tained and the production cost. The available estimates currently center on total natural gas pro-duction of 15 trillion to 17 trillion cubic feet (TCF) per year in 2000 compared to 19.5 TCF for 1980. If the price of natural gas rises to that of world oil, however, these same estimates show produc-tion in 2000 to be approximately the same as it is today. In any case, there is little probability that the Nation will see a significant increase in domestic gas production, and such an increase is even less likely for oil.
Implications for Cogeneration
The Nation is confronted with a combination of circumstances that favor continued emphasis on different, less costly ways to generate electrici-ty, and on increased efficiency in electricity use. These circumstances have led to a resurgence in interest in the cogeneration of electricity and ther-mal energy. The relatively sther-mall size of cogenera-tion units compared to central power stacogenera-tions may offer significant short-term advantages for financing new capacity. Cogenerators will take much less time to build than central station plants and they represent smaller capacity increments
that would allow rapid adjustment to changes in demand. Moreover, because cogeneration units are installed at or close to the point of demand, most or all of the energy requirements of many industrial plants and commercial buildings could be provided onsite with the added possibility of generating electricity for distribution through the utility grid. Finally, cogenerators’ ability to use fuel for two purposes (electricity and thermal energy) greatly increases the overall utilization efficiency of that fuel. Thus, where electric utilities project continued reliance on oil and gas due to the unavailability or infeasibility of other fuels, or where cogeneration systems can use alternate fuels, substantial oil or gas savings may result.
The technical advantages of cogeneration have always been available. It is the advent of the economic and energy supply and demand con-ditions described above that adds potential fuel economy, financial, and planning advantages for cogeneration compared to central station elec-tricity generation and conventional thermal energy combustion systems. Whether these ad-vantages will prove sufficient to accelerate the growth of cogeneration will be determined large-ly by the amount and character of demand for electricity and thermal energy in the commercial and industrial sector, and by the future financial health of the electric utility sector.
Electricity Supply and Demand
Perhaps the most critical factor in cogeneration economics is the demand for electric power. The Public Utility Regulatory Policies Act of 1978 of-fers economic and regulatory incentives to co-generators that enable utilities to defer or cancel new powerplants and decrease oil and gas use. A zero or low growth in electricity demand, how-ever, could undermine these incentives by reduc-ing the need for cogenerated electricity and, therefore, reducing the economic attractiveness of cogeneration. Moreover, where the utility is primarily dependent on coal, nuclear, or hydro-electric plants, or where it plans to convert ex-isting oil-fired capacity to alternate fuels, cogeneration will only be attractive if it also can use alternate fuels and can offer substantial finan-cial advantages.
Currently there is considerable uncertainty about future electric power demand growth; the Solar Energy Research Institute (SERI) projected a 0.4 percent per year increase under their least cost approach (61 ), while the North American Electric Reliability Council (NERC) estimates a 2.9 percent annual growth rate (48). In terms of capacity requirements, the SERI projection could be met by 620 gigawatts (GW) of capacity oper-ating at the current capacity factor of 45 percent. Further, SERI shows that 577 GW could be avail-able in 1985 assuming completion of all plants scheduled to be on-line in 1985, and the retire-ment of all plants built before 1961 and of all oil and natural gas plants built between 1961-70 (61). Therefore, under the SERI least cost approach, very little new capacity would be needed past 1985, and any cogeneration added after that would be likely to substitute for electricity from existing coal, nuclear, or hydroelectric plants. Under the NERC case, however, capacity is pro-jected to reach about 900 GW by 2000, an in-crease of 300 GW over present capacity. Even then, NERC estimates that the capacity factor would have to increase to 50 percent to meet their projected energy demand. Accounting for retirements and conversion of oil and natural gas, about 50 percent more new capacity would have to be added under NERC projections than now exists (49). In this case, cogeneration could have a very large market potential.
The future demand for electricity will be deter-mined by the relative prices of electricity and competing fuels (including conservation meas-ures), by the development of technologies that use electricity more efficiently (e.g., process equipment, appliances), and by consumers’ per-ceptions about the stability of oil and natural gas resources. Currently, average electricity prices in the commercial sector are about 2.5 times dis-tillate fuel oil prices and five times natural gas prices on a delivered Btu basis. * For industry, both of these price ratios are about 2 to 1. The ratios have decreased by 20 to 60 percent from those in 1970, however.
*As will be discussed below, differences in end use efficiency between equipment using electricity and that using natural gas or fuel oil make price comparison on a delivered Btu basis alone, incomplete.
Continuation of the low rate of growth in elec-tricity demand, coupled with the current excess of generating capacity, may keep the rate of growth in electricity prices rather low over the next several years. If prices do remain somewhat stable, then the difference between electricity prices and oil and gas prices would be likely to become even smaller. However, the current de-cline in the real price of oil could alter this trend. Furthermore, if the oil price decline continues for the next few years, natural gas price increases following decontrol also are not likely to be so dramatic as originally thought. Therefore, the ratio of electricity prices to oil and natural gas prices would not decline for some time. At this point, it is most likely that the ratio will decline, although more slowly that previously antici-pated. The price trajectories used in the analysis of commercial cogeneration in chapter 5 also pro-ject that the ratio will become smaller.
Such growth rates would continue the trend toward price closure between electricity and natural gas or distillate fuel oil. If these trends are combined with the development of technologies for buildings and industry that use electricity more efficiently than equivalent oil or natural gas burn-ing technologies that provide the same services (e.g., space heating, reheating of finished metals), the costs of providing these services with elec-tricity could become lower than with oil or natural gas. For example, in many areas, efficient electric heat pumps can provide space heating more economically than oil furnaces. There are even a few regions where space heating with electric heat pumps is cheaper than with natural gas furnaces.
Natural gas and oil are the primary energy sources for industrial processes, supplying both direct heat (such as catalyzing chemical reactions and heat treating) and process steam. The major use of electricity in industry is to run motors. Whether technologies that use electricity could economically replace direct heat or process steam in industry is much less certain than in the commercial sector. Some possibilities include microwave, infrared, or dielectric heating, very efficient electric motors for replacing steam mechanical drives, and pulsed current devices for surface reheating of metals.
Ch. 3—Context for Cogeneration ● 53
It is possible, then, that the growth of electricity demand could increase sharply toward the end of the decade. * However, the extent of any in-crease in industrial or commercial demand will depend on the size of the dollar savings achieved by switching to electricity relative to the required capital investment. Conversion is much more likely for new buildings and plants than for ex-isting facilities. Therefore, unless there is signifi-cant new development in energy intensive indus-tries for which more economical electric tech-nologies are available and accepted, the growth rate of industrial use of electricity is not likely to change substantially for the remainder of the century.
It is this uncertainty of future demand that pro-vides a potentially important role for cogenera-tion. If electricity use in buildings and industry did increase substantially, electric utilities could be strained financially if they tried to meet the increased demand with new central station ca-pacity. Further, attempts to accommodate de-mand growth with central station capacity could lead to a rapid increase in electricity prices. This is because the marginal cost of electricity—the cost of a new plant—is often considerably higher than the average cost. Therefore, as new capacity becomes a larger fraction of the total electric utili-ty plant, the average cost will grow closer to the marginal cost. Cogeneration could help alleviate these pressures, particularly in the first years of an increase in demand. The small size of cogen-eration systems would allow rapid and fairly precise matching of supply and demand, and with much smaller increments of capital. This would greatly reduce the risk of building excess capacity or having to defer or cancel capacity under construction should demand growth sud-denly slow or stop. Moreover, because cogenera-tion supplies thermal energy, it could at least par-tially offset increases in electricity demand due to a rapid rise in the use of electric heating. Cogeneration’s competitiveness would then turn on the difference between the cost of purchas-ing electricity plus supplypurchas-ing heat, and the fuel
*The extent to which electricity can be substituted economical-ly for other energy sources in buildings and industry will be ex-amined in detail in forthcoming OTA studies on oil disruption and on electric utilities.
and operating and maintenance costs of a cogen-eration system. Finally, the avoidance of exten-sive new additions to transmission and distribu-tion systems also might alleviate some of the elec-tric utilities’ capital problems.
However, if utilities are able to raise capital easily, or if demand does not increase in the face of stable prices, central station powerplants fueled with coal, uranium, or hydropower may be pre-ferred to oil- or gas-fired cogeneration systems. These alternate energy sources probably would be cheaper than the oil or natural gas likely to be used in most cogeneration systems in the near term. Therefore central station electricity—even with a substantially larger capital cost per kilo-watt than cogeneration capacity—is likely to be cheaper than cogenerated electricity despite co-generation’s higher overall fuel efficiency. Thermal Energy Demand
The second major influence on the growth of cogeneration is future thermal energy demand in buildings (space and water heat) and industry
(direct heat and process steam ). We have already
discussed how some of this future load may be met by electricity rather than by direct combus-tion of fossil fuels. In addicombus-tion, available conser-vation opportunities will slow thermal demand
growth and could even reduce thermal energy
use (by 2000) from the 1980 levels. Conservation will affect electricity use as well, and even if significant conversion from other fuels to elec-tricity (as discussed above) does occur, electricity
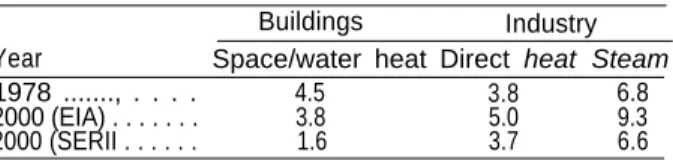
demand growth in these sectors still could be kept low. Table 9 shows two estimates of direct com-bustion heat requirements for commercial build-ings and industry for 2000 compared to 1978. As can be seen, current thermal demand in industry is more than twice that of commercial buildings. Moreover, under either the EIA or the SERI pro-jection, the difference would become even more pronounced.
Table 9.—Thermal Energy Demand (Quads)
Buildings Industry Year Space/water heat Direct heat Steam 1978 ..., . . . . 4.5 3.8 6.8 2000 (EIA) . . . 3.8 5.0 9.3 2000 (SERII . . . 1.6 3.7 6.6
54 ● Industrial and Commercial Cogeneration
The SERI estimates in table 9 are based on a least cost approach using conservation technol-ogies that cost the equivalent of up to the 1980 average cost of oil and electricity ($7.50/MMBtu and $.057/kWh respectively) (60). The EIA pro-jections are derived from economic and engi-neering models and reflect judgments about ac-tual consumer response to changing energy prices (22). In either case, cost-effective conser-vation opportunities for commercial buildings could reduce fuel requirements for space and water heating from 15 to 65 percent. For industry, EIA estimates a 37-percent increase in steam growth while SERI projects a 3-percent decrease (see the section on “Industrial Cogeneration Op-portunities” in chapter 5 for an analysis of steam growth projections).
These analyses indicate that cogeneration will have greater potential in the industrial sector than in commercial buildings as far as supplying ther-mal energy is concerned. Both EIA and SERI anal-yses imply that in the commercial buildings sec-tor, cogeneration will have to compete with cen-tral station electricity and with fuel freed by con-servation in meeting future space and water heat-ing demand. When the low load factor inherent in buildings’ heat load is added, the economic potential of cogeneration is decreased further (see ch. 5). In essence, conservation can considerably reduce the opportunity to take advantage of co-generation’s high fuel utilization efficiency.
The air-conditioning demand of buildings also offers a potential market for thermal energy from cogeneration. In 1980, over 98 percent of all commercial air-conditioning was electric. For these buildings, the use of cogenerated steam for cooling would require conversion to either ab-sorption units or steam-driven compressors.
Where it is economic to do so, such conversion would increase the baseload steam demand and therefore the building’s thermal load factor. By 2000, SERI and EIA project cooling demands of 2 and 4 Quads of primary energy, respectively.
Conclusion
The attractiveness of cogeneration will depend, to a large extent, on energy demand in the com-mercial and industrial sectors, on the balance be-tween thermal and electric loads, and on the overall demand for electricity. These, in turn, de-pend heavily on the price of energy–particularly the relative prices of electricity, distillate fuel oil, and natural gas. It is fairly certain that energy de-mand will grow much more slowly than in the past. The range of possible growth rates, how-ever, is large. Lower growth rates, while not necessarily changing the economics of cogenera-tion, will clearly reduce the potential market as well as the net fuel savings. Further, a very low growth rate for electricity is likely to dampen price increases and reduce the price paid by utilities for cogenerated power, both of which would reduce the economic attractiveness of co-generation. However, the uncertainty of future electricity demand and the economic problems caused by a severe mismatch between load growth and capacity growth make small capaci-ty additions potentially very desirable in the short term. Therefore, while conservation through in-creased efficiency is likely to be the most eco-nomic route to choose for at least the next several years, there appears to be a potential role for cogeneration, particularly in the industrial sec-tor where thermal and electrical demands are likely to remain large.
ELECTRIC UTILITIES CONTEXT
Future supply of and demand for energy and owned and operated by electric utilities, or they electricity, as discussed above, will be a major may be installed by former utility customers who factor in determining the role cogeneration will now provide some or all of their own electric
play in the Nation’s energy future. Equally im- power needs and who may even supply power
portant in defining that role will be the electric to the utility. In this context, cogeneration must
with well established electric and thermal energy conversion and distribution systems as well as with alternate energy forms and conservation. The elements of this competition—both on a site-specific and a national energy policy basis—will be wide ranging, encompassing the technologi-cal, fuel use, and institutional characteristics of the electric power industry, as well as the financ-ing, regulation, and operations of technologies that supply energy for commercial and industrial applications.
This section will review the general electric utili-ty context within which cogeneration systems will compete. The following section of this chapter will analyze the present institutional and regu-latory context specific to cogeneration.
The Electric Power Industry
Current operations of electric utility systems are diverse, encompassing a wide range of technical and institutional configurations. These include the number, size, and type of generating plants; the amount of electricity consumed by customer classes and their regional load profiles; and the different types of institutions that supply power, coordinate specific utility functions, and regulate the power industry. Support activities include the production and acquisition of fuel supply and of the necessary equipment for fuel handling and storage, and for electricity generation, transmis-sion, distribution, and consumption.
A wide array of institutions has evolved to per-form the functions listed above. The U.S. elec-tric power supply system is composed of over 3,400 separate entities, including private, public, and cooperative utilities, joint action agencies,
Federal power agencies, power pools, and elec-tric reliability councils. In 1980, these systems had 619,050 megawatts (MW) of installed generating capacity to supply close to 93 million customers with about 2.3 trillion kilowatthours (kWh) of electricity (see table 10) (55). The utilities in the electric power system obtain financing from a variety of sources including banks, insurance companies, traditional stock and bond markets, and Federal programs; their financial and tech-nical operations are regulated at the Federal, State, and local level. Finally, both the produc-tion and consumpproduc-tion of electricity are supported by innumerable institutions that manufacture, dis-tribute, install, and service equipment, tools, and appliances. All of these factors together make the electric utility industry the largest in the United States in terms of capital assets and issuance of stocks and bonds.
Utility Organizations
The organizations that supply electricity in the United States include private or investor-owned utility companies; publicly owned utilities such as State, county, or municipal systems, and Fed-eral power agencies; rural electric cooperatives; joint ownership organizations; and groups of util-ities that coordinate their operations to improve efficiency and reliability.
Private utiiities are owned by their investors and generally are granted territorial franchises by State or local governments. Most investor-owned utilities (IOUS) generate their own electricity, and some are part of vertically integrated corporations that own their fuel supply (e.g., “captive” coal
mines) or other support activities. Table 1O.–U.S. Electric Power System Statistics, 1980
Electric operating Net electric Installed capacity kWh generation Customers revenues plant investment
Type of system Millions Millions Millions
(and number) Megawatts Percent of kWh Percent Number Percent of dollars Percent of dollars Percent Local public systems (2,248) . . . . 67,568 10.9 204,880 9.0 12,467,700 13.5 $12,224 10.8 $34,100 11.9
Privately owned systems (217) . . . 476,979 77.1 1,782,545 78.0 70,620,300 76.2 87,062 76.9 207,555 72.4 Rural electric cooperatives
(924) . . . . 15,425 2.5 63,557 2.8 9,523,600 10.3 9,707 8.6 2 3 , 8 9 2 8.3
Federal power agencies (8). . . . 5 9 , 0 7 8 9.5 235,051 10.3 13,300 0.01 4,238 3.7 21,100 7.3
Total . . . 619,050 100.0 2 , 2 6 6 , 0 3 3 1 0 0 . 0 9 2 , 6 2 4 , 9 0 0 1 0 0 . 0 $113,231 100.0 $ 2 8 6 , 6 4 7 1 0 0 . 0
aDoes not Include nuclear fuel.
56 ● Industrial and Commercial
Cogeneration
IOU companies dominate power generation in the United States today. The 217 IOUS represent about 6 percent of the total number of utilities, but those 217 own approximately 77 percent of all installed generating capacity and generate about 78 percent of the electricity produced (see table 10). In 1977, approximately two-thirds of the IOUS had a peak demand in excess of 100 MW, and about 12 percent had a peak demand greater then 3,000 MW (21). Because of the cap-ital intensity of the electric utility industry, with total operating revenues of over $113 billion in 1980 and net electric plant investment of over $286 billion, the domination of the industry by a relatively few IOUS means that they also deter-mine the role of utilities in financial and other markets.
publicly owned utilities include municipal, public utility districts, and State and county sys-tems. The authority to establish a public utility derives from the State government, and a few States (e.g., New York, Nebraska) currently have their own systems. However, most States have delegated this authority to county or municipal governments.
The relatively large number of publicly owned utilities, in contrast to their small share of the elec-tricity market (see table 10), reflects their small size. Most of these systems only purchase whole-sale power and distribute it to their customers; those municipal that do generate have very small loads (fewer than 100 publicly owned utilities have peak demands in excess of 100 MW) (21). Roughly 71 percent of the local public power sys-tems purchase all their electricity, while about 6 percent own sufficient generating capacity to supply all their needs. The remaining 23 percent of public utilities generate some portion of their needs and purchase the remainder (55).
Cooperative utilities represent a different type of public ownership. The co-ops are nonprofit economic entities that are owned and managed by their customer members. Members’ shares in the co-op may be plowed back into the opera-tion and/or expansion of the business as patron-age capital in order to keep the cost of co-op serv-ice as low as possible, or the patronage capital may be “rotated” —essentially paid out as
divi-dends–if the co-op’s equity ratio is 40 percent or higher.
Rural electric co-ops comprise a vast operating network of over 900 local and regional electric systems in 46 States which own and maintain nearly 44 percent of the Nation’s electric distribu-tion lines, and whose service territories encom-pass 75 percent of the land area of the United States. The rural electric system is a two-tiered operation, including 870 local distribution co-ops and 54 generation and transmission co-ops (G&Ts). The 870 local co-ops purchase electrici-ty and distribute it to their own rural customers, while G&Ts generate and/or transmit electricity primarily for local distribution co-ops. Some G&Ts also sell electricity wholesale to municipal and IOUS, while distribution co-ops may purchase power from a combination of sources, including G&Ts, Federal power agencies, and IOUS (16). Still another form of public utility ownership is represented by Federal power marketing agen-cies. The Federal role in electricity generation dates back to the Reclamation Act of 1906, which empowered the Bureau of Reclamation to pro-duce electricity in conjunction with Federal ir-rigation projects, and to dispose of any surplus power to municipal utilities (39). The second Federal power marketing agency was the Ten-nessee Valley Authority (TVA), which was estab-lished in 1933 as a multipurpose river project with responsibility for flood control, regional develop-ment, hydroelectric power generation, and other activities. Today, it is the single largest electric utility in the country, with a total system capaci-ty of over 31,000 MW. Approximately 65 percent of TVA’s sales are at wholesale to municipal utili-ties and rural electric co-ops. The remainder is sold to private industries, other Federal agencies, and private power companies (55).
Other Federal power agencies include the Bonneville Power Administration, which was established in 1937 and which markets power from hydroelectric projects constructed by the Army Corps of Engineers and the Bureau of Recla-mation in the Columbia River Basin and operates the Nation’s largest network of long-distance high-voltage transmission lines; the Southwestern Power Administration, which was set up in 1944
Ch. 3—Context for Cogeneration ● 57
to market power from Corps of Engineers proj-ects in Arkansas, Missouri, Oklahoma, and Texas; the Southeastern Power Administration, created in 1950 to market power from Corps projects in 10 Southeastern States; the Alaska Power Ad-ministration, established in 1967 to operate and market power from Federal hydroelectric projects in Alaska; and the Western Area Power Admin-istration, which was set up in 1977 and incor-porates Federal power marketing and transmis-sion functions formerly performed by the Bureau of Reclamation and markets power from a num-ber of Corps hydroelectric projects (55).
A hybrid form of public ownership is the joint action agency, in which two or more public power systems pool their plans to purchase power or to finance total or partial ownership of generation and/or transmission systems. Where the local public utility system is no longer ade-quate or economical and low-cost Federal power is not available, joint action agencies can place public power systems in a more advantageous cost and supply position, allowing even the small-est electric utilities to realize economies of scale (4). Joint action may also provide publicly owned utilities with more flexibility in choosing fuels and types of generating capacity while avoiding the risks of a single-shot investment in one plant. IOUS may choose to participate in joint action agencies to reduce plant construction costs or to obtain lower cost financing (32).
Joint action agencies are authorized by State legislation and membership arrangements vary. They may include statewide areas (e.g., Munici-pal Electric Authority of Georgia), correspond to IOU service areas (such as in North Carolina, which has three agencies, one for each of the State’s major IOUS), or be determined according to both geography and perceived mutual interests (e.g., the five Minnesota organizations). Some joint action agencies, such as the Missouri Basin Municipal Power Agency, have members from several States. As such, they cannot finance proj-ects themselves but must rely on the members’ funding abilities. In 1981, there were 49 public-ly owned joint action agencies in 31 States (55). Since the 1920’s, all the types of utility systems described above have been interconnected and
their operations coordinated to some degree in order to reduce costs by increasing the produc-tivity of the resources employed in the genera-tion and transmission of electricity, and to im-prove reliability by applying the combined re-sources of several systems to a contingency on any one. These intersystem agreements now comprise approximately 20 formal organizations known as power pools. The degree of coordina-tion among utilities in power pools can range from very loose agreements for exchanges of energy; to some coordination of planning, con-struction, operation, and capacity reserves; to complete integration with joint planning on a
single system basis, centralized dispatch of
generating facilities, and strict contractual re-quirements for generating capacity and operating
reserves (29).
In general, the potential economic benefits of pooling include reduced investment costs through economies of scale in building larger generating units and through lower reserve mar-gins that result from reducing the ratio of gener-ating unit size to combined system peakload; greater operating economies through increased load diversity, reduced operating costs per unit output for larger plants, and fuller use of the lowest cost capacity available on the system; and increased savings through coordinated construc-tion programs that minimize the costs of tem-porary excess capacity that may result from the addition of large generating plants. The poten-tial reliability benefits of power pools derive from access to support from other systems, and may be realized either through a reduction in reserves needed to achieve a certain level of reliability or through an increase in the level of reliability of the coordinated systems (29).
Electric reliability councils represent a second form of coordination among utilities. A Federal Power Commission (FPC) investigation of the 1965 blackout in the Northeast stressed the need for greater reliability and coordination among electric utility companies. In response to FPC
find-ings, NERC and nine regional councils were
formed in the late 1960’s (see fig. 8), represent-ing about 95 percent of the Nation’s generatrepresent-ing capacity. Each regional council consists of a
58 . Industrial and Commercial Cogeneration Mid-America Interpool Network Mid-Continent Area Rellablllty Coordination Agreement Northeast Power Coordlnatlng Council Southeastern Electric Reliability Council
Southwest Power Pool
Western Systems Coordinating Council
resentative from each of the major utilities in the region and from groups of small utilities in some regions.
The regional councils develop voluntary stand-ards for those aspects of bulk power supply that affect the regionwide reliability of service (e.g., design criteria for transmission facilities). NERC aids in the coordination of policy issues among the regional councils, and provides industry in-formation, comment, and recommendations about the reliability and adequacy of bulk power supply at the national level. In addition, NERC is responsible for the development and
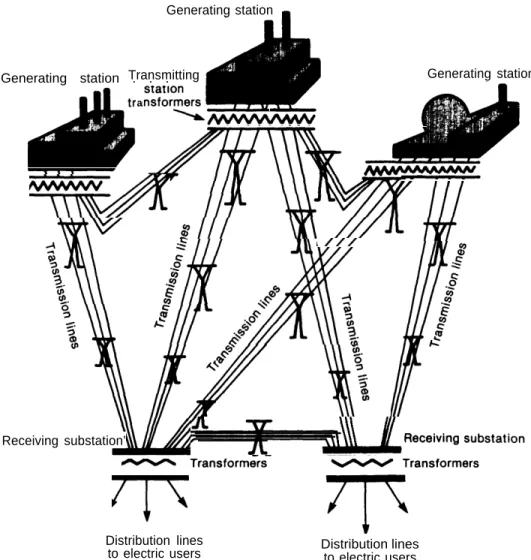
mainte-Figure 9.—The Generai Patterns
Generating station
Transmitting Generating station . . .
nance of nationwide standards for interconnected operation (18).
Technical Aspects of
the Utility industry A conventional power system can be described as the coordinated operation of generating units, high-voltage transmission lines, and subtransmis-sion and distribution networks. Figure 9 shows a typical power system structure.The primary consideration in an electric power system is to serve the electric loads, or power re-quirements, in a given area or region. The power
of an Eiectric Power System
a
Receiving substation’
Generating station
Distribution lines
to electric users Distribution linesto electric users
SOURCE: Economic Regulatory Administration, The National Power Gr/d Study, Volume //(Washington, D. C.: U.S. Department of Energy, DOE/ERA41056-2, September 1979).
60 ● Industrial and Commercial Cogeneration
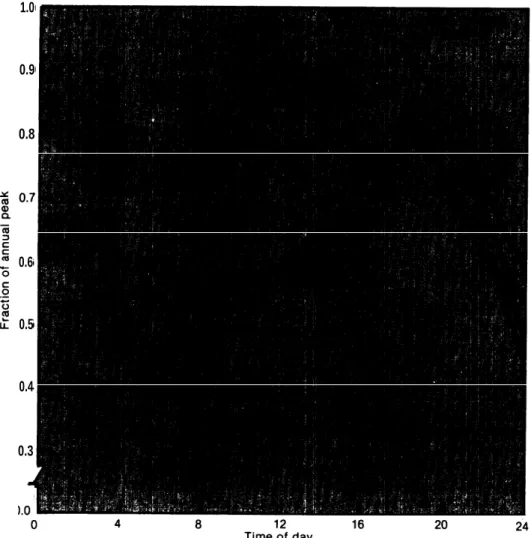
requirements include all devices or equipment that convert electricity into light, heat, or mechanical energy, or otherwise consume elec-tricity (e.g., aluminum reduction), or the re-quirements of electronic and control devices. The total load on any power system is seldom con-stant; rather it varies with hourly, daily, seasonal, and annual changes in the service area’s re-quirements (see fig. 10). The minimum system load for a given period is termed the baseload, while maximum requirements (usually resulting from temporary conditions) are called peakloads. Because electric energy currently cannot be
stored in large quantities, generating plant opera-tions must be coordinated closely with fluctua-tions in the load, and large utility systems usual-ly have separate generating plants sized to meet base, intermediate, and peakloads.
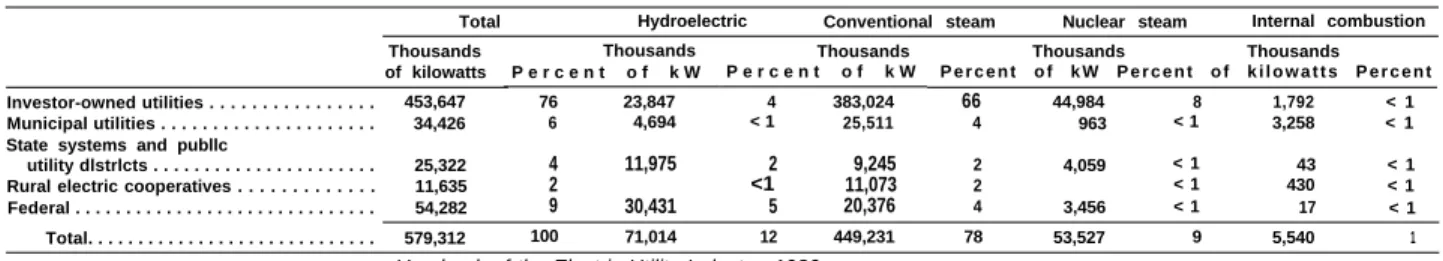
Table 11 shows the current U.S. generating capacity by type of prime mover. The choice of capacity type is a function of service needs, eco-nomic and financial considerations, resource constraints (e.g., fuel, land, water), potential en-vironmental impacts, future growth, politics, reg-ulatory requirements, and management
prefer-Figure 10.—Daily Load Shapes for Five Representative Weekdays (North Central Region, 1980)
1.0 0.9 0.8 0.6 0.5 0.4 0.3
SOURCE: Decision Focus, Inc., Evacuation of the Economic Benefits of Oecentra/lzed Electr(c Generathrg Equipment Con-nected to a Ut///ty Gr/d (contractor report to OTA, October 19S0).
Ch. 3—Context for Cogeneration . 61
Table 11.–lnstalled Generating Capacity, by Type of Prime Mover, 1978
Total Hydroelectric Conventional steam Nuclear steam Internal combustion Thousands
of kilowatts Investor-owned utilities . . . . 453,647 Municipal utilities . . . . 34,426 State systems and publlc
utility dlstrlcts . . . . 25,322 Rural electric cooperatives . . . . 11,635 Federal . . . . 54,282 Thousands P e r c e n t o f k W 76 23,847 6 4,694 4 11,975 2 9 30,431 Thousands P e r c e n t o f k W 4 383,024 < 1 25,511 2 9,245 <1 11,073 5 20,376 Thousands Thousands P e r c e n t o f k W P e r c e n t o f k i l o w a t t s P e r c e n t 66 44,984 8 1,792 < 1 4 963 < 1 3,258 < 1 2 4,059 < 1 43 < 1 2 < 1 430 < 1 4 3,456 < 1 17 < 1 Total. . . . 579,312 100 71,014 12 449,231 78 53,527 9 5,540 1 SOURCE: Edison Electric Institute, Statistical Yearbook of the Electric Utility Industry, 1980 (Washington, D. C.: Edison Electric Institute, November 1981).
ences. In general, fossil and nuclear fueled steam plants and many hydroelectric facilities are used for baseload and intermediate-load generation while some hydro equipment (usually pumped storage) and combustion turbines are used to supply peaking power.
The trend in recent years has been to construct large baseload plants in order to capture econo-mies of scale. Nuclear plants usually exceed 1,000 MW in nameplate capacity and most of the existing fossil steam plants are larger than 5oo MW. However, as capital costs and construction times increase and it becomes more difficult to finance large powerplants, some utilities are turn-ing to smaller equipment that may use uncon-ventional fuels. Where the service needs are not expected to grow rapidly, small units such as cogenerators may improve load factors while alleviating utility financial problems in the short term, although their longer term financial and system planning advantages are uncertain (see ch. 6).
In order to serve the electric loads of an area adequately, a utility must plan not only for baseloads and peakloads, but also for system reliability during scheduled and unscheduled outages (e.g., equipment maintenance, storm damage) and for demand growth. To some de-gree, system reliability can be achieved through interconnections with other utilities (i.e., power pooling), but utilities also must incorporate re-serve margins into their planning. Rere-serve mar-gins are the installed available capacity in excess of that needed to meet the system’s peak demand when due consideration is given to maintenance requirements, random equipment failure, or other contingencies. The amount of reserve capacity required in a given situation depends on
the reliability criterion, the behavior of individual generators, the unit size mix, and the intercon-nection support available. The usual planning procedure is to specify a reliability level or loss of load probability, such as an expected deficien-cy of 1 day in 10 years, and optimize capacity expansion so that this criterion is always met (3 S). The accepted industry minimum value is about 20 percent. In 1979, the average reserve margin for IOUS was around 36 percent of peakload (20). Some utilities have reserve margins above so per-cent, while others are below 10 percent.
Once electricity has been generated, its voltage is stepped up with power transformers and it is transmitted to the load center. High-voltage trans-mission lines (69 kilovolts (kV) and above) are used to transfer bulk power from the generating plant to a substation or bulk purchaser, and to interconnect utility systems for greater efficien-cy and reliability. Such lines are built to accom-modate power flows in either direction in order to facilitate interconnection among systems.
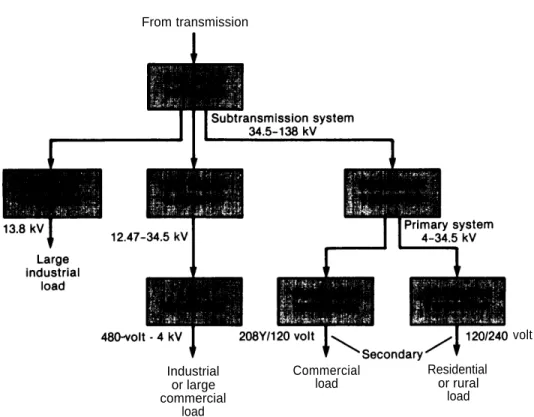
After the bulk power has been transmitted to the demand center, it goes into the distribution system, which supplies electric energy to the in-dividual user or consumer. The distribution sys-tem includes the primary circuits and the tion substations that supply them; the distribu-tion transformers; the secondary circuits, in-cluding the services to the consumer; and ap-propriate protective and control devices (see fig. 11). A transmission substation transforms power to subtransmission voltage (below 69 kV). It is then distributed to various distribution substa-tions, load substasubsta-tions, and distribution transform-ers, where the voltage is stepped down further to match residential, commercial, and industrial needs. Once the electricity enters a local
distribu-Figure 11.—Typicai Eiectric Distribution System (three.phase)
From transmission
volt Industrial Commercial Residential
or large load or rural
commercial load
load
SOURCE: McGraw-Hill Encyclopedla of Energy (New York: McGraw-Hill Book Co., 1976).
tion system, the power usually only flows one way in order to protect electrical workers and equipment. Special equipment is thus needed for onsite generators that feed power back to the grid (see discussion of interconnection in ch. 4). Economic and Regulatory Aspects of Utility Systems
Electric utilities are among the most capital-intensive and highly regulated industries in the United States, and the two aspects of the industry are integrally related. The rates charged for service-as determined by State or Federal reg-ulation—are the primary factor in utility eco-nomics. But the economics of electric power supply and demand also may be affected by fi-nancing and its regulation as well as by regula-tion of utility services and operaregula-tions. These aspects of utility regulation and their effects on the production and consumption of electricity— and thus on the potential role of cogeneration— are discussed below.
UTILITY RATES
In exchange for the privilege of operating as a natural monopoly, utility practices are regulated in the public interest. The primary form of such regulation is the determination of the rates utilities can charge for their services. State public service commissions (PSCS) traditionally have controlled rates for intrastate sales of electricity, while the Federal Government has had jurisdiction over sales for resale in interstate commerce since 1935.
State Regulation .–Each of the States (except Nebraska, where all electricity is supplied through a State-owned and operated utility system) has a PSC established by law to regulate utilities. The degree of State regulation varies. Ail PSCS regulate the rates of IOUS, while 19 commissions have some authority over publicly owned utility rates, and 29 regulate cooperatives (30). Where the PSC does not have such authority, public utilities are self-regulating through the municipal or county government.
Ch. 3—Context for Cogeneration ● 63
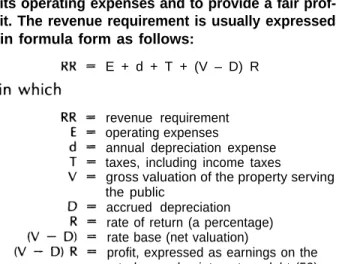
Determining the rates a utility charges for its services is a two-step process. The PSC must decide first, how much money the utility needs (the revenue requirement) and second, how those funds will be collected (the rate structure or rate schedule). A utility’s revenue requirement is the total number of dollars required to cover its operating expenses and to provide a fair prof-it. The revenue requirement is usually expressed in formula form as follows:
E + d + T + (V – D) R
revenue requirement operating expenses
annual depreciation expense taxes, including income taxes
gross valuation of the property serving the public
accrued depreciation rate of return (a percentage) rate base (net valuation)
profit, expressed as earnings on the rate base, plus interest on debt (53). The rate schedule allocates the revenue re-quirement among a utility’s customers. The prob-lem of cost allocation arises because most elec-tricity is produced in jointly utilized equipment and its cost must be assigned to the customer classes involved (36). First, costs directly at-tributable to a particular class or customer (e.g., the distribution line from a substation to a
fac-Figure 12.–Allocation
Total utility Costs are $ costs attributed for a given to major
year functions
tory) are identified and segregated. Second, the remaining costs are arranged so that they can be apportioned among the various groups of cus-tomers jointly responsible. Third, those costs are distributed in accordance with some physically measurable attribute of the customer class.
in accomplishing the last two steps, costs are arranged according to function (such as produc-tion, transmission, and distribution), and then either assigned to demand, energy, or customer cost categories, or simply classified as fixed or variable (see fig. 12). Demand costs (the fixed rate base and expense items related to peak or aver-age demand) are generally the most difficult to allocate and have become controversial in the setting of rates for backup service to cogenerators (see discussion of rates in next section). Energy costs can be directly allocated to customer classes based on the number of kilowatt-hours con-sumed by the group, and thus do not pose a problem (36).
Federal Regulation.–Federal regulation of electricity prices began in 1920 with the authority to set rates for interstate sales of power from federally licensed hydroelectric projects. The financial abuses of the 1920’s and early 1930’s, however, revealed a need for a more extensive national role, and the Federal Power Act of 1935 expanded Federal jurisdiction to include all sales of electric energy at wholesale in interstate com-of Electricity Costs
Costs are Costs are
divided into allocated to three principal three classes of
categories customers
merce. The States retained exclusive jurisdiction over intrastate and retail electricity sales until passage of the Public Utility Regulatory Policies Act of 1978 (PURPA), which required the Federal Energy Regulatory Commission (FERC) to estab-lish standards for PSCS to consider in setting retail and certain wholesale rates (56).
The Federal Power Act of 1935 requires that all rates and charges of any electric utility for the transmission or sale of power subject to FERC (formerly FPC) jurisdiction be just and reasonable as well as nondiscriminatory. Each utility must regularly file with FERC schedules that show such rates and charges, and the classifications, prac-tices, and regulations that may affect them. FERC rate proceedings are similar to those of State com-missions: FERC first determines the utility’s rev-enue requirement and then approves a rate schedule designed to meet that requirement. In such proceedings, FERC traditionally has em-ployed the same cost-based formulae used by PSCs (3).
Although only about 10 percent of the reve-nues realized by IOUS are from wholesale trans-actions subject to Federal jurisdiction, FERC still has a broad opportunity to influence State rate-making. For example, States may be reluctant to introduce innovative rate structures for fear of placing utilities within their jurisdiction at a com-petitive disadvantage. Innovation at the Federal level can provide the experience necessary for
State adoption of innovative rate designs. More-over, FERC’S ability to examine cost trends and pricing practices on a regional or nationwide (as opposed to local) scale may reveal to States op-portunities for ensuring greater economy in elec-tric power supply.
FINANCING
The second major factor in utility economics is financing of new generating capacity. Utility financing options vary widely depending on the form of ownership, current economic conditions, the type of project being financed, and similar considerations. A summary of differences in financing by form of ownership is shown in table 12. The general considerations related to utility financing of capacity additions are reviewed here; financing considerations specific to cogeneration will be discussed in the following section.
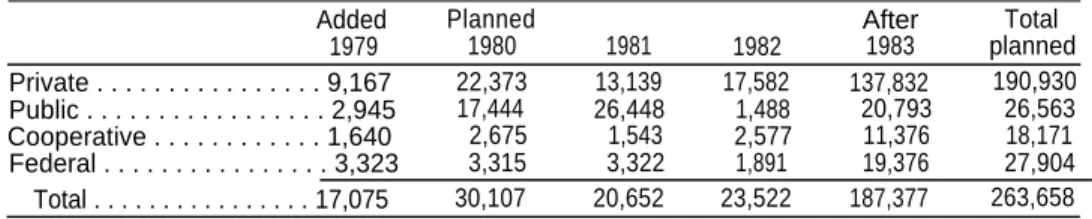
Investor-Owned Utilities.– IOUS spend the largest proportion of funds in the electric power industry (see table 10) and, based on announced plans for capacity additions (table 13), their share of funds is likely to remain large. IOUS have four basic options for securing those funds: long-term debt, preferred stock, common stock, and re-tained earnings (see table 14).
The primary form of long-term debt financing for IOUS is the mortgage bond, which is secured by a conditional lien on part or all of the com-Table 12.—Differences in Financing by Form of Ownershipa
Average return to
Ownership Capitalization Percent financing sources Tax treatment Financiability
Federal Debt Retained earnings Federal Municipal Debt Retained earnings Municipality Cooperative: Distribution Dept Equity G & T sb Debt Equity Investor owned Debt
Preferred C o m m o n Retained earnings 27.8 9.1 63.1 73 25.5 1.5 66 (1977) 34 (1977) 96 (1977) 2 (1977) 50.3 12.5 24.9 12.3 7.25% (1977) 4.9 7.4 (1977) 10.7 (1977) 7.4 (1977) 10.7 (1977) 11.85 9.76 11.3
Tax exempt Federal
Taxed revenues
Interest on debt Electric exempt from taxes revenues or
municipality
Taxed Federal loans
or guarantees, or members’ shares
Taxed investors
a1979 data unless Indicated otherwlse. bGeneration and transmission.
Ch 3—Context for Cogeneration ● 65
Table 13.–New Capacity Additions (in megawatts, net operating capacity)
Added Planned After Total
1979 1980 1981 1982 1983 planned Private . . . 9,167 22,373 13,139 17,582 137,832 190,930 Public . . . 2,945 17,444 26,448 1,488 20,793 26,563 Cooperative . . . 1,640 2,675 1,543 2,577 11,376 18,171 Federal . . . 3,323 3,315 3,322 1,891 19,376 27,904 Total . . . 17,075 30,107 20,652 23,522 187,377 263,658
SOURCE: Office of Technology Assessment from U.S. Department of Energy data.
Table 14.—Capital Structure for Private Utiiities (average percent of capitalization)
1966 1970 1974 1977 1978 1979 1960
Long-term debt . . . 52.3 54.8 53.0 51.0 50.5 50.4 50.4 Preferred stock . . . 9.5 9.8 12.2 12.5 12.4 12.5 12.3 Common stock. . . 26.1 23.2 23.5 24.2 24,8 25.0 25.4 Retained earnings . . . 12.1 12.2 11.3 12.3 12.3 12.1 11.9
SOURCE: Edison Eiectric institute, Stat/st/ca/ Yearbook of the Electric Ut///tY hxfustrx. . W&l(Waahin@on, D. C.: Edieon Eiec-tric Institute, November”1981).
pany’s property. In 1980, approximately 50 per-cent of total average IOU capitalization was long term debt. In the same year, IOUS issued around $8.3 billion in long term debt (or 58 percent of their 1980 long term financing), $7.85 billion of which was new capital and the remainder refund-ing. For the last quarter of 1980, the average yield on all IOU bonds was 14.11 percent, with a range of 13.18 percent for Aaa bonds to 15.20 percent for Baa bonds. For newly issued bonds, the aver-age yield in 1980 was 13.46 percent (20).
Common stock equity represented about 25 percent of electric utilities’ total outstanding capitalization in 1980. iOUs issued approximately $4.1 billion of common stock in 1980, or around 28 percent of the long term financing obtained by IOUS during that year. The average yield on common stocks during 1980 was 12.01 percent. The actual return on average common equity was 11.4 percent, while the authorized rate of return averaged around 14.2 percent (20).
Preferred stock was about 12 percent of total outstanding electric utility capitalization in 1980. In the same year, approximately $2.0 billion of preferred stock was issued by IOUS (or about 14 percent of total 1980 long-term financing), with an average yield of 12.28 percent (20).
Finally, IOUS may use internally generated capital or retained earnings to finance capacity
additions. The amount of retained earnings avail-able for financing usually is reflected by the ratio of dividends to net income, or the payout ratio. IOUS have had to pay a major portion of their net profits in dividends in recent years (75.8 per-cent in 1980), reducing their ability to finance projects internally. In 1980, retained earnings were the smallest source of capital available to utilities (about 12 percent of total capitalization) (20).
Publicly Owned Utilities.–Publicly owned utilities’ advantages over IOUS in financing new capacity include their smaller size and thus lower capital needs, their self-regulating (in most cases) and tax-exempt status, and their absence of con-cern about protecting shareholders’ equity. Yet this does not mean that they are totally without financing problems.
As with lOUs, the predominant form of munici-pal utility financing is long-term debt (73 percent of total 1979 capitalization) —mostly electric rev-enue bonds or general obligation bonds. Munici-pal bonds are attractive to investors because of their tax-free interest, but their average yield is lower as a result (4.9 percent in 1979). Equity financing for municipal utilities is a combination of direct investment by the municipal government and the retained surplus from operating revenues. The retained surplus is extremely important for
66 . Industrial and Commercial Cogeneration
municipal’ ability to build a base for expansion; it averages about 10 times the amount of direct investment by the municipal government (18). In 1979, retained earnings represented an average of 25.5 percent of municipal’ total capitalization (25).
The primary sources of long-term financing for cooperatives are insured loans and loan guarantees from the Rural Electrification Ad-ministration (REA). REA makes insured loans to the local distribution co-ops at interest rates of 2 to 5 percent, based on a revolving fund that has a borrowing “floor” and “ceiling” specified annually by Congress. Loans from the revolving fund are repaid from borrowers’ operating reve-nues and from collections on outstanding REA loans (16). Since 1973, REA also has been author-ized to make 100-percent loan guarantees to power supply borrowers–mostly G&Ts–for the construction and operation of powerplants and related transmission facilities. These guarantees are made almost entirely by the Federal Financ-ing Bank, which borrows money from the U.S. Treasury. In fiscal year 1981, 34 REA loan guarantee commitments were made to power supply borrowers; they accounted for about 85 percent of REA’s total fiscal year 1981 electric financing programs. Interest rates on REA loan guarantees averaged about 15 percent (45).
REA insured loans are supplemented by money raised by the National Rural Utilities Cooperative Finance Corp. (CFC) in the public bond market. Co-ops that receive REA insured loans are re-quired to obtain from 10 to 30 percent sup-plemental financing from non-REA sources such as CFC (which is a giant nonprofit co-op owned by about 85 percent of the rural electric co-ops). CFC bonds accounted for approximately 4 per-cent of all rural electric co-op financing in fiscal year 1981 (see table 15).
Regulatory Considerations.–Almost all aspects of utility finance are regulated at either the State or Federal level or both. As in rate regulation, the States have primary jurisdiction over intrastate utility financial transactions while the Federal Government regulates interstate financing ar-rangements as well as those with antitrust impli-cations.
In general, State regulation focuses on prior approval of IOU’S issuance of mortgage and de-benture bonds and other long-term debts (e.g., notes over 1 year), and of common and preferred stock. Some PSCS also regulate declarations of dividends and budgets for capital expenditures. For public utilities, the authority to issue bonds derives from the State constitution or statutory authority. In many cases, a municipality must also obtain voter approval before issuing new bonds.
Table 15.—Sources of Long-Term Financing to REA Electric Borrowers (percent by
fiscal year) REA
guarantee Other
Year REA 20/0 REA 5°A commitments CFC financing Total
1969 . . . . 100.0% — — — — 100.0 ’%0 1970 . . . . 100.0 — — — 100.0 1971 . . . 96.6 — — 3.4% — 100.0 1972 . . . 72.2 — — 15.3 12.5% 100.0 1973 . . . 32.4 52.80/o — 13.6 100.0 1974. . . 3.1 26.0 45.80/o 4.9 20.2% 100.0 1975. . . 5.1 28.7 58.2 7.7 0.3 100.0 1976 . . . 10.3 24.5 57.6 5.1 2.5 100.0 TQ . . . 7.6 22.5 64.8 3.3 1.8 100.0 1977. . . 5.3 11.4 77.9 2.9 2.5 100,0 1978. . . 5.1 20.8 66.2 6.0 100.0 1979. . . 3.3 11.5 80.5 3.7 0.9 100.0 1980. . . 2.0 11.3 81.4 4,3 0.9 100.0 1981 . . . 2.8 10.6 78.7 4.0 3.9 100.0
SOURCE: U.S. Congress, Senate hearfngs before the Commlttee on Appropiations, “Agriculture, Rural Development, and Related Agencies Appropriations,” fiscal year IWO, 9t3th Cong., 1s1 aaas., part l—juntlflcations; National Rural Electrlc Comparative Association, peraonat communication to the OffIce of Technology Asaaaament.