sustainability
Article
Detail Engineering Completion Rating Index System
(DECRIS) for Optimal Initiation of Construction
Works to Improve Contractors’ Schedule-Cost
Performance for Offshore Oil and Gas EPC Projects
Myung-Hun Kim1,2, Eul-Bum Lee2,* and Han-Suk Choi21 POSTECH University & Hyundai Heavy Industries, Engineering Management Team, 400 Bangeojinsunhwan-doro, Dong-gu, Ulsan 44114, Korea; [email protected]
2 Graduate Institute of Ferrous Technology & Graduate School of Engineering Mastership, Pohang University of Science and Technology (POSTECH), 77 Cheongam-Ro, Nam-Ku, Pohang 37673, Korea;
* Correspondence: [email protected]; Tel.: +82-54-279-0136 Received: 9 April 2018; Accepted: 12 July 2018; Published: 14 July 2018
Abstract:Engineering, Procurement, and Construction (EPC) contractors with lump-sum turnkey contracts have recently been suffering massive profit losses due to re-works and schedule delays in offshore oil and gas EPC megaprojects. The main objective of this research is to develop and implement a detail engineering completion rating index system (DECRIS) to assist EPC contractors to optimize fabrication and construction works schedules while minimizing potential re-work/re-order. This is achieved through adequate detail design development and results in minimizing schedule delays and potential liquidated damages (i.e., delay penalties). The developed DECRIS was based on findings from an extensive review of existing literature, industry-led studies, expert surveys, and expert workshops. The DECRIS model is an evolution, and improvement of existing tools such as the project definition raking index (PDRI) and front-end loading (FEL) developed specifically for the early stage of engineering maturity assessment (i.e., planning, basic design, and front-end engineering design (FEED)), prior to EPC projects. The DECRIS was evaluated and validated with thirteen sample as-built offshore megaprojects completed recently. When the DECRIS was applied to the completed projects post-hoc, a correlation (R-squared 0.71) was found between DECRIS scores and schedule/cost performances. This is much superior to the PDRI-Industrial model’s correlation (R-squared 0.04), which was primarily devised for owners’ basic engineering or FEED completion assessment. Finally, as a means of further validation, project schedule and cost performance of an ongoing project was predicted based on the correlations found on the thirteen completed projects. The resultant predicted schedule and cost performance was well matched with the current project performance status. Based on the accuracy of the DECRIS model found in the validation, said model is an effective prospective tool for EPC contractors to manage their engineering and procurement/construction risks during the initial detail design stages.
Keywords: oil and gas megaproject; engineering; procurement and construction (EPC) project; DECRIS; schedule and cost integration; risks control; profitability; sustainability
1. Introduction
Crude oil was historically supplied solely by onshore reservoirs until the 1970s, when these reservoirs were found to be insufficient to meet the growing global oil and gas demand. To supplement demand, deep-water offshore projects were initiated in the 1990s and they now account for about 10%
Sustainability2018,10, 2469 2 of 31
of the total global oil supply [1]. In 2011, shale oil and gas were introduced to the oil and gas market with the development of cost-effective hydrofracturing technologies. This has led to an over-supply of oil and gas and, consequently, an era of low oil prices decreasing major oil companies’ profits [2].
An offshore project requires a significant amount of early investment for drilling and production facility design and construction. To combat lower revenues and increase profits, major oil companies have placed a great deal of attention on cost-saving strategies in these early stages for offshore oil and gas projects [3]. However, these strategies are often poorly planned and implemented, leading to inadequate resource allocation, and improperly accelerated design and construction. This all results in poor quality of work, schedule overrun, and even safety-related accidents on site [2].
Therefore, how can planning be improved? Merrow collected and analyzed project performance data on 100 megaprojects, finding that the success of upstream activities (i.e., planning and early design) is one of the important factors for project success. Without this planning, Merrow found over 65% of the projects studied (>65%) reported project failure in cost, schedule, and/or production [4]. Decisions made during the detail design stage have significant impact on the overall construction cost and schedule. Errors and omissions at this stage cause construction delays and often result in reconstruction, especially in lump-sum turnkey contracts, which are overwhelmingly adopted for Engineering, Procurement, and Construction (EPC) megaprojects. The resultant construction delay and reconstruction results in owners’ claims, namely liquidated damages and performance liquidated damages, which are major reasons for the EPC Contractor’s profit losses. In particular, incomplete and/or inaccurate designs for fabrication (i.e., steel cutting), one of the most critical contract milestones when initiating construction work stipulated on the contract, results in significant reconstruction and associated labor hours. Oil and gas EPC contractors need a customized engineering completion model to measure the completion rating in their engineering management decision-making process at the design stage to mitigate reconstruction and avoid costly consequences. As such, this paper focuses on aiding contractors in the initial design stages.
To compound the negative impacts of poor upfront project planning, many megaprojects are performed to a very tight schedule. A tight schedule usually forces the EPC contractor to concurrently design and construct the project, hoping to meet the owner’s deadline and avoid costly liquidated damages. However, this concurrent design and construction, unless well planned, may lead to a costlier option due to a catastrophic ripple effect when the final design is significantly different from the partially complete design when construction started.
Concerning the contractor-owner relationship on conventional oil and gas projects, the owner hires a contractor for construction only with fully approved for construction (AFC) engineering drawings after AFC completion. Alternatively, in EPC projects, the owner hires a contractor for engineering (final design), procurement of equipment, and construction. This type of contract means that the selected contractor is responsible for completing the remaining design and procurement activities based on the front-end engineering design (FEED) package developed by the project owner. Therefore, the contractor must consider all risks of detail design and procurement, including undetected discrepancies during the FEED verification period that may cause serious cost overrun and/or schedule delay.
Since the early 2000s, South Korean companies have been working as major EPC contractors for offshore oil and gas EPC projects, specifically upstream production facility projects. Three major shipbuilders in South Korea have executed over 50% of worldwide offshore oil and gas EPC mega projects: H company, S company and D company. Since 2008, they have completed about 30 mega projects including fixed platforms and floaters, typically so-called FPSO (Floating projection, storage and offloading) or FLNG (floating Liquefied Natural Gas). The offshore oil and gas EPC contractors have recently reported massive profit losses over US$ 10 bn as shown in Figure1, between 2013 and 2015, after being awarded many EPC projects since 2010.
Sustainability2018,10, 2469 3 of 31
Sustainability 2018, 10, x FOR PEER REVIEW 3 of 31
Figure 1. Profit losses of EPC Contractor (Modified from Press Release [5]).
The reasons for recent profit losses and damages for Korean offshore EPC contractors in dealing with EPC megaprojects with lump-sum turnkey contracts are likely as follows (identified through subject matter expert interviews and literature review):
1.
Lack of EPC Contractor’s capability of FEED verification to justify complex owner requirements;2.
Lack of experience in the use of exotic materials, and installation of special equipment;3.
Lack of experience in performing a fast-track process with a limited schedule;4.
Sub-order items including local content requirements in the host country that may impact on project schedule;5.
Mandatory requirements to procure equipment from approved vendor list (AVL);6.
Owner requirements of single-point responsibility for various contractual liabilities;7.
Delay liquidated damages (so-called penalties) following schedule delay on EPC contractor are unrealistically high (as much as US$ 1–2 million/day); and8.
Re-order for major equipment and critical bulk materials and reconstruction (re-work) due to early fabrication start with incomplete detail design to comply with the completion date and milestones. [6]Many, if not most, of these issues result from improper front-end project planning. To aid contractors in minimizing these issues, the focus of this study is to develop and implement a detail engineering completion rating index system to assist EPC contractors during the initial planning stages. The model aids contractors in determining the optimal starting time for fabrication and construction works to minimize potential re-work/re-order through adequate detail design development.
2. Literature Review
There has been minimal literature dedicated to incorporating an engineering completion rating index to the project schedule and cost performance for oil and gas EPC projects. The most significant existing index models found were the project definition rating index (PDRI) by the Construction International Institute (CII) [7–10] and the front-end loading (FEL) index by Independent Project Analysis (IPA) [4]. These tools are mainly developed and utilized to define the level of completion of FEED, which is an engineering task prior to EPC detail engineering. These two indexes are typically used by the project owner to quantify the level of project definition and basic engineering maturity and to determine whether the project can move to the next project development stage, typically an EPC contract. The model developed and presented within this paper evolved from these two indexes. As such, a detailed discussion on each model, and associated literature, is discussed below.
FEL measures the level of project definition at the front-end stage of a project, which is broken down into three stages. At the FEL-1 stage, the project definition is reviewed based on the conceptual design and business case evaluation results. In FEL-2, the result of basic design is reviewed. At the end of FEED (FEL-3), the entire FEED package is reviewed for the owner to make the final “Go” or “No-Go” decision, which will result in a significant financial investment and commitment by hiring an EPC
-4000 -3000 -2000 -1000 0 1000 2000 2014 2015 2016 Pr of it Lo ss (M ill io n U SD )
H Company S Company D Company
Figure 1.Profit losses of EPC Contractor (Modified from Press Release [5]).
The reasons for recent profit losses and damages for Korean offshore EPC contractors in dealing with EPC megaprojects with lump-sum turnkey contracts are likely as follows (identified through subject matter expert interviews and literature review):
1. Lack of EPC Contractor’s capability of FEED verification to justify complex owner requirements; 2. Lack of experience in the use of exotic materials, and installation of special equipment;
3. Lack of experience in performing a fast-track process with a limited schedule;
4. Sub-order items including local content requirements in the host country that may impact on project schedule;
5. Mandatory requirements to procure equipment from approved vendor list (AVL); 6. Owner requirements of single-point responsibility for various contractual liabilities;
7. Delay liquidated damages (so-called penalties) following schedule delay on EPC contractor are unrealistically high (as much as US$ 1–2 million/day); and
8. Re-order for major equipment and critical bulk materials and reconstruction (re-work) due to early fabrication start with incomplete detail design to comply with the completion date and milestones [6].
Many, if not most, of these issues result from improper front-end project planning. To aid contractors in minimizing these issues, the focus of this study is to develop and implement a detail engineering completion rating index system to assist EPC contractors during the initial planning stages. The model aids contractors in determining the optimal starting time for fabrication and construction works to minimize potential re-work/re-order through adequate detail design development.
2. Literature Review
There has been minimal literature dedicated to incorporating an engineering completion rating index to the project schedule and cost performance for oil and gas EPC projects. The most significant existing index models found were the project definition rating index (PDRI) by the Construction International Institute (CII) [7–10] and the front-end loading (FEL) index by Independent Project Analysis (IPA) [4]. These tools are mainly developed and utilized to define the level of completion of FEED, which is an engineering task prior to EPC detail engineering. These two indexes are typically used by the project owner to quantify the level of project definition and basic engineering maturity and to determine whether the project can move to the next project development stage, typically an EPC contract. The model developed and presented within this paper evolved from these two indexes. As such, a detailed discussion on each model, and associated literature, is discussed below.
FEL measures the level of project definition at the front-end stage of a project, which is broken down into three stages. At the FEL-1 stage, the project definition is reviewed based on the conceptual design and business case evaluation results. In FEL-2, the result of basic design is reviewed. At the end of FEED (FEL-3),
Sustainability2018,10, 2469 4 of 31
the entire FEED package is reviewed for the owner to make the final “Go” or “No-Go” decision, which will result in a significant financial investment and commitment by hiring an EPC contractor. The project definition is classified according to three sections: site factors, design status, and project execution plan. FEL is used to assess the project by numerically quantifying the project definition of each element under each section and then aggregating them into a numeric index. When the FEL index is lower than a pre-determined threshold value at each stage of FEL-1/2/3, over 50% of projects were successful in terms of cost and schedule performance. On the other hand, projects in the high range of the FEL index showed poor project performance [4].
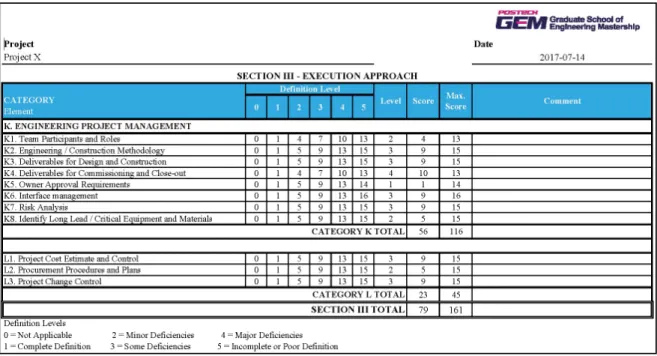
CII’s PDRI is an alternate assessment tool to IPA’s FEL as it serves the same purpose of measuring project definition from the conceptual design stage to the FEED stage of a project. The PDRI’s hierarchical structure is comprised of three sections, categories, and elements [7,8,10]. Three sections include: (a) the basis of project decisions; (b) basis of design; and (c) execution approach to holistically evaluate the project value, scope, definition, and readiness for next stages. The PDRI has 8 to 15 types of categories for each section [7–10]. At the bottom of the PDRI hierarchy, each element specifies details that can be individually reviewed. Each element is assessed on a scale of 1 to 5 (1 being highly well defined and 5 being not defined at all) and an overall PDRI index is calculated using a scoresheet weighted and normalized for each element. Three to six PDRI reviews are recommended for the owner during the project planning, and FEED stages [11]. The most important PDRI review should be carried out prior to the EPC contract, which is the final investment decision (FID). The CII recommends that the cutoff score of the PDRI at the end of the FEED stage should be 200 as the performance of a project with a score higher than 200 was historically not satisfactory in terms of cost and schedule [10,12]. PDRI can help the owner manage project scope prior to a project authorization and/or the contractor identify incomplete elements related to project scope definition [13].
Multiple publications were dedicated to testing PDRI’s effectiveness. Chu et al. [14] studied PDRI for intelligent green building projects and adjusted weight factors for each element using an analytical network process, and they also expanded PDRI elements up to the project execution phase. In another study, with 51 surveys and statistical analysis, George et al. [15] found that seven major activities have more impact on achieving project success among all activities conducted during front-end planning. This finding is aligned with the fact that PDRI elements are assigned different weights depending upon the level of influence on project outcome. Pheng and Chuan [16] also identified using an analysis of variance (ANOVA) test the five most significant variables that affect work performance in the construction industry and recommended focusing on those significant variables to develop a better working environment. Since previous studies are limited to the front-end planning stage before an EPC contract is established, EPC contractors cannot directly apply the study results to the detail design process.
In the offshore oil and gas sector, FEL and PDRI are being used as an owner’s risk analysis tool [11]. However, these tools focus on the earliest planning phases, stopping once the EPC contractor is selected. This means the tools are lacking and cannot cover the range of detail design and construction phase activities. Additionally, the characteristics of offshore oil and gas projects significantly differ from those of the other construction sectors, making the current FEL and PDRI tools difficult to use as an EPC contractor’s risk management tools.
3. Research Objectives and Contributions
The main objective of this research is to develop a detail engineering completion rating index system (DECRIS) to calculate the engineering completion rating for offshore oil and gas EPC projects, validating efficacy using existing projects. The main objective of the DECRIS is to aid contractors in knowing when they have performed enough project development to begin fabrication. As schedules are often very tight, it is important for fabrication to start as soon as possible. Thus, this paper focuses on the optimal point of fabrication start—steel cutting—in which the design is developed just enough (not more) to minimize re-work during the construction stage.
Sustainability2018,10, 2469 5 of 31
The main goals for this research are as follows:
• Research Goal 1—modeling of DECRIS by adjusting previous assessment tools such as PDRI can be developed to measure the optimal progress of detail engineering to initiate the fabrication of initial modules in the scheduling critical path.
• Research Goal 2—the correlation between the developed DECRIS score and the construction cost and schedule performance.
The research scope of building the DECRIS framework is limited to fixed platforms and floaters such as FPSO and FLNG in offshore oil and gas EPC projects. Other types of offshore structures and subsea structures are excluded in this study.
From discussion with industry experts, and as defined within this paper, the existing tools (PDRI and FEL) are more than adequate in aiding owners through pre-planning of specific types. However, they generally stop at the stage of executing a contract with the contractor and are not tailored for contractor procurement/fabrication scheduling nor the oil and gas industries. As such, one of the main contributions of this research is to present a superior tool than before, focusing on FEED engineering completion prior to EPC projects. What is most lacking for oil and gas projects in using the PDRI and/or FEL methods is when to begin fabrication (discussed above). As such, the DECRIS’s added benefit to the industry is most significantly aiding the contractor in finding the optimal point of the fabrication start of the oil and gas EPC projects.
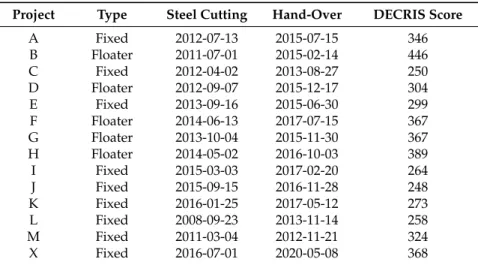
To provide support that the presented tool is better than existing tools, thirteen offshore EPC megaprojects recently completed are presented (in Section6.1) for the verification of the DECRIS model. Analysis is performed on the tool’s ability to predict the real projects’ actual cost and schedule performance data. The DECRIS model can contribute to industry as a decision support tool during the EPC contract execution stage to assist EPC contractors in making informed and timely decisions on initiating their construction work activities.
4. Research Methodology for the DECRIS Model
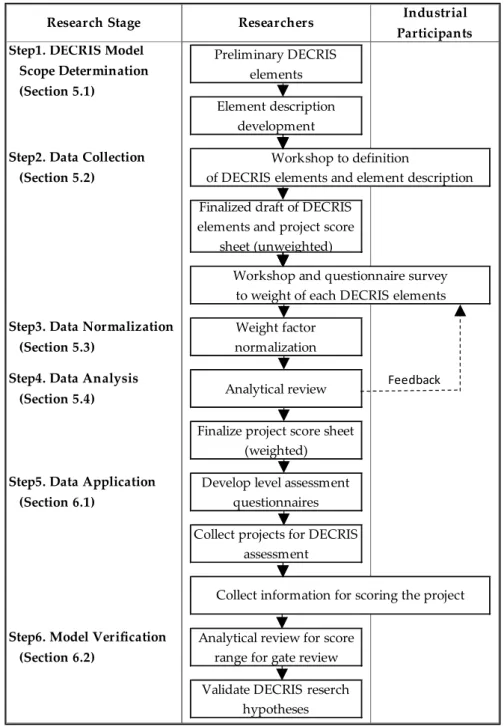
The DECRIS methodology follows the PDRI approaches in its development, which has been proven through existing literature to develop a simple assessment model to solve a complex project problem. The methodology used to develop the model of the DECRIS model is depicted in Figure2.
It involves six steps:
(1) DECRIS model scope determination: collect the preliminary elements from the existing literature and develop the element description
(2) Data collection: a workshop was performed with industry experts to determine elements that affect the calculation of the detail engineering completion rating and to organize the identified elements in proper sections and categories. The expert survey was also used for data collection to calculate the relative importance of each element to engineering completion.
(3) Data normalization: to determine the weight factor for each of the DECRIS elements using the data from the expert survey, data normalization, preliminary estimate, validation process, element average weight calculation, and interpolation were carried out.
(4) Data analysis: one sample t-test is used to finalize the weight factor of each element. The weight factor of each element indicates the level of importance of the element’s contribution to the detail engineering completion rating index.
(5) Data application: the DECRIS model developed through the previous research stages is verified by applying it to the 13 sample projects. Each project was assessed using the DECRIS level assessments.
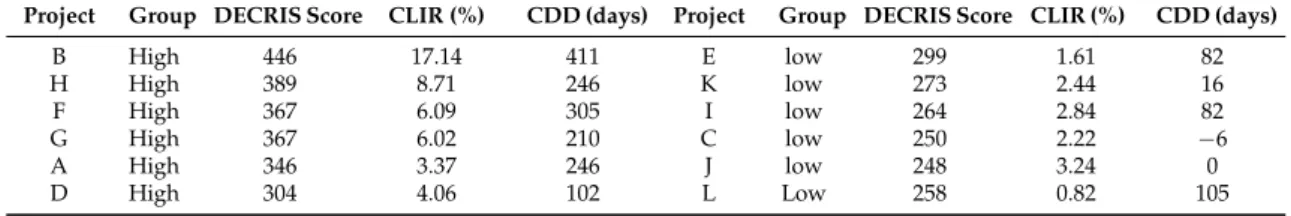
(6) Model verification: the score outputs were then compared with the project performances of each project (using statistical analyses) to see the level at which the model could predict project performance. A cutoff score was then developed based on the model and sample projects.
Sustainability2018,10, 2469 6 of 31
Sustainability 2018, 10, x FOR PEER REVIEW 6 of 31
Figure 2. DECRIS Model Development Flowchart. 5. DECRIS Model Development
5.1. Step 1: DECRIS Model Scope Determination: Preliminary Elements
In this step, the authors collect preliminary elements (so-called draft of DECRIS elements) from existing literature. This acts as a starting point to define, roughly, the elements which affect detail engineering completion. The preliminary element list is the full set of the possible element items, discovered through a literature review, to determine the assessment scope of DECRIS. This is also used for step two when discussing and refining said exhaustive list of elements to be used in the final model. The most important elements of pre-planning have been identified through existing PDRI and FEL literature and models. As such, the preliminary elements for the DECRIS model were taken from the PDRI-Industrial, PDRI-small industrial, PDRI-infrastructure, and front-end loading phase 2 and 3 models. To ensure the model fit EPC oil and gas projects, the authors also consulted the contractor’s information flow network for an oil and gas EPC project, and the oil and gas engineering guide.
Research Stage
Preliminary DECRIS elements Element description
development
Step2. Data Collection (Section 5.2)
Finalized draft of DECRIS elements and project score
sheet (unweighted)
Step3. Data Normalization (Section 5.3)
Weight factor normalization
Step4. Data Analysis
(Section 5.4) Analytical review
Finalize project score sheet (weighted)
Step5. Data Application (Section 6.1)
Develop level assessment questionnaires Collect projects for DECRIS
assessment
Step6. Model Verification (Section 6.2)
Analytical review for score range for gate review Validate DECRIS reserch
hypotheses
Collect information for scoring the project
Researchers Industrial
Participants
Workshop and questionnaire survey to weight of each DECRIS elements
Workshop to definition
of DECRIS elements and element description
Step1. DECRIS Model Scope Determination (Section 5.1)
Feedback
Figure 2.DECRIS Model Development Flowchart. 5. DECRIS Model Development
5.1. Step 1: DECRIS Model Scope Determination: Preliminary Elements
In this step, the authors collect preliminary elements (so-called draft of DECRIS elements) from existing literature. This acts as a starting point to define, roughly, the elements which affect detail engineering completion. The preliminary element list is the full set of the possible element items, discovered through a literature review, to determine the assessment scope of DECRIS. This is also used for step two when discussing and refining said exhaustive list of elements to be used in the final model.
The most important elements of pre-planning have been identified through existing PDRI and FEL literature and models. As such, the preliminary elements for the DECRIS model were taken from the PDRI-Industrial, PDRI-small industrial, PDRI-infrastructure, and front-end loading phase 2 and 3
Sustainability2018,10, 2469 7 of 31
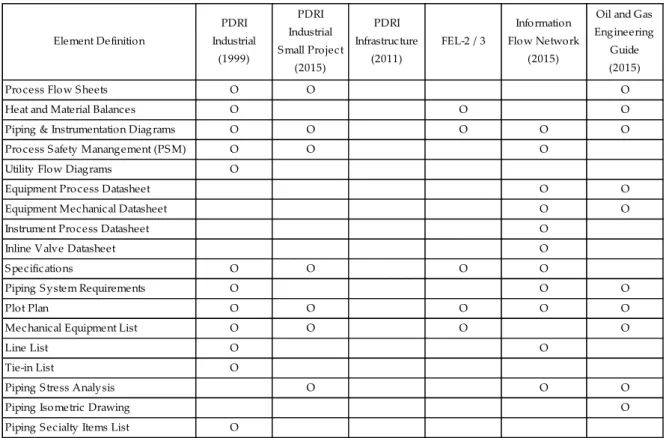
models. To ensure the model fit EPC oil and gas projects, the authors also consulted the contractor’s information flow network for an oil and gas EPC project, and the oil and gas engineering guide. Through the content analysis, a data set of 98 preliminary DECRIS elements was initially developed. A part of preliminary element set which is related to engineering deliverables (18 elements shown in Figure3among the overall 98 elements collected from contents analysis) is shown in Figure3.
Sustainability 2018, 10, x FOR PEER REVIEW 7 of 31
Through the content analysis, a data set of 98 preliminary DECRIS elements was initially developed. A part of preliminary element set which is related to engineering deliverables (18 elements shown in Figure 3 among the overall 98 elements collected from contents analysis) is shown in Figure 3.
Figure 3. Sample of Preliminary Elements (Engineering Deliverable). 5.2. Step 2: DECRIS Element Finalization
For the second step, a workshop and survey were performed. The focus group workshop was performed with nine industry experts with over 10 years of experience in detail engineering of offshore oil and gas projects. The goal of this workshop was to determine elements that affect the calculation of the detail engineering completion rating and to organize the identified elements in its proper section and category. Random sampling might be more efficient to increase the representativeness of the population [17]. However, because of the limit on the availability of knowledgeable experts (SME: subject matter expert) in the local industry from a practical point of view, judgmental and snowball sampling were used with various discipline experts invited in this research.
The 98 preliminary elements were reduced to 69 DECRIS key elements through brainstorming session in the focus group and individual interviews, and the sections and categories were structured as shown in Table 1. The number of elements and categories in each section are shown in Table 2. The overall hierarchy and its structure was benchmarked from the PDRI framework. However, each element for DECRIS was identified, defined, and customized for detail engineering for offshore oil and gas projects.
Process Flow Sheets O O O
Heat and Material Balances O O O
Piping & Instrumentation Diagrams O O O O O
Process Safety Manangement (PSM) O O O
Utility Flow Diagrams O
Equipment Process Datasheet O O
Equipment Mechanical Datasheet O O
Instrument Process Datasheet O
Inline Valve Datasheet O
Specifications O O O O
Piping System Requirements O O O
Plot Plan O O O O O
Mechanical Equipment List O O O O
Line List O O
Tie-in List O
Piping Stress Analysis O O O
Piping Isometric Drawing O
Piping Secialty Items List O Element Definition PDRI Industrial (1999) FEL-2 / 3 Information Flow Network (2015)
Oil and Gas Engineering Guide (2015) PDRI Infrastructure (2011) PDRI Industrial Small Project (2015)
Figure 3.Sample of Preliminary Elements (Engineering Deliverable).
5.2. Step 2: DECRIS Element Finalization
For the second step, a workshop and survey were performed. The focus group workshop was performed with nine industry experts with over 10 years of experience in detail engineering of offshore oil and gas projects. The goal of this workshop was to determine elements that affect the calculation of the detail engineering completion rating and to organize the identified elements in its proper section and category. Random sampling might be more efficient to increase the representativeness of the population [17]. However, because of the limit on the availability of knowledgeable experts (SME: subject matter expert) in the local industry from a practical point of view, judgmental and snowball sampling were used with various discipline experts invited in this research.
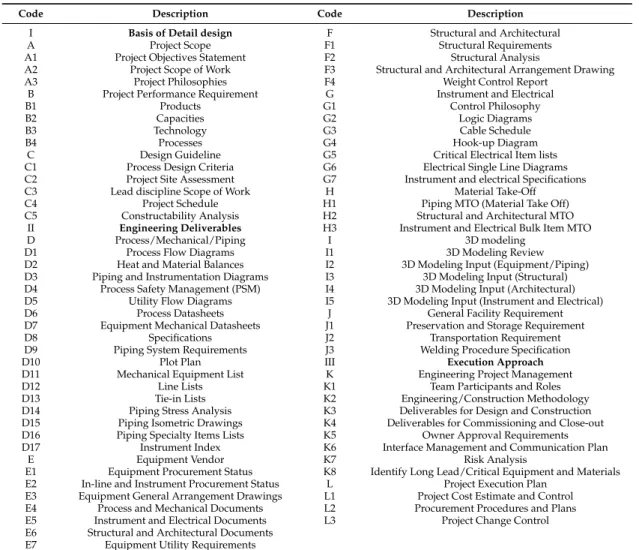
The 98 preliminary elements were reduced to 69 DECRIS key elements through brainstorming session in the focus group and individual interviews, and the sections and categories were structured as shown in Table1. The number of elements and categories in each section are shown in Table2. The overall hierarchy and its structure was benchmarked from the PDRI framework. However, each element for DECRIS was identified, defined, and customized for detail engineering for offshore oil and gas projects.
Sustainability2018,10, 2469 8 of 31
Table 1.DECRIS Sections, Categories and Elements.
Code Description Code Description
I Basis of Detail design F Structural and Architectural
A Project Scope F1 Structural Requirements
A1 Project Objectives Statement F2 Structural Analysis
A2 Project Scope of Work F3 Structural and Architectural Arrangement Drawing A3 Project Philosophies F4 Weight Control Report
B Project Performance Requirement G Instrument and Electrical
B1 Products G1 Control Philosophy
B2 Capacities G2 Logic Diagrams
B3 Technology G3 Cable Schedule
B4 Processes G4 Hook-up Diagram
C Design Guideline G5 Critical Electrical Item lists C1 Process Design Criteria G6 Electrical Single Line Diagrams C2 Project Site Assessment G7 Instrument and electrical Specifications C3 Lead discipline Scope of Work H Material Take-Off C4 Project Schedule H1 Piping MTO (Material Take Off) C5 Constructability Analysis H2 Structural and Architectural MTO
II Engineering Deliverables H3 Instrument and Electrical Bulk Item MTO
D Process/Mechanical/Piping I 3D modeling
D1 Process Flow Diagrams I1 3D Modeling Review
D2 Heat and Material Balances I2 3D Modeling Input (Equipment/Piping) D3 Piping and Instrumentation Diagrams I3 3D Modeling Input (Structural) D4 Process Safety Management (PSM) I4 3D Modeling Input (Architectural) D5 Utility Flow Diagrams I5 3D Modeling Input (Instrument and Electrical) D6 Process Datasheets J General Facility Requirement D7 Equipment Mechanical Datasheets J1 Preservation and Storage Requirement
D8 Specifications J2 Transportation Requirement
D9 Piping System Requirements J3 Welding Procedure Specification
D10 Plot Plan III Execution Approach
D11 Mechanical Equipment List K Engineering Project Management
D12 Line Lists K1 Team Participants and Roles
D13 Tie-in Lists K2 Engineering/Construction Methodology D14 Piping Stress Analysis K3 Deliverables for Design and Construction D15 Piping Isometric Drawings K4 Deliverables for Commissioning and Close-out D16 Piping Specialty Items Lists K5 Owner Approval Requirements D17 Instrument Index K6 Interface Management and Communication Plan
E Equipment Vendor K7 Risk Analysis
E1 Equipment Procurement Status K8 Identify Long Lead/Critical Equipment and Materials E2 In-line and Instrument Procurement Status L Project Execution Plan
E3 Equipment General Arrangement Drawings L1 Project Cost Estimate and Control E4 Process and Mechanical Documents L2 Procurement Procedures and Plans E5 Instrument and Electrical Documents L3 Project Change Control E6 Structural and Architectural Documents
E7 Equipment Utility Requirements
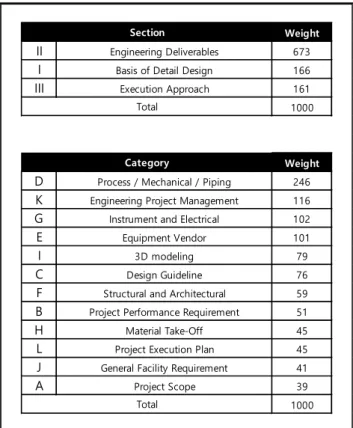
Table 2.Categories and Elements for each Section.
Section No of Category No of Element
Basis of Detail Design 3 12
Engineering Deliverables 7 46
Execution Approach 2 11
Total 12 69
The first section, the basis of detail design, consists of three categories (project scope, project performance requirements, and design guidelines) and 12 elements that assist in understanding the project’s objectives. Completion rating of this section specifies how the project is sufficiently organized in line with the project objectives.
The second section, engineering deliverables, includes 46 elements that provide technical information to understand and assess the technical requirements for the detail design of a project. The elements included in this section are generally finalized in sequential submissions and revision control for engineering documents in the process of approval from the owners during the detail design stage including (a) the preliminary issue, (b) issue for approval (IFA), (c) approved for design (AFD) and (d) AFC. The terms can vary according to the specific project requirements or type of engineering deliverable. The seven categories in this section consist of process/mechanical/piping, equipment vendor, structural/architectural, instrument/electrical, material take-off, 3D modeling, and general facility requirement.
Sustainability2018,10, 2469 9 of 31
The third section, execution approach, consists of two categories and 11 elements that define the approach method for the contractor’s strategies and execution from engineering to construction. Categories of this section consist of engineering project management and project execution plan.
Each element selected through the expert group workshop is assigned a different weight to measure the detail engineering completion rating. To verify the importance of an element, a weight factor for each element was recalibrated through an expert survey and an additional statistical analysis. Prior to the expert survey, an unweighted project scoresheet and descriptions of the elements were provided to increase the survey participants’ understanding of each element.
The DECRIS element description Box1. “E1. Equipment Procurement Status” is shown below as an example.
Box 1.E1. Equipment Procurement Status. E1. Equipment Procurement Status
The equipment procurement status refers to all of the Vendor’s processes from material requisition to equipment (mechanical, electrical, etc.) delivery in line with the Required on Site (ROS). In a project, the overall processes for equipment procurement status should be managed without delay during the detail design and construction stages. The following items need to be considered.
Sustainability 2018, 10, x FOR PEER REVIEW 9 of 31
for engineering documents in the process of approval from the owners during the detail design stage including (a) the preliminary issue, (b) issue for approval (IFA), (c) approved for design (AFD) and (d) AFC. The terms can vary according to the specific project requirements or type of engineering deliverable. The seven categories in this section consist of process/mechanical/piping, equipment vendor, structural/architectural, instrument/electrical, material take-off, 3D modeling, and general facility requirement.
The third section, execution approach, consists of two categories and 11 elements that define the approach method for the contractor’s strategies and execution from engineering to construction. Categories of this section consist of engineering project management and project execution plan.
Each element selected through the expert group workshop is assigned a different weight to measure the detail engineering completion rating. To verify the importance of an element, a weight factor for each element was recalibrated through an expert survey and an additional statistical analysis. Prior to the expert survey, an unweighted project scoresheet and descriptions of the elements were provided to increase the survey participants’ understanding of each element.
The DECRIS element description Box 1. “E1. Equipment Procurement Status” is shown below as an example.
Box 1. E1. Equipment Procurement Status
The expert survey was also used for data collection to weigh each element. Thomson [18] studied the optimum sample size for surveys or interviews and concluded it to be 25, from a review of over 100 studies using grounded theory. In this research, 32 survey participants were assigned for data collection to weigh each element. To collect a meaningful sampling group with over cumulative 400 years of experience in offshore oil and gas EPC projects, judgmental sampling and snowball sampling methods were used. Once again, random sampling might be more efficient to increase the representativeness of the population [17]. However, because of the limit on the availability of knowledgeable experts in the local industry from a practical point of view, judgmental and snowball sampling were used with various discipline experts invited in this research. On average, each expert participant has over 13 years of experience in detail design engineering or project management for offshore oil and gas EPC projects or over 10 years of experience in project management consultancy. Most of the survey participants were selected from two major EPC contractors (H company and S company in South Korea). To increase survey reliability, the expert survey was carried out using only face-to-face interviews. The information on the experience of the survey participants is shown in Table 3.
E1. Equipment Procurement Status
The equipment procurement status refers to all of the Vendor’s processes from material requisition to equipment (mechanical, electrical, etc.) delivery in line with the Required on Site (ROS). In a project, the overall processes for equipment procurement status should be managed without delay during the detail design and construction stages. The following items need to be considered.
❏ Material Requisition
❏ Bid Closing
❏ Technical Bid Evaluation / Tabulation
❏ Updated Material Requisition
❏ Purchase Order
❏ Vendor documentation
❏ Fabrication Work Commence
❏ Factory Acceptance Test
❏ Equipment Delivery along with ROS
❏ Others
Material Requisition
Sustainability 2018, 10, x FOR PEER REVIEW 9 of 31
for engineering documents in the process of approval from the owners during the detail design stage including (a) the preliminary issue, (b) issue for approval (IFA), (c) approved for design (AFD) and (d) AFC. The terms can vary according to the specific project requirements or type of engineering deliverable. The seven categories in this section consist of process/mechanical/piping, equipment vendor, structural/architectural, instrument/electrical, material take-off, 3D modeling, and general facility requirement.
The third section, execution approach, consists of two categories and 11 elements that define the approach method for the contractor’s strategies and execution from engineering to construction. Categories of this section consist of engineering project management and project execution plan.
Each element selected through the expert group workshop is assigned a different weight to measure the detail engineering completion rating. To verify the importance of an element, a weight factor for each element was recalibrated through an expert survey and an additional statistical analysis. Prior to the expert survey, an unweighted project scoresheet and descriptions of the elements were provided to increase the survey participants’ understanding of each element.
The DECRIS element description Box 1. “E1. Equipment Procurement Status” is shown below as an example.
Box 1. E1. Equipment Procurement Status
The expert survey was also used for data collection to weigh each element. Thomson [18] studied the optimum sample size for surveys or interviews and concluded it to be 25, from a review of over 100 studies using grounded theory. In this research, 32 survey participants were assigned for data collection to weigh each element. To collect a meaningful sampling group with over cumulative 400 years of experience in offshore oil and gas EPC projects, judgmental sampling and snowball sampling methods were used. Once again, random sampling might be more efficient to increase the representativeness of the population [17]. However, because of the limit on the availability of knowledgeable experts in the local industry from a practical point of view, judgmental and snowball sampling were used with various discipline experts invited in this research. On average, each expert participant has over 13 years of experience in detail design engineering or project management for offshore oil and gas EPC projects or over 10 years of experience in project management consultancy. Most of the survey participants were selected from two major EPC contractors (H company and S company in South Korea). To increase survey reliability, the expert survey was carried out using only face-to-face interviews. The information on the experience of the survey participants is shown in Table 3.
E1. Equipment Procurement Status
The equipment procurement status refers to all of the Vendor’s processes from material requisition to equipment (mechanical, electrical, etc.) delivery in line with the Required on Site (ROS). In a project, the overall processes for equipment procurement status should be managed without delay during the detail design and construction stages. The following items need to be considered.
❏ Material Requisition
❏ Bid Closing
❏ Technical Bid Evaluation / Tabulation
❏ Updated Material Requisition
❏ Purchase Order
❏ Vendor documentation
❏ Fabrication Work Commence
❏ Factory Acceptance Test
❏ Equipment Delivery along with ROS
❏ Others
Bid Closing
Sustainability 2018, 10, x FOR PEER REVIEW 9 of 31
for engineering documents in the process of approval from the owners during the detail design stage including (a) the preliminary issue, (b) issue for approval (IFA), (c) approved for design (AFD) and (d) AFC. The terms can vary according to the specific project requirements or type of engineering deliverable. The seven categories in this section consist of process/mechanical/piping, equipment vendor, structural/architectural, instrument/electrical, material take-off, 3D modeling, and general facility requirement.
The third section, execution approach, consists of two categories and 11 elements that define the approach method for the contractor’s strategies and execution from engineering to construction. Categories of this section consist of engineering project management and project execution plan.
Each element selected through the expert group workshop is assigned a different weight to measure the detail engineering completion rating. To verify the importance of an element, a weight factor for each element was recalibrated through an expert survey and an additional statistical analysis. Prior to the expert survey, an unweighted project scoresheet and descriptions of the elements were provided to increase the survey participants’ understanding of each element.
The DECRIS element description Box 1. “E1. Equipment Procurement Status” is shown below as an example.
Box 1. E1. Equipment Procurement Status
The expert survey was also used for data collection to weigh each element. Thomson [18] studied the optimum sample size for surveys or interviews and concluded it to be 25, from a review of over 100 studies using grounded theory. In this research, 32 survey participants were assigned for data collection to weigh each element. To collect a meaningful sampling group with over cumulative 400 years of experience in offshore oil and gas EPC projects, judgmental sampling and snowball sampling methods were used. Once again, random sampling might be more efficient to increase the representativeness of the population [17]. However, because of the limit on the availability of knowledgeable experts in the local industry from a practical point of view, judgmental and snowball sampling were used with various discipline experts invited in this research. On average, each expert participant has over 13 years of experience in detail design engineering or project management for offshore oil and gas EPC projects or over 10 years of experience in project management consultancy. Most of the survey participants were selected from two major EPC contractors (H company and S company in South Korea). To increase survey reliability, the expert survey was carried out using only face-to-face interviews. The information on the experience of the survey participants is shown in Table 3.
E1. Equipment Procurement Status
The equipment procurement status refers to all of the Vendor’s processes from material requisition to equipment (mechanical, electrical, etc.) delivery in line with the Required on Site (ROS). In a project, the overall processes for equipment procurement status should be managed without delay during the detail design and construction stages. The following items need to be considered.
❏ Material Requisition
❏ Bid Closing
❏ Technical Bid Evaluation / Tabulation
❏ Updated Material Requisition
❏ Purchase Order
❏ Vendor documentation
❏ Fabrication Work Commence
❏ Factory Acceptance Test
❏ Equipment Delivery along with ROS
❏ Others
Technical Bid Evaluation/Tabulation
Sustainability 2018, 10, x FOR PEER REVIEW 9 of 31
for engineering documents in the process of approval from the owners during the detail design stage including (a) the preliminary issue, (b) issue for approval (IFA), (c) approved for design (AFD) and (d) AFC. The terms can vary according to the specific project requirements or type of engineering deliverable. The seven categories in this section consist of process/mechanical/piping, equipment vendor, structural/architectural, instrument/electrical, material take-off, 3D modeling, and general facility requirement.
The third section, execution approach, consists of two categories and 11 elements that define the approach method for the contractor’s strategies and execution from engineering to construction. Categories of this section consist of engineering project management and project execution plan.
Each element selected through the expert group workshop is assigned a different weight to measure the detail engineering completion rating. To verify the importance of an element, a weight factor for each element was recalibrated through an expert survey and an additional statistical analysis. Prior to the expert survey, an unweighted project scoresheet and descriptions of the elements were provided to increase the survey participants’ understanding of each element.
The DECRIS element description Box 1. “E1. Equipment Procurement Status” is shown below as an example.
Box 1. E1. Equipment Procurement Status
The expert survey was also used for data collection to weigh each element. Thomson [18] studied the optimum sample size for surveys or interviews and concluded it to be 25, from a review of over 100 studies using grounded theory. In this research, 32 survey participants were assigned for data collection to weigh each element. To collect a meaningful sampling group with over cumulative 400 years of experience in offshore oil and gas EPC projects, judgmental sampling and snowball sampling methods were used. Once again, random sampling might be more efficient to increase the representativeness of the population [17]. However, because of the limit on the availability of knowledgeable experts in the local industry from a practical point of view, judgmental and snowball sampling were used with various discipline experts invited in this research. On average, each expert participant has over 13 years of experience in detail design engineering or project management for offshore oil and gas EPC projects or over 10 years of experience in project management consultancy. Most of the survey participants were selected from two major EPC contractors (H company and S company in South Korea). To increase survey reliability, the expert survey was carried out using only face-to-face interviews. The information on the experience of the survey participants is shown in Table 3.
E1. Equipment Procurement Status
The equipment procurement status refers to all of the Vendor’s processes from material requisition to equipment (mechanical, electrical, etc.) delivery in line with the Required on Site (ROS). In a project, the overall processes for equipment procurement status should be managed without delay during the detail design and construction stages. The following items need to be considered.
❏ Material Requisition
❏ Bid Closing
❏ Technical Bid Evaluation / Tabulation
❏ Updated Material Requisition
❏ Purchase Order
❏ Vendor documentation
❏ Fabrication Work Commence
❏ Factory Acceptance Test
❏ Equipment Delivery along with ROS
❏ Others
Updated Material Requisition
Sustainability 2018, 10, x FOR PEER REVIEW 9 of 31
for engineering documents in the process of approval from the owners during the detail design stage including (a) the preliminary issue, (b) issue for approval (IFA), (c) approved for design (AFD) and (d) AFC. The terms can vary according to the specific project requirements or type of engineering deliverable. The seven categories in this section consist of process/mechanical/piping, equipment vendor, structural/architectural, instrument/electrical, material take-off, 3D modeling, and general facility requirement.
The third section, execution approach, consists of two categories and 11 elements that define the approach method for the contractor’s strategies and execution from engineering to construction. Categories of this section consist of engineering project management and project execution plan.
Each element selected through the expert group workshop is assigned a different weight to measure the detail engineering completion rating. To verify the importance of an element, a weight factor for each element was recalibrated through an expert survey and an additional statistical analysis. Prior to the expert survey, an unweighted project scoresheet and descriptions of the elements were provided to increase the survey participants’ understanding of each element.
The DECRIS element description Box 1. “E1. Equipment Procurement Status” is shown below as an example.
Box 1. E1. Equipment Procurement Status
The expert survey was also used for data collection to weigh each element. Thomson [18] studied the optimum sample size for surveys or interviews and concluded it to be 25, from a review of over 100 studies using grounded theory. In this research, 32 survey participants were assigned for data collection to weigh each element. To collect a meaningful sampling group with over cumulative 400 years of experience in offshore oil and gas EPC projects, judgmental sampling and snowball sampling methods were used. Once again, random sampling might be more efficient to increase the representativeness of the population [17]. However, because of the limit on the availability of knowledgeable experts in the local industry from a practical point of view, judgmental and snowball sampling were used with various discipline experts invited in this research. On average, each expert participant has over 13 years of experience in detail design engineering or project management for offshore oil and gas EPC projects or over 10 years of experience in project management consultancy. Most of the survey participants were selected from two major EPC contractors (H company and S company in South Korea). To increase survey reliability, the expert survey was carried out using only face-to-face interviews. The information on the experience of the survey participants is shown in Table 3.
E1. Equipment Procurement Status
The equipment procurement status refers to all of the Vendor’s processes from material requisition to equipment (mechanical, electrical, etc.) delivery in line with the Required on Site (ROS). In a project, the overall processes for equipment procurement status should be managed without delay during the detail design and construction stages. The following items need to be considered.
❏ Material Requisition
❏ Bid Closing
❏ Technical Bid Evaluation / Tabulation
❏ Updated Material Requisition
❏ Purchase Order
❏ Vendor documentation
❏ Fabrication Work Commence
❏ Factory Acceptance Test
❏ Equipment Delivery along with ROS
❏ Others
Purchase Order
Sustainability 2018, 10, x FOR PEER REVIEW 9 of 31
for engineering documents in the process of approval from the owners during the detail design stage including (a) the preliminary issue, (b) issue for approval (IFA), (c) approved for design (AFD) and (d) AFC. The terms can vary according to the specific project requirements or type of engineering deliverable. The seven categories in this section consist of process/mechanical/piping, equipment vendor, structural/architectural, instrument/electrical, material take-off, 3D modeling, and general facility requirement.
The third section, execution approach, consists of two categories and 11 elements that define the approach method for the contractor’s strategies and execution from engineering to construction. Categories of this section consist of engineering project management and project execution plan.
Each element selected through the expert group workshop is assigned a different weight to measure the detail engineering completion rating. To verify the importance of an element, a weight factor for each element was recalibrated through an expert survey and an additional statistical analysis. Prior to the expert survey, an unweighted project scoresheet and descriptions of the elements were provided to increase the survey participants’ understanding of each element.
The DECRIS element description Box 1. “E1. Equipment Procurement Status” is shown below as an example.
Box 1. E1. Equipment Procurement Status
The expert survey was also used for data collection to weigh each element. Thomson [18] studied the optimum sample size for surveys or interviews and concluded it to be 25, from a review of over 100 studies using grounded theory. In this research, 32 survey participants were assigned for data collection to weigh each element. To collect a meaningful sampling group with over cumulative 400 years of experience in offshore oil and gas EPC projects, judgmental sampling and snowball sampling methods were used. Once again, random sampling might be more efficient to increase the representativeness of the population [17]. However, because of the limit on the availability of knowledgeable experts in the local industry from a practical point of view, judgmental and snowball sampling were used with various discipline experts invited in this research. On average, each expert participant has over 13 years of experience in detail design engineering or project management for offshore oil and gas EPC projects or over 10 years of experience in project management consultancy. Most of the survey participants were selected from two major EPC contractors (H company and S company in South Korea). To increase survey reliability, the expert survey was carried out using only face-to-face interviews. The information on the experience of the survey participants is shown in Table 3.
E1. Equipment Procurement Status
The equipment procurement status refers to all of the Vendor’s processes from material requisition to equipment (mechanical, electrical, etc.) delivery in line with the Required on Site (ROS). In a project, the overall processes for equipment procurement status should be managed without delay during the detail design and construction stages. The following items need to be considered.
❏ Material Requisition
❏ Bid Closing
❏ Technical Bid Evaluation / Tabulation
❏ Updated Material Requisition
❏ Purchase Order
❏ Vendor documentation
❏ Fabrication Work Commence
❏ Factory Acceptance Test
❏ Equipment Delivery along with ROS
❏ Others
Vendor documentation
Sustainability 2018, 10, x FOR PEER REVIEW 9 of 31
for engineering documents in the process of approval from the owners during the detail design stage including (a) the preliminary issue, (b) issue for approval (IFA), (c) approved for design (AFD) and (d) AFC. The terms can vary according to the specific project requirements or type of engineering deliverable. The seven categories in this section consist of process/mechanical/piping, equipment vendor, structural/architectural, instrument/electrical, material take-off, 3D modeling, and general facility requirement.
The third section, execution approach, consists of two categories and 11 elements that define the approach method for the contractor’s strategies and execution from engineering to construction. Categories of this section consist of engineering project management and project execution plan.
Each element selected through the expert group workshop is assigned a different weight to measure the detail engineering completion rating. To verify the importance of an element, a weight factor for each element was recalibrated through an expert survey and an additional statistical analysis. Prior to the expert survey, an unweighted project scoresheet and descriptions of the elements were provided to increase the survey participants’ understanding of each element.
The DECRIS element description Box 1. “E1. Equipment Procurement Status” is shown below as an example.
Box 1. E1. Equipment Procurement Status
The expert survey was also used for data collection to weigh each element. Thomson [18] studied the optimum sample size for surveys or interviews and concluded it to be 25, from a review of over 100 studies using grounded theory. In this research, 32 survey participants were assigned for data collection to weigh each element. To collect a meaningful sampling group with over cumulative 400 years of experience in offshore oil and gas EPC projects, judgmental sampling and snowball sampling methods were used. Once again, random sampling might be more efficient to increase the representativeness of the population [17]. However, because of the limit on the availability of knowledgeable experts in the local industry from a practical point of view, judgmental and snowball sampling were used with various discipline experts invited in this research. On average, each expert participant has over 13 years of experience in detail design engineering or project management for offshore oil and gas EPC projects or over 10 years of experience in project management consultancy. Most of the survey participants were selected from two major EPC contractors (H company and S company in South Korea). To increase survey reliability, the expert survey was carried out using only face-to-face interviews. The information on the experience of the survey participants is shown in Table 3.
E1. Equipment Procurement Status
The equipment procurement status refers to all of the Vendor’s processes from material requisition to equipment (mechanical, electrical, etc.) delivery in line with the Required on Site (ROS). In a project, the overall processes for equipment procurement status should be managed without delay during the detail design and construction stages. The following items need to be considered.
❏ Material Requisition
❏ Bid Closing
❏ Technical Bid Evaluation / Tabulation
❏ Updated Material Requisition
❏ Purchase Order
❏ Vendor documentation
❏ Fabrication Work Commence
❏ Factory Acceptance Test
❏ Equipment Delivery along with ROS
❏ Others
Fabrication Work Commence
Sustainability 2018, 10, x FOR PEER REVIEW 9 of 31
for engineering documents in the process of approval from the owners during the detail design stage including (a) the preliminary issue, (b) issue for approval (IFA), (c) approved for design (AFD) and (d) AFC. The terms can vary according to the specific project requirements or type of engineering deliverable. The seven categories in this section consist of process/mechanical/piping, equipment vendor, structural/architectural, instrument/electrical, material take-off, 3D modeling, and general facility requirement.
The third section, execution approach, consists of two categories and 11 elements that define the approach method for the contractor’s strategies and execution from engineering to construction. Categories of this section consist of engineering project management and project execution plan.
Each element selected through the expert group workshop is assigned a different weight to measure the detail engineering completion rating. To verify the importance of an element, a weight factor for each element was recalibrated through an expert survey and an additional statistical analysis. Prior to the expert survey, an unweighted project scoresheet and descriptions of the elements were provided to increase the survey participants’ understanding of each element.
The DECRIS element description Box 1. “E1. Equipment Procurement Status” is shown below as an example.
Box 1. E1. Equipment Procurement Status
The expert survey was also used for data collection to weigh each element. Thomson [18] studied the optimum sample size for surveys or interviews and concluded it to be 25, from a review of over 100 studies using grounded theory. In this research, 32 survey participants were assigned for data collection to weigh each element. To collect a meaningful sampling group with over cumulative 400 years of experience in offshore oil and gas EPC projects, judgmental sampling and snowball sampling methods were used. Once again, random sampling might be more efficient to increase the representativeness of the population [17]. However, because of the limit on the availability of knowledgeable experts in the local industry from a practical point of view, judgmental and snowball sampling were used with various discipline experts invited in this research. On average, each expert participant has over 13 years of experience in detail design engineering or project management for offshore oil and gas EPC projects or over 10 years of experience in project management consultancy. Most of the survey participants were selected from two major EPC contractors (H company and S company in South Korea). To increase survey reliability, the expert survey was carried out using only face-to-face interviews. The information on the experience of the survey participants is shown in Table 3.
E1. Equipment Procurement Status
The equipment procurement status refers to all of the Vendor’s processes from material requisition to equipment (mechanical, electrical, etc.) delivery in line with the Required on Site (ROS). In a project, the overall processes for equipment procurement status should be managed without delay during the detail design and construction stages. The following items need to be considered.
❏ Material Requisition
❏ Bid Closing
❏ Technical Bid Evaluation / Tabulation
❏ Updated Material Requisition
❏ Purchase Order
❏ Vendor documentation
❏ Fabrication Work Commence
❏ Factory Acceptance Test
❏ Equipment Delivery along with ROS
❏ Others
Factory Acceptance Test
Sustainability 2018, 10, x FOR PEER REVIEW 9 of 31
for engineering documents in the process of approval from the owners during the detail design stage including (a) the preliminary issue, (b) issue for approval (IFA), (c) approved for design (AFD) and (d) AFC. The terms can vary according to the specific project requirements or type of engineering deliverable. The seven categories in this section consist of process/mechanical/piping, equipment vendor, structural/architectural, instrument/electrical, material take-off, 3D modeling, and general facility requirement.
The third section, execution approach, consists of two categories and 11 elements that define the approach method for the contractor’s strategies and execution from engineering to construction. Categories of this section consist of engineering project management and project execution plan.
Each element selected through the expert group workshop is assigned a different weight to measure the detail engineering completion rating. To verify the importance of an element, a weight factor for each element was recalibrated through an expert survey and an additional statistical analysis. Prior to the expert survey, an unweighted project scoresheet and descriptions of the elements were provided to increase the survey participants’ understanding of each element.
The DECRIS element description Box 1. “E1. Equipment Procurement Status” is shown below as an example.
Box 1. E1. Equipment Procurement Status
The expert survey was also used for data collection to weigh each element. Thomson [18] studied the optimum sample size for surveys or interviews and concluded it to be 25, from a review of over 100 studies using grounded theory. In this research, 32 survey participants were assigned for data collection to weigh each element. To collect a meaningful sampling group with over cumulative 400 years of experience in offshore oil and gas EPC projects, judgmental sampling and snowball sampling methods were used. Once again, random sampling might be more efficient to increase the representativeness of the population [17]. However, because of the limit on the availability of knowledgeable experts in the local industry from a practical point of view, judgmental and snowball sampling were used with various discipline experts invited in this research. On average, each expert participant has over 13 years of experience in detail design engineering or project management for offshore oil and gas EPC projects or over 10 years of experience in project management consultancy. Most of the survey participants were selected from two major EPC contractors (H company and S company in South Korea). To increase survey reliability, the expert survey was carried out using only face-to-face interviews. The information on the experience of the survey participants is shown in Table 3.
E1. Equipment Procurement Status
The equipment procurement status refers to all of the Vendor’s processes from material requisition to equipment (mechanical, electrical, etc.) delivery in line with the Required on Site (ROS). In a project, the overall processes for equipment procurement status should be managed without delay during the detail design and construction stages. The following items need to be considered.
❏ Material Requisition
❏ Bid Closing
❏ Technical Bid Evaluation / Tabulation
❏ Updated Material Requisition
❏ Purchase Order
❏ Vendor documentation
❏ Fabrication Work Commence
❏ Factory Acceptance Test
❏ Equipment Delivery along with ROS
❏ Others
Equipment Delivery along with ROS
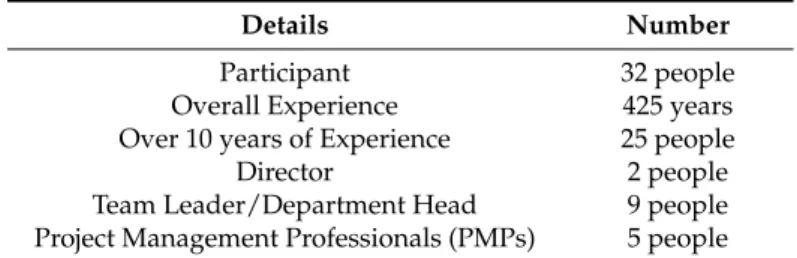
The expert survey was also used for data collection to weigh each element. Thomson [18] studied the optimum sample size for surveys or interviews and concluded it to be 25, from a review of over 100 studies using grounded theory. In this research, 32 survey participants were assigned for data collection to weigh each element. To collect a meaningful sampling group with over cumulative 400 years of experience in offshore oil and gas EPC projects, judgmental sampling and snowball sampling methods were used. Once again, random sampling might be more efficient to increase the representativeness of the population [17]. However, because of the limit on the availability of knowledgeable experts in the local industry from a practical point of view, judgmental and snowball sampling were used with various discipline experts invited in this research. On average, each expert participant has over 13 years of experience in detail design engineering or project management for offshore oil and gas EPC projects or over 10 years of experience in project management consultancy. Most of the survey participants were selected from two major EPC contractors (H company and S company in South Korea). To increase survey reliability, the expert survey was carried out using only face-to-face interviews. The information on the experience of the survey participants is shown in Table3.
Table 3.Experience Information of Participants for the DECRIS model.
Details Number
Participant 32 people
Overall Experience 425 years
Over 10 years of Experience 25 people
Director 2 people
Team Leader/Department Head 9 people
Sustainability2018,10, 2469 10 of 31
5.3. Step 3: Data Normalization
To determine the weight factor for each of the DECRIS elements using the data from the expert survey, data normalization, preliminary estimate, validation process, element average weight calculation, and interpolation were carried out. Excel software was used for data input and weight calculation and Statistical Analysis Software (SASTM) was utilized for statistical analysis of the data set. Upon collecting the data set from the expert survey, data normalization was carried out to normalize each survey participant’s input data.
The maximum DECRIS score is defined as 1000 as equivalent to PDRI maximum index score, when all elements in the DECRIS scoresheet were marked as Level 5 (as with the PDRI, DECRIS has five definition levels for each element with Level 1 being complete and Level 5 being incomplete). The scoresheet summation for 69 elements by 32 participants ranged from 262 to 620. Each participant’s scoresheet was given a normalizing multiplier, calculated as the maximum DECRIS score of 1000 divided by the sum of the answered scores for 69 elements (i.e., if a participant’s summation of 69 elements equated to 250, the scoresheet would receive a normalizing multiplier of four). The weight factor of each element was pre-estimated as an average value of the normalized weights of the 32 participants. The value was preliminary because the validation process had not yet been performed.
5.4. Step 4: Data Analysis
When sampling data do not comply with normal distribution, the inaccuracies of the result of regression analysis or independent samplingt-test increase. To enhance the similarity between the sampling data set and the normal distribution, a data validation process was carried out with a boxplot.
Using a data set of normalized element weight factors, the smallest data point, 25th percentile, median, 75th percentile, and largest data point were calculated and specified on a boxplot. AppendixA (FiguresA1–A3) illustrates the boxplots which indicates the distribution of participant response for the weight factor of each element including outliers for all 69 DECRIS elements. To secure reliability of the data set and similarity with normal distribution, number of extremes and outliers were collected from each participant, and the contribution score was calculated using Equation (1). The survey results with a high contribution score were eliminated [8].
Contribution score = 3×(number of extremes) + 1×(number of outlier) (1) Kline [19] suggested that, for a sampling data set which has an absolute value of skewness less than 3 and an absolute value of kurtosis less than 10, its population can be assumed to be distributed as normal distribution. To minimize the quantity of eliminated survey results while maintaining the normal distribution assumption, skewness and kurtosis calculation using SASTMwas repeatedly conducted. Consequently, survey results with a contribution score of over 80 were removed. The remaining survey data set has a skewness value of 2.02 and kurtosis value of 7.34 as the maximum value among 69 elements; the statistical result thus shows that the population of all 69 elements can be assumed as having a normal distribution. Through one sample t-test, individual elements were shown to be in favor of alternative hypothesis (|t| < 0.0001) and were statistically verified as elements that affect the detail engineering rating.
The basic relationship for each element was reviewed in the focus group workshop. The purpose of one sample t-test for individual elements is to verify whether the weight factor as a survey result can be considered as zero or not. If the previous workshop was well conducted, then expert participants may give the weight factor higher than zero. Unless most experts judged that each element did not affect the detail engineering completion, one sample t-test with zero basis for that element can be passed.
In this research, the measurement range of DECRIS was defined as a minimum of 70 to a maximum of 1000. This means that the DECRIS score is 70 when the level of all elements is Level 1 (i.e., all detail engineering deliverables are completed thoroughly without further need for action), and 1000 when all
![Figure 1. Profit losses of EPC Contractor (Modified from Press Release [5]).](https://thumb-us.123doks.com/thumbv2/123dok_us/1422838.2690427/3.892.207.688.131.350/figure-profit-losses-epc-contractor-modified-press-release.webp)