Title
method with application to pain prediction from EEG
Author(s)
Tu, Y; Hung, YS; Hu, L; Zhang, Z
Citation
The 7th International IEEE/EMBS Conference on Neural
Engineering (NER 2015), Montpellier, France, 22-24 April 2015. In
Conference Proceedings, 2015, p. 1004-1007
Issued Date
2015
URL
http://hdl.handle.net/10722/214828
Abstract—Dimension reduction is critical in identifying a small set of discriminative features that are predictive of behavior or cognition from high-dimensional neuroimaging data, such as EEG and fMRI. In the present study, we proposed a novel nonlinear supervised dimension reduction technique, named PCA-SIR (Principal Component Analysis and Sliced Inverse Regression), for analyzing high-dimensional EEG time-course data. Compared with conventional dimension reduction methods used for EEG, such as PCA and partial least-squares (PLS), the PCA-SIR method can make use of nonlinear relationship between class labels (i.e., behavioral or cognitive parameters) and predictors (i.e., EEG samples) to achieve the effective dimension reduction (e.d.r.) directions. We applied the new PCA-SIR method to predict the subjective pain perception (at a level ranging from 0 to 10) from single-trial laser-evoked EEG time courses. Experimental results on 96 subjects showed that reduced features by PCA-SIR can lead to significantly higher prediction accuracy than those by PCA and PLS. Therefore, PCA-SIR could be a promising supervised dimension reduction technique for multivariate pattern analysis of high-dimensional neuroimaging data.
I. INTRODUCTION
Pattern recognition techniques are increasingly used to extract relevant features from neuroimaging data, such as electroencephalography (EEG) and functional magnetic resonance imaging (fMRI), for the inference of internal states of neural systems. Multivariate pattern analysis (MVPA), which uses pattern classifiers to identify brain activation patterns corresponding to external stimuli or behavioral responses, has recently been extensively used in the analyses of neuroimaging data and has yielded many important results [1]. Most of neuroimaging data are naturally high-dimensional spanning multiple feature spaces such as time, frequency, and space, but the number of samples (i.e., subjects and experimental trials) is normally limited, which greatly hampers the performance of pattern recognition techniques [2]. Therefore, dimension reduction is critical in identifying a small set of discriminative features from high-dimensional neuroimaging data for higher prediction accuracy and better model interpretability.
*Research supported by a Hong Kong RGC GRF Grant (No.: 785913M). Yiheng Tu and Yeung Sam Hung are with the Department of Electrical and Electronic Engineering, The University of Hong Kong, Pokfulam, Hong Kong (e-mail: [email protected] and [email protected]).
Li Hu is with the School of Psychology, Southwest University, Chongqing, China (e-mail: [email protected]).
Zhiguo Zhang is with the School of Chemical and Biomedical Engineering and the School of Electrical and Electronic Engineering, Nanyang Technological University, Singapore (e-mail:
Conventional dimension reduction techniques used for neuroimaging data largely rely on unsupervised methods (such as principal component analysis [PCA]) [3] that work on unlabeled data only. Supervised dimension reduction methods (such as partial least squares [PLS]) [4] have been proved to outperform unsupervised methods, but most of them only consider a linear relationship between neuroimaging data and their class labels. However, in many neuroimaging studies, predictors (i.e., neuroimaging data) and their labels cannot be always fitted with a linear model. For example, amplitudes of laser evoked potentials (LEPs), which are important indicators of subjective pain perception, are nonlinearly associated with human subjective pain perception [5]. As a consequence, linear model based dimension reduction techniques cannot reduce the dimensionality along the most effective direction, which could heavily degrades subsequent prediction performance. Although some nonlinear supervised dimension reduction techniques, such as support vector machine (SVM) with recursive feature elimination (RFE) [6] and Gaussian process latent variable model [7], have been proposed for the analysis of genetic data or images, they are seldom used in neuroimaging study because of their high computational complexity or incapability to handle ultra-high dimensionality (much higher than the number of samples).
This paper is aimed to develop a novel nonlinear supervised dimension reduction technique, namely principle component analysis - sliced inverse regression (PCA-SIR), to deal with the nonlinear relationship between predictors and their labels. The PCA-SIR method is a cascade of an unsupervised PCA and a nonlinear supervised method SIR. SIR is capable of estimating an effective dimension reduction (e.d.r.) direction, along which the reduced data can well explain labels under the nonlinear relationship. SIR was proposed in [8] and since then it has found numerous successful applications, for example, in bioinformatics [9]. But SIR is not able to deal with the situations where the number of predictors is much larger than the number of samples, which is very normal in neuroimaging studies [2]. To address this problem, PCA is used prior to SIR to reduce the number of predictors so that the number of PCA-reduced predictors is smaller than the number of samples.
In this paper, the proposed PCA-SIR method is applied on single-trial EEG time courses for predicting the level of subjective pain perception (ranging from 0 to 10). PCA was first applied to extract principle components (PCs) accounting for the larger variance of predictors (single-trial EEG time courses after the onset of painful laser stimulus). Subsequently, SIR was performed on PCs to find the e.d.r. direction and obtain low-dimensional feature sets which contained the most predictive information. The level of subjective pain perception was then predicted using multivariate regression
PCA-SIR: A New Nonlinear Supervised Dimension Reduction
Method with Application to Pain Prediction from EEG
Yiheng Tu,
Student Member, IEEE
, Yeung Sam Hung,
Senior Member, IEEE
, Li Hu, and
Zhiguo Zhang,
Member, IEEE
from SIR-derived feature sets. The performance of PCA-SIR was evaluated with mean absolute error between true values and predicted values, and the results show that the proposed PCA-SIR can achieve significantly higher prediction than conventional dimension reduction techniques including PCA and PLS.
II. METHODS
A. Sliced Inverse Regression
For a regression problem, a general nonlinear model can summarize the relationship between observation yn1 (a
vector of n samples of behavioral or cognitive parameters in this study) and predictors xnp (a matrix of EEG time-course data with p time points for each observed sample) as:
) , ,..., , ( 1 2 k f y x x x . (1)
where s , s1,,k , are unknown vectors denoting the contribution of each predictors in x , k (k p ) is the dimension we aim to reduce x to, f() is an unknown nonlinear function of k inputs, and denotes zero- mean random noise independent to x. The general assumption of this model is the response y only depends on x via k linear combinations of predictors:
x x PS
y | , Sspan(1,..., k). (2) where PS denotes the projection operator onto the
k-dimensional subspace S. Therefore, we only need to estimate S generated by s to effectively reduce
dimensionality.
The e.d.r. space for (1) can be estimated by the SIR method by finding an inverse regression curveE(x|y). It was
proved in [8] that if x has been standardized to have zero mean and identity covariance, the inverse regression curve will fall into the e.d.r. space. SIR can estimate the inverse regression curve E(x|y) as the sliced mean value of x ,
which is obtained by slicing y into several groups and partitioning x into several slices according to values of y. Then, PCA is applied to sliced mean values of x to locate the
most important k-dimensional subspace for tracking the inverse regression curve. The SIR algorithm is detailed below. 1. Standardize x and estimate the sample mean
n i i n 1 1 xx and the sample covariance matrix
) ( ) ( 1 1 ˆ 1 x x x x x
i T n i i n .2. Bin y into m slices, G1,,Gm , and calculate the
proportion of yi that falls into sliceGj, j1,,m,
as ˆ 1 ( ) 1 j i n i j y n p
, where j(yi) equals 1 or 0 depending on whether yi falls into the jth slice or not.3. For each slice, calculate the sliced mean
j G i i j j p x x ˆ 1and weighted covariance
) ( ) ( ˆ ) 1 ( 1 ˆ 1 x x x x
j T j m j j W pn for the sliced
means.
4. Conduct a weighted PCA for ˆx and ˆW in the following way: ˆW ˆs ˆsˆ ˆs x , where k
1 2 . By solving this generalized eigen-decomposition problem, SIR directions ˆs can
be estimated.
In Step 2 and 3, we can obtain the estimates of standardized inverse regression curve E(x|y). It should be noticed that we only need to transform sliced Gj to xj
before PCA, rather than to transform all xi. In [8], it was
shown that the number of slices normally would not significantly affect the output estimates. For a classification problem, it is also suggested that the number of slices, be equal to the number of classes.
B. PCA-SIR
SIR requires the number of observations n to be greater than the number of predictors p, which heavily limits its applicability in the analyses of high-dimensional neuroimaging data. When n < p, ˆx is singular, and therefore the solution to the eigen-decomposition is not unique [8]. To address this problem, we proposed to use PCA for an unsupervised dimension reduction before SIR.
In PCA-SIR, PCA first pre-processes standardized x to find l principle components (PCs), which account for the majority of the variance of x. The concatenation of l PCs is denoted as Lnl (of which each column is a PC), and the
covariance matrix Lnl, ˆL, is a full-rank matrix. SIR then is performed on L to find the e.d.r. direction, and projects l-dimensional PCs to k-dimensional subspace. Consequently, the resultant PCA-SIR method can handle classification and regression with n < p, and can also be effective for highly correlated predictors.
C. Reconstruction of Regression Coefficients
The SIR-derived feature set, Snk is used in the
multivariate regression model, and results regression coefficientsk1. To reconstruct the regression coefficients to
the original domain (before SIR and PCA),
1. The regression coefficients for Lnl, is obtained by 1
1
l k k
l
.
2. Lnl is obtained by singular value decomposition
(SVD), xUΣVT, where n n U is a unitary matrix, l n
Σ is a diagonal matrix with non-negative real
numbers on the diagonal, and Vpl is a unitary matrix. Here LnlUΣ.
3. Regression coefficients for xnp is obtained by
1
1
p l l
p V θ
.
III. EEGEXPERIMENTS AND DATA ANALYSIS
In this study, we applied PCA-SIR onto EEG data, which are high-dimensional (with 500 data samples) in the time domain, to perform a regression task. The proposed method reduced the dimensionality of input predictors (EEG samples) and the new feature space was used predict subjective pain perception. The prediction performance was compared between PCA-SIR and two other methods, PCA and PLS, to demonstrate the effectiveness of the proposed method. A. Experiments
The analyses of this study were performed on the dataset collected for a previous study [10]. Ninety-six subjects (51 females, aged 21.6 ± 1.7 years) participated in the experiment. All subjects gave written consent forms and committed by local ethics committee. A total of 40 laser pulses, 10 for each of stimulus energies (E1: 2.5J; E2: 3J; E3: 3.5J; E4: 4J), were delivered in a pseudorandom order on the dorsum of left hand. The interval between two consecutive trials varied from 10 to 15 s. Subjects were prompted to rate the intensity of pain perception (rating) using a visual analogy scale (VAS) from 0 (no pain) to 10 (pain as bad as it could be). More experimental details can be found in [10].
EEG data were continuously recorded using 64 channels according to the international 10-20 system with a sampling rate of 1 kHz, using the nose as a common reference (Brain Products GmBH, Munich, Germany). To monitor the eye blinks and ocular movements, electrooculographic signals were also recorded.
B. EEG Data Analysis
EEG data were bandpass filtered (1 – 30 Hz) and trials with artifacts >100 µV were removed. Continuous data were segmented into 1000 ms epochs (with a length of 500 ms and 500 ms for pre- and post-stimulus interval respectively) and baseline corrected using pre-stimulus interval (-500 – 0 ms). An infomax Independent Component Analysis was used to correct trials contaminated by eye-blinks and movements. C. PCA-SIR Analyses
The relationship between EEG time courses and subjective pain perception is described by the model (1). More precisely, the predictors x are LEPs (EEG time courses between 0 – 500 ms), the responses y is the subjective pain reports, and is the model coefficient of the LEPs at each time point. Since LEP showed maximal effects at the central somatosensory region, EEG at the Cz electrode was used for the prediction task.
We first performed PCA on x and found l components accounting for 90% variancex. SIR was then applied to the
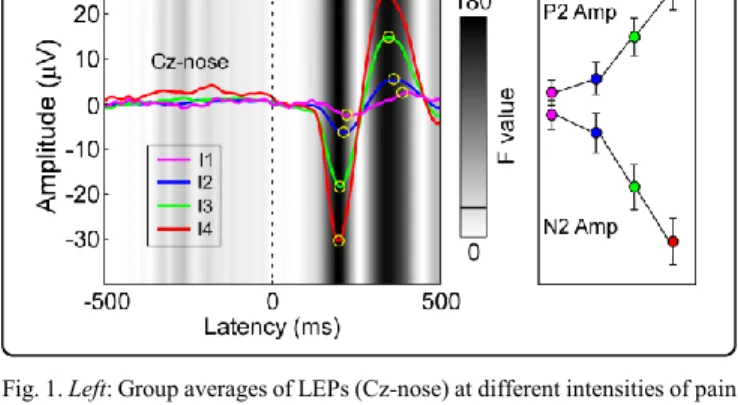
Fig. 1. Left: Group averages of LEPs (Cz-nose) at different intensities of pain perception (I1-I4). Yellow circles point out N2 and P2 peaks. Grey scale represents the statistical difference (F-values) between different intensities of pain perception for each time point using one-way repeated measures ANOVA. Right: Amplitudes of N2 and P2 peaks at different intensities of pain perception. Error bars represent standard error of the mean (SEM).
principle component matrix L to find the e.d.r. directions along which were the linear combinations of PCs with most predictive power to Y. The number of slices used in SIR was selected as 4.
D. Pain Prediction
In this study, we tested the performance of PCA-SIR by using the reduced features from PCA-SIR to quantitatively predict subjective pain perception. After using PCA-SIR to project L to the new e.d.r. space, new features were retained to predict subjective pain perception using a multivariate regression model. For each subject, leave-one-out- cross-validation (LOOCV) strategy was used to estimate the prediction accuracy. More precisely, e.d.r. directions were first trained with LEPs and corresponding subjective pain ratings in training trials and then applied to the test trial to predict subjective pain perception. The prediction performances were measured by mean absolute error (MAE):
T t t t R R T MAE 1 ˆ 1 . (3)where Rt and Rˆtare the real and predicted intensity of pain
perception for tth trial and T is the number of trials of each subject.
We compared the performance of PCA-SIR with PCA and PLS. For PCA, principle component matrix L was selected as features for multivariate regression. PLS extracted the maximal covariance between the predictors (LEPs) and responses (subjective pain reports) by a small number of uncorrelated latent components. The number of latent components was estimated using the coefficient of determination [12], and latent components were used to predict pain perception using multivariate regression. The prediction performance among different dimension reduction techniques was compared using a one-way repeated-measures analysis of variance (ANOVA). When the main effect was significant, post hoc pairwise t-test was performed.
IV. RESULTS
A. Behavior
Fig 1 (left) showed the group-level average LEP waveforms at Cz for each level of pain perception intensity (I1: 0 < rating ≤ 2.5; I2: 2.5 < rating ≤ 5; I3: 5 < rating ≤ 7.5; I4: 7.5 < rating ≤ 10). Significant difference in LEPs was observed between different intensities of pain perception, indicating LEPs were strongly modulated by intensities of pain perception. As seen from Fig. 1 (right), N2 and P2 amplitudes were nonlinearly correlated with pain perception. B. Pain Prediction
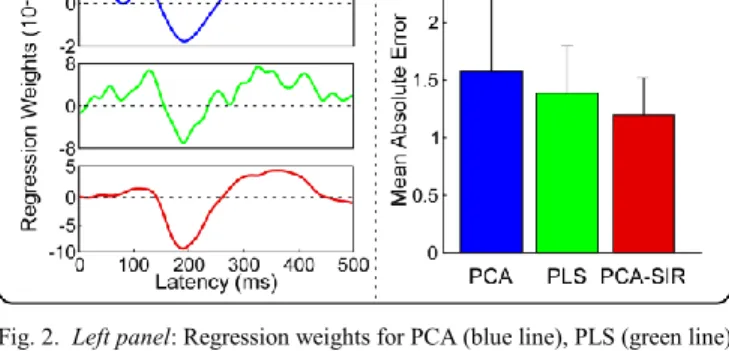
Fig. 2 (left panel) showed group averaged regression weights for different methods. PCA-SIR obtained smooth results and captured the larger contributions of N2 and P2 components. Regression weights in time range that was not significantly correlated with pain perception (e.g. 0 – 100 ms) were close to zero. In contrast, PCA and PLS cannot obtain very satisfactory regression weights. For example, although both of them captured the contributions of N2 and P2 components, regression weights in other time ranges (e.g. 0 –
100 ms) were different from zero, which would cause bias in the prediction.
Fig. 2 (right panel) summarized the prediction performance (measured by MAE) after dimension reduction by three methods: PCA, PLS, and PCA-SIR. PCA, PLS and PCA-SIR achieved prediction performance with MAE (mean ± STD) of 1.57 ± 0.69, 1.38 ± 0.41 and 1.18 ± 0.32, respectively. One-way repeated measures ANOVA revealed significant difference in MAE using three methods (F(2,94) = 25.00, p < 0.001). Post hoc pairwise t-test showed, our proposed method, PCA-SIR, provided the best prediction performance, which is significantly better than those of PCA and PLS (p < 0.001 for both comparisons). In addition, as a supervised linear dimension reduction method, PLS achieved significantly better results than PCA (p < 0.001).
V. DISCUSSION AND CONCLUSION
Dimension reduction is of great importance to extract meaningful neural features and to predict mental states or behavior responses from high-dimensional neuroimaging data. Effective dimension reduction can remove redundant predictors as well as noise, and thus enhances the prediction performance. In the present study, we proposed a new supervised nonlinear dimension reduction approach, namely PCA-SIR. By incorporating PCA with SIR, the proposed method can deal with the high dimensional neuroimaging data based on nonlinear model. Experimental results on 96 subjects showed that the PCA-SIR provided significantly improved performance in pain prediction from EEG time-course data than unsupervised dimension reduction method (PCA) and supervised linear dimension reduction method (PLS). Besides, PCA-SIR had smooth and accurate estimates of regression weights for predictors, which indicated its superior capability to extract predictive neural activities. Therefore, PCA-SIR could be a promising dimension reduction technique for MVPA of neuroimaging signals.
Fig. 2. Left panel: Regression weights for PCA (blue line), PLS (green line) and PCA-SIR (red line). Right panel: Prediction performance (measure by MAE) using different methods. Asterisks point out pairs with significant difference (p < 0.001).
PCA-SIR can be improved in two different aspects in the future research. First, PCA-SIR can be applied to characterize the structure of the neural code from high-dimensional neural signals spanning different domains and from different modalities so that we can better measure where and how strongly the mental states or behavior responses are represented in the brain. Second, SIR may fail to capture the intrinsic dimension or either estimate a high-dimensional e.d.r. space when the neuroimaging data are concentrated on a nonlinear low-dimensional manifold [9], [12]. Incorporating kernels and regularization techniques may be useful in estimating such as nonlinear e.d.r. space.
REFERENCES
[1] K. A. Norman, S. M. Polyn, G. J. Detre and J. V. Haxby, “Beyond
mind-reading: multi-voexl pattern analysis of fMRI data,” Trends Cogn. Neurosci., vol. 10, pp. 424–420, 2006.
[2] B. Mwangi, T, S. Tian and J. C. Soares, “A review of feature reduction techniques in neuroimaging,” Neuroinform., vol. 12, pp. 229-244, 2014.
[3] I. Jollffe, Principal Component Analysis, John Wiley & Sons, Ltd, 2005.
[4] A. Krishnan, L. J. Williams, A, R, McIntosh and H. Abdi, “Partial least
squares methods for neuroimaging: A tutorial and review,” NeuroImage, vol. 56, pp. 455-475, 2011.
[5] L. Hu, M. M. Cai, P. Xiao, F. Luo and G. D. Iannetti, “Human brain responses to concomitant stimulation of A and C nociceptors,” J. Neurosci., vol. 32, pp. 11439-11451, 2014.
[6] F. D. Martino, G. Valente, N. Staeren, J. Ashburner, R. Goebel and E.
Formisano, “Combining multivariate voxel slection and support vector
machines for mapping and classification of fMRI spatial patterns,” NeuroImage, vol. 43, pp. 44-58, 2008.
[7] X. B. Gao, X. W. Wang, D. C. Tao and X. L. Li, “Supervised gaussian process latent variable model for dimensionality reduction,” IEEE Trans. Syst. Man Cybern. B, vol. 41, pp. 425-424, 2011.
[8] K. C. Li, “Sliced inverse regression for dimension reduction,” J. Am. Statist. Assoc., vol. 86, pp. 316-327, 1991.
[9] W. Zhong, P. Zeng, P. Ma, J. S. Liu and Y. Zhu, “RSIR: regularized
sliced inverse regression for motif discovery,” Bioinformatics, vol. 21, pp. 4169-4175, 2005.
[10] L. Hu, P. Xiao, Z. G. Zhang, A. Mouraux and G. D. Iannetti,
“Single-trial time-frequency analysis of electrocortical signals:
Baseline correction and beyond,” NeuroImage, vol. 84, pp. 876-887, 2014.
[11] R. G. D. Steel, J. H. Torrie, D. A. Dickey, Principles and Procedures of Statistics: A Biometrical Approach, New York: McGraw-Hill, 1980. [12] L. X. Zhu and K. T. Fang, “Asymptotics for kernel estimate of sliced
inverse regression,”Annals of Statistics, vol. 24, pp. 1053-1068, 1995.