to Guide Refactoring of
Object-Oriented Classes
by
Keith Cassell
A thesis
submitted to the Victoria University of Wellington in fulfilment of the
requirements for the degree of Doctor of Philosophy
in Computer Science. Victoria University of Wellington
Much of the cost of software development is maintenance. Well structured software tends to be cheaper to maintain than poorly structured software, because it is easier to analyze and modify. The research described in this thesis concentrates on determining how to improve the structure of object-oriented classes, the fundamental unit of organization for object-oriented programs.
Some refactoring tools can mechanically restructure object-oriented classes, given the appropriate inputs regarding what attributes and methods belong in the revised classes. We address the research question of determining what belongs in those classes, i.e., determining which methods and attributes most belong together and how those methods and attributes can be organized into classes. Clustering techniques can be useful for grouping entities that belong together; however, doing so requires matching an appropriate algorithm to the domain task and choosing appropriate inputs.
This thesis identifies clustering techniques suitable for determining the redistribution of existing attributes and methods among object-oriented classes, and discusses the strengths and weaknesses of these techniques. It then describes experiments using these techniques as the basis for refactoring open source Java classes and the changes in the class quality metrics that resulted. Based on these results and on others reported in the literature, it recommends particular clustering techniques for particular refactoring problems.
These clustering techniques have been incorporated into an open source refactoring tool that provides low-cost assistance to programmers maintaining object-oriented classes. Such maintenance can reduce the total cost of software development.
I thank all of the people who have been supportive during my PhD study. I especially want to thank my advisors, Peter Andreae and Lindsay Groves, who have been extremely helpful in getting me to think and write like an academic. They have altered my way of looking at things, for the better. Similarly, I appreciate James Noble’s assistance in helping me to learn to see past peripheral issues to get at the essence of the problem.
Finally, I would like to thank Sally. Not too many people are lucky enough to have a partner who is willing to sell her house, leave her family, travel across the world, and get a job, so her husband can be student. I am blessed.
1 Introduction 1
1.1 Motivation and context . . . 1
1.2 Objective . . . 4
1.3 Approach . . . 5
1.3.1 Identifying problematic classes . . . 6
1.3.2 Proposing refactorings . . . 8
1.3.3 Performing refactorings . . . 9
1.3.4 Evaluating results . . . 9
1.3.5 Visualizing refactoring . . . 9
1.4 Contributions . . . 10
1.5 Organization of the thesis . . . 10
2 Evaluating the Quality of Classes 12 2.1 Background – object-oriented software metrics . . . 13
2.1.1 Class size . . . 14
2.1.2 Intraclass complexity – WMC . . . 14
2.1.3 Intraclass complexity – cohesion . . . 14
2.1.4 Interclass complexity – coupling . . . 24
2.2 Related work – detecting bad smells . . . 25
2.2.1 Detecting feature envy . . . 26
2.2.2 Identifying large (god) classes . . . 26
2.2.3 Determining thresholds of smell detection . . . 27
2.3 Analysis of existing cohesion metrics – sources of failure . . . 28
2.3.1 Example noncohesive classes – PersonCars . . . 29
2.3.2 Illusory cohesion . . . 31
2.3.3 Hidden cohesion . . . 33
2.4 A technique for improving structural cohesion metrics . . . 40
2.4.1 Approach – restructuring graphs . . . 40
2.4.2 Cohesion metrics – modified implementations . . . 41
2.4.3 Cohesion metrics – input restructuring experiments . . . 43
2.4.4 Cohesion experiments – conclusions . . . 47
2.5 Metrics and refactoring . . . 48
2.5.1 Metrics as quality measurements . . . 48
2.5.2 Metrics as hint providers for clustering . . . 49
2.6 Summary of contributions . . . 50
3 Background – Refactoring and Clustering 51 3.1 Refactoring . . . 51
3.1.1 Terminology . . . 52
3.1.2 Refactoring using automated tools . . . 53
3.1.3 Refactoring class structures . . . 54
3.2 Clustering . . . 59
3.2.1 Refactoring based on clustering . . . 62
3.2.2 Evaluating the results of refactoring based on clustering . . 64
3.3 Summary . . . 66
4 The Refactoring Environment 67 4.1 Identifying problematic classes . . . 69
4.2 Visualizing classes . . . 70
4.3 Proposing refactorings . . . 71
4.4 Performing refactorings . . . 72
4.5 Contribution Summary . . . 74
5 Refactoring Using Distance-Based Clustering Techniques 75 5.1 Background – distance-based clustering . . . 75
5.1.1 Entity representation . . . 76
5.1.2 Similarity and distance functions . . . 77
5.1.3 Agglomerative clustering . . . 78
5.1.4 Partitional clustering . . . 82
5.2 Related work – applying distance-based clustering to software . . . 84
5.2.1 Modularization . . . 85
5.2.2 Moving attributes and methods . . . 87
5.2.3 Extracting classes . . . 91
5.3 Test suite experiments . . . 96
5.3.1 Refactoring based on structure . . . 98
5.3.2 Refactoring based on semantics . . . 103
5.4 Open source studies . . . 107
5.5 Visualizing agglomerative clustering . . . 114
5.6 Evaluation of distance-based techniques . . . 118
5.6.1 Evaluation of agglomerative techniques . . . 119
5.6.2 Evaluation of k-means and k-medoids . . . 122
5.7 Contribution summary . . . 122
6 Refactoring Using Graph-Based Clustering Techniques 124 6.1 Background – graph-based clustering . . . 125
6.1.1 Splitting a minimum spanning tree . . . 125
6.1.2 Betweenness clustering . . . 126
6.1.3 Max flow/min cut . . . 128
6.2 Related work – applying graph-based clustering to software . . . . 129
6.2.1 Modularization . . . 129
6.2.2 Extracting classes . . . 130
6.3 Experiments – applying betweenness clustering to Java classes . . . 131
6.3.1 Visualizing betweenness clustering . . . 132
6.3.2 Refactoring god classes using betweenness clustering . . . . 137
6.3.3 Using betweenness clustering on directed graphs . . . 146
6.4 Evaluation of graph-based clustering techniques . . . 146
6.5 Contribution summary . . . 148
7 Refactoring Using Multiple Clustering Techniques 150 7.1 Related work . . . 150
7.2 Refactoring god classes using dual clustering . . . 152
7.2.1 Dual clustering approach . . . 152
7.2.2 Case study . . . 153
7.2.3 Experiments on open source god classes . . . 158
7.3 Evaluation of refactoring using dual clustering . . . 162
7.4 Contribution summary . . . 162
8 Conclusions and Future Work 163 8.1 Contribution review . . . 163
8.3 Future work . . . 167
8.3.1 Cohesion metrics – comparative study and sensitivity analysis168 8.3.2 Handling inheritance . . . 168
8.3.3 Additional applications of clustering algorithms . . . 169
8.3.4 Adding domain knowledge . . . 172
8.4 Conclusions . . . 174
Appendices 176 A Test Suite Source Code 177 A.1 AnonymousPersistence . . . 177
A.2 PersonCarDisjoint . . . 182
A.3 PersonCarDirect . . . 185
A.4 PersonCarIndirect . . . 188
A.5 PersonCarSpecial . . . 191
B Open Source Repositories 196 B.1 Refactoring environment . . . 196
B.1.1 Plug-ins . . . 196
B.1.2 Libraries . . . 197
B.2 Open source test classes . . . 198
B.2.1 Qualitas Corpus . . . 198 B.2.2 FreeCol . . . 198 B.2.3 Heritrix . . . 199 B.2.4 Jena . . . 200 B.2.5 JHotDraw . . . 200 B.2.6 Weka . . . 200 C Experimental Data 202 C.1 Preferences . . . 202 C.2 Agglomerative clustering . . . 202 C.2.1 Cluster counts . . . 203 C.2.2 Cluster sizes . . . 206 C.3 Betweenness clustering . . . 220 C.3.1 Cluster sizes . . . 220 C.3.2 Non-cohesion metrics . . . 220 C.3.3 Cohesion metrics . . . 224
C.4 Dual clustering . . . 228
C.4.1 Preferences . . . 228
C.4.2 Non-cohesion metrics . . . 228
C.4.3 Cohesion metrics . . . 232
1.1 Extracting a class using an IDE . . . 4
1.2 Locating classes using metrics . . . 6
1.3 Visualizing a class using a graph . . . 7
1.4 Identifying clusters of members . . . 8
2.1 MetricDiscriminator source code . . . 16
2.2 MetricDiscriminator intraclass relationships . . . 16
2.3 Cohesion graph variations . . . 20
2.4 PersonCar variations . . . 30
2.5 Constructor removal in XMLElement . . . 32
2.6 Example factory method . . . 32
2.7 Example use of an event listener . . . 37
2.8 Example use of reflection . . . 38
2.9 Reflection in DataGenerator (*TipText methods) . . . 39
3.1 Client with original PersonCarDirect . . . 55
3.2 Original AutoRegistration source code . . . 56
3.3 AutoRegistration.registerCar after a loose Move Method . . . 56
3.4 PersonCar.setVin after a strict Move Method . . . 57
3.5 AutoRegistration source code after loose refactoring . . . 58
3.6 Client with PersonCarDirect after loose refactoring . . . 58
3.7 Client with PersonCarDirect after strict refactoring . . . 60
3.8 PersonCar.setVin after strict refactoring . . . 60
3.9 Clustering of mammals . . . 61
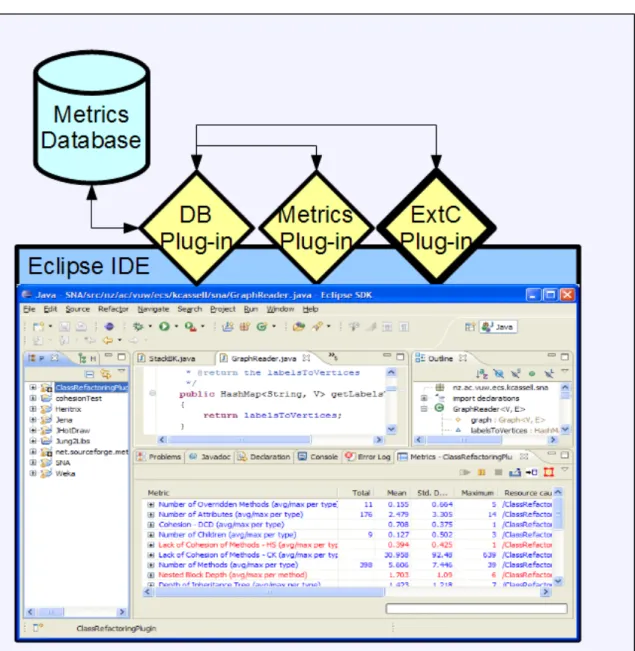
4.1 The ExtC refactoring environment . . . 68
4.2 ExtC metrics view . . . 69
4.3 ExtC graph view . . . 71
4.4 ExtC agglomeration view . . . 72
5.1 Agglomerative clustering . . . 80
5.2 Spatial clusters . . . 84
5.3 saveToDB method . . . 86
5.4 AnonymousPersistence intraclass dependency graph . . . 97
5.5 PersonCarDisjoint intraclass dependency graph . . . 98
5.6 Clusters produced – JDeodorant’s 2011 distance function (single link)100 5.7 Agglomerative Clustering – SIM01 . . . 102
5.8 Single link agglomerative clustering of PersonCarSpecial (structure) 104 5.9 Agglomerative clustering of PersonCarDisjoint (semantics) . . . 106
5.10 Agglomerative clustering of AnonymousPersistence (semantics) . . 107
5.11 CommandLine intraclass dependency graph . . . 109
5.12 Single link clustering of CommandLine (Sim01) . . . 110
5.13 Single link clustering of CommandLine (Nhood) . . . 111
5.14 Agglomerative clustering view . . . 115
5.15 Agglomerative clustering visualization . . . 117
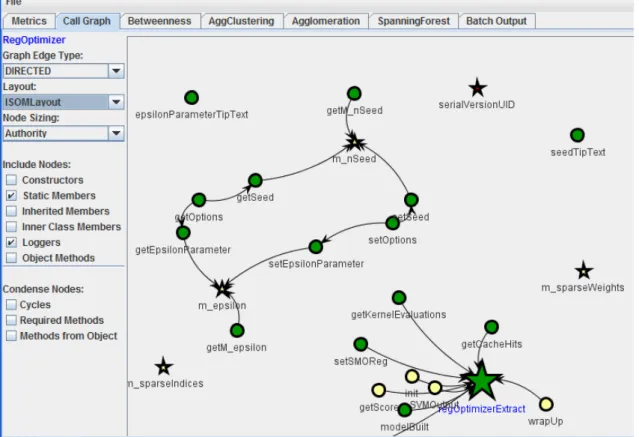
5.16 RegOptimizer dendrogram . . . 120
6.1 Minimal spanning tree – mammals . . . 126
6.2 Betweenness clustering – edge betweenness values . . . 127
6.3 Minimum cuts . . . 128
6.4 Betweenness view . . . 132
6.5 Betweenness clustering – PersonCarDirect before start . . . 133
6.6 Betweenness clustering – PersonCarDirect iterations 1 and 2 . . . . 134
6.7 Betweenness clustering views . . . 136
6.8 Betweenness clustering – Weka’s Script class . . . 138
6.9 Betweenness clustering with filtering – Weka’s Script class . . . 139
6.10 Cohesion distributions . . . 144
6.11 Betweenness clustering – XMLDocument . . . 145
6.12 Betweenness clustering on directed graphs . . . 147
7.1 RegOptimizer class after betweenness clustering . . . 154
7.2 RegOptimizer class after agglomerative clustering . . . 155
7.3 RegOptimizer class after dual clustering . . . 156
7.4 Source code for epsilonParameterTipText and listOptions . . . 157
7.6 Average cohesion values . . . 161 C.1 Number of clusters – agglomerative clustering, Sim01 . . . 204 C.2 Number of clusters – agglomerative clustering, Nhood . . . 205
2.1 Original, non-transformed cohesion measurements . . . 44
2.2 Weka cohesion measurement changes . . . 46
2.3 JHotDraw cohesion measurement changes . . . 47
5.1 Property sets used for extracting classes . . . 95
5.2 Test classes – clustering results . . . 99
5.3 Open source classes - median number of clusters . . . 108
5.4 Number of open source classes with 2 clusters of over 6 members . 108 5.5 Cohesion metrics - refactored CommandLine . . . 113
6.1 Average metric values (excluding cohesion) . . . 142
6.2 Cohesion measurements . . . 142
7.1 Average metric values (excluding cohesion) . . . 159
7.2 Cohesion measurements . . . 159
B.1 FreeCol test files . . . 198
B.2 Heritrix test files . . . 199
B.3 Jena test files . . . 200
B.4 Weka test files . . . 201
C.1 Sim01 – single link . . . 206
C.2 Sim01 – average link . . . 208
C.3 Sim01 – complete link . . . 211
C.4 Nhood – single link . . . 213
C.5 Nhood – average link . . . 215
C.6 Nhood – complete link . . . 218
C.7 Betweenness cluster sizes . . . 221
C.8 Betweenness clustering – non-cohesion metric results . . . 222
C.9 Betweenness clustering – cohesion results . . . 225
C.10 Dual clustering – non-cohesion metric results . . . 229
C.11 Dual clustering – cohesion results . . . 233
Introduction
1.1
Motivation and context
Software development is big business. While there is significant cost and effort spent preparing code for its release, several studies indicate that 40% - 65% of the to-tal effort is spent maintaining software after delivery [Han93, Pre97, Som96, YL94], and the maintenance is expensive. An estimate from the mid-1990s [Sut95] put the total cost of maintaining code in the United States at approximately 70 billion dollars per year. Numbers like these motivate us to try to decrease maintenance costs.
Maintainabilityrefers to the ease by which software can be modified [ISO06], where potential software modifications include bug fixes, feature additions, and adaptations of the software for different environments. Maintainability is affected by the software’s structure. Software that is modular and simple is generally easier to analyze and maintain than software that is poorly structured or complex. A programmer should be able to analyze well-structured code, understand its purpose, and improve it in a short time.
However, not all software “improvements” are worth doing. Every software change has a cost. In addition to the cost of programming the change, there are potential additional costs when the external behavior of a software component changes, e.g., updating test suites and documentation. Furthermore, any change to software entails risks – new bugs may be introduced, or the code may become less maintainable. Due to these issues, many software businesses prefer to be conservative when making code changes [Cor03]. The perceived benefit of a change must outweigh the perceived cost and risk.
Refactoring techniques are useful for making software more maintainable, while limiting the scope of potentially costly changes. Refactoring refers to changes that preserve the external behavior of code while improving its internal structure [Opd92, FBB+99]. Because refactoring maintains external behavior, it
lessens some of the associated costs of a code change, for example, the costs of changing client code, test suites, and documentation.
Modern integrated development environments (IDEs) [SDF+03, SFB06]
gen-erally provide tool support that helps programmers to quickly refactor their code once they have noticed a potential maintenance problem. The IDE can often determine whether a proposed refactoring is legal, determine additional code that might be affected by the change, and reliably change the specified code and its dependent code in a matter of seconds. This automated refactoring support generally reduces cost, because the programmer is freed from much of the required analysis, and reduces risk, because the automated refactoring tools have presumably undergone ample quality assurance testing prior to release.
Refactoring typically makes the code easier to understand, which facilitates future coding changes. Many people [FBB+99, Bec00, MB08a, Mar08] advocate
refactoring as part of a programmer’s daily coding routine. (Some go as far as to recommend that programmers “refactor mercilessly” [ACP+06]). The underlying
idea is to make incremental design improvements in the form of refactoring part of an evolutionary development process. By doing so, everyday development can proceed more smoothly, and the designated maintenance phase of development can be shortened. This underlying idea is often not realized, and software maintainability problems persist into the maintenance phase of the software life cycle.
Refactoring is also useful in the maintenance phase. As with other designated maintenance activities, there are typically several steps involved – a programmer must identify a potential problem, determine how to fix it, and then implement a solution. The problem of locating maintenance problems amenable to refactoring is an ongoing effort, and numerous researchers [FBB+99, DBDV04, LM06,
MB08b] have suggested ways of identifying problematic code (a.k.a. “bad smells” [FBB+99]). How to perform the second step is even less clear-cut. For some
refactorings, determining how to fix the problem is trivial; for others, only high-level advice exists. The third step, implementing the solution, has been aided by a number of integrated development environments whose “automated refactoring” tools provide a mechanism for mechanically altering source code, given the
appropriate inputs. Here too, the state of the practice is varied – some refactorings are widely implemented and robust, while more complicated refactorings may not have robust implementations (or any implementation at all).
Because object-oriented programming is one of the most popular programming paradigms of today [Lan11], this thesis concentrates on refactoring techniques for object-oriented programs. One of the less mature areas in refactoring is how to reorganize the class structure of object-oriented programs. For object-oriented languages like Java, C++, and C#, the fundamental organizational units are classes, and one of the most important things for creating and maintaining code written in object-oriented languages is getting the classes “right”. Yet, although there is high-level guidance on how to design good classes [CY91, Rum96, Mar08], problematic classes persist.
Much of the high-level guidance for creating good classes pertains to having clear-cut divisions of responsibilities between classes. “One class, one responsibility” is a common refrain [Mar08], and there are a variety of pejorative terms that refer to classes where the division of responsibilities is not clear-cut, e.g., “blobs” [MHVG08], “god classes” [LM06, WL08], and “spaghetti classes” [BCM+96]. All of the bad smells below indicate problems with dividing
responsibilities between classes. For each of them, Fowler’s book [FBB+99]
provides some high level strategic advice about how class structures should be modified by refactoring, e.g.:
1. Large class – Large classes that perform too many functions can be divided into smaller ones, e.g., via the Extract Class refactoring (described in Section 3.1.3).
2. Data Clumps – Groups of attributes (a.k.a. fields) that repeatedly show up together in multiple classes can be grouped as the basis for a class, e.g., via theExtract Classrefactoring.
3. Feature envy – Classes with inappropriate functionality can have that functionality moved to other classes, e.g., via the Move Method and Move Fieldrefactorings (described in Section 3.1.3).
The common theme for these refactorings is to put closely related class members (attributes and methods) together in the same class and less closely related members1in different classes.
1This thesis uses the shorter term “members” instead of “class members” to refer to the attributes
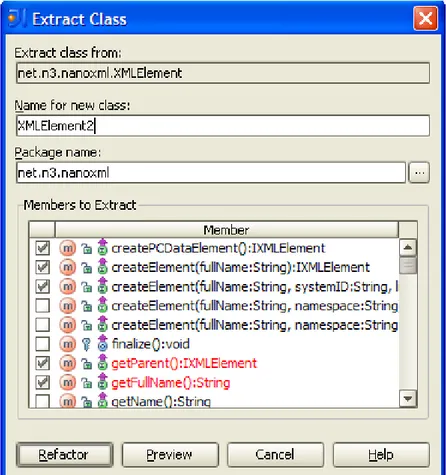
Figure 1.1: Extracting a class using an IDE
Unfortunately, such strategic refactoring advice generally lacks detail about what needs to be done to effect a solution. For example, Figure 1.1 shows how one IDE determines how to perform theExtract Classrefactoring – by the user entering the class members that should be moved to the new class. However, it is up to the user to determine which members are to comprise the revised classes. This is difficult when a class can consist of over a hundred members.
1.2
Objective
The objective of this research is to develop techniques that can improve the maintainability of object-oriented classes by supplying the necessary detail on how the class members should be reorganized. Given such input, programmers can restructure code either using “automated” refactoring tools provided by popular IDEs or manually. From our point of view, it would be ideal if programmers
could easily identify difficult-to-maintain classes, and based on input supplied by our techniques, easily refactor those classes into ones that were less expensive to maintain.
1.3
Approach
If there were sufficient knowledge of what constitutes good class structure, restructuring classes would be relatively easy. For example, one could construct a “class structure evaluation function” and then use “generate and test” techniques to create potential class structures to maximize the result of the evaluation function [SSB06]. Unfortunately, such comprehensive knowledge about class structure does not exist, so a more exploratory approach is indicated. An exploratory refactoring environment helps researchers determine how to refactor classes based on existing ideas of what constitutes good classes, and also helps them discover additional characteristics of classes and their relationships that may be useful for refactoring.
An interactive class refactoring environment should help with each of the following tasks:
1. Identifying classes that violate guidelines concerning class structure. 2. Proposing potential refactorings that address these violations.
3. Performing the refactorings.
4. Evaluating the results of the refactorings.
5. Visualizing the classes before, during, and after refactoring.
The refactoring environment I created for my research concentrates on (2), but makes contributions to (1), (4), and (5) as well. In principle, the first four tasks could be completely automated, with the output of one task serving as the input to the next one. In practice, however, we prefer an interactive approach, where the environment provides helpful input to the programmer, rather than programmatically making decisions and executing them.
There are many reasons to prefer an assistive, interactive approach to an automated one [Cor03]. In our case, there are two main ones:
1. The state of the art for refactoring class structure is not sufficiently mature to trust automated results.
2. There are many potential programming styles, each of which has advantages in certain circumstances. A completely automated approach is unlikely to be sufficiently flexible to satisfy users.
Chapter 4 discusses theExtC(ExtractClass) refactoring environment I created, including details of user interfaces. The following subsections describe our approach to the five refactoring subtasks above.
1.3.1
Identifying problematic classes
Figure 1.2: Locating classes using metrics
Object-oriented software metrics can help programmers detect poorly struc-tured classes that are too large, too small, or have poor distribution of methods and attributes across the class hierarchy [LM06, CK94, Hen96, CLM06]. Of particular
interest are metrics that measure a class’s cohesion (how well the members of a class work together) and those that measure coupling between classes (the degree to which classes rely on other classes). Both cohesion and coupling have been shown to correlate with maintainability [ASKM07, DJ03, CDK98]. In general, one wants to maximize cohesion and minimize coupling [CK94].
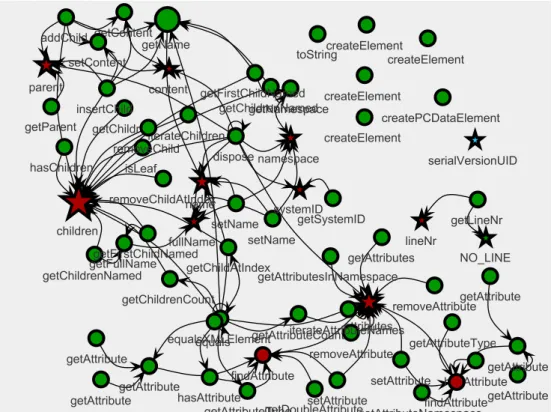
We provide programmers the capability of constructing metric-based queries to locate potentially troublesome classes. Figure 1.2 shows a user interface containing a user-composed query and a table of matching classes and their metric values. These classes can then be examined in a source editor or with a graph-based visualization that shows their internal structural dependencies. Figure 1.3 shows a visualization of one of the identified large classes, which shows the methods, attributes, and certain relationships between them. In this thesis, we will generally illustrate relevant points using graphs instead of the actual code. This tends to be both clearer and more concise.
1.3.2
Proposing refactorings
This thesis explores how a variety of clustering techniques can be applied to creating higher quality classes. Clustering techniques [JMF99, Ber02, Sch07] group together related entities into clusters. In the context of correcting poorly designed classes, the entities to be clustered consist of the members of the classes. The clustering algorithms use information about the affinity of the members to determine which members most belong together in classes.
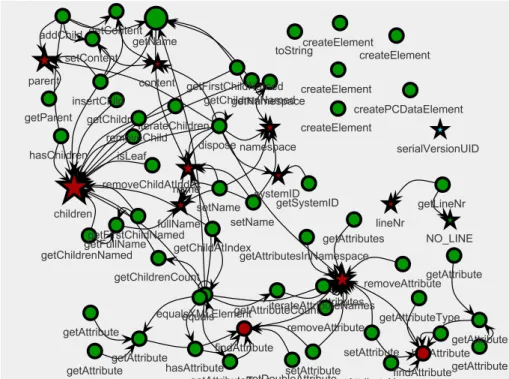
Figure 1.4: Identifying clusters of members
Some of these clustering techniques work by determining similarities between entities. Others, derived from social network analysis, form clusters based on patterns of communications between entities as shown in Figure 1.4. (Textual identification of the group members is on the left, and a graph-based visualization is on the right.) Still others work by evaluating the “semantic” content contained in the classes. The class members within the clusters produced from these techniques can serve as inputs to automated refactoring tools as shown in Figure 1.1.
1.3.3
Performing refactorings
Until relatively recently, almost all code changes were performed manually by programmers. Beginning in the 1990s, integrated development environments have been providing an increasing amount of semi-automated refactoring capability, and some of these IDEs offer application programmer interfaces (APIs) for refactoring [Wid06, Jem08]. Our research makes heavy use of existing capabilities to restructure classes, but does not implement any new refactorings.
1.3.4
Evaluating results
Evaluating the effects of refactoring on maintainability can be difficult and expensive. Because this is impractical for the scope of this thesis, we use several software metrics that may correlate with maintainability [LH93, BBD01] to evaluate the effectiveness of the refactorings.
There are some difficulties with using software metrics to measure the quality of software. While there is general agreement on some high-level principles (e.g., high cohesion and low coupling are desirable [HM95]), there are seldom specifics (e.g., what cohesion values indicate acceptable class structure). Furthermore, there are no studies that we know of that indicate acceptable trade-offs between various metric values. For example, what should happen when one metric shows improvement (e.g., cohesion increases) while another metric shows degradation (e.g., coupling also increases)?
Another possibility is to have programmers evaluate the results. This, too, is problematic. Many of the characteristics of programs that make them hard to maintain also make them hard to evaluate for improvement.
Given these difficulties, we use a multi-pronged approach to evaluating results. First, we collect and compare metric values from before and after any restructuring. Secondly, we evaluate our techniques relative to a test suite with known preferred outcomes. Finally, we provide visualizations that help programmers see the relationships between the members of classes, so that they can better compare classes before and after refactoring.
1.3.5
Visualizing refactoring
Complex object-oriented classes are difficult to analyze and understand, and therefore difficult to maintain. This same complexity also makes it difficult to see
how best to refactor them. We help with this problem by providing visualizations of the static structure of classes (as seen in Figure 1.3 and discussed in Section 4.2) and by providing visualizations of the clustering technique results (as discussed in Sections 5.5 and 6.3.1).
1.4
Contributions
The primary contribution of this research is the identification of the relative strengths and weaknesses of various clustering techniques for identifying groups of class members that can be used as the basis for refactoring object-oriented classes. To address some of the weaknesses of current approaches, we introduce two new techniques. The first, based on betweenness clustering [GN02, Bra01], determines clusters based on the communication patterns within a class. The second, dual clustering, determines clusters by sequentially using two complementary techniques – betweenness clustering based on structure and agglomerative clustering [Ber02, JMF99, WFH11] based on semantics.
In order to evaluate the use of clustering techniques in support of refactoring, it was helpful to build an exploratory environment in which problematic classes could be identified, examined, and repaired. This effort led to some additional contributions. In order to better identify problematic classes, we analyzed many cohesion metrics and their limitations. This led to the development of a technique to make certain structural cohesion metrics more accurate by eliminating specified class members and relationships from consideration, and including additional relationships in the calculations. This same technique is also useful for reducing noise in the inputs to clustering.
To help determine whether clustering was producing meaningful results, we created two novel visualizations of clustering acting upon class structure. In addition, we created a test suite of Java classes to use for the Extract Class
refactoring. Given these classes as inputs, one can determine whether tools produce the desired recommendations for refactoring.
1.5
Organization of the thesis
The thesis is organized as follows. The next chapter, Chapter 2, discusses how to evaluate the quality of object-oriented classes and concentrates on the use of
metrics, especially cohesion metrics. It goes into some detail on some of the weaknesses of the cohesion metrics, and also discusses a structural technique we use to improve them for use with refactoring.
The next two chapters cover common material useful for understanding Chapters 5 - 7. Chapter 3 provides general background information on refactoring and clustering, while Chapter 4 describes the refactoring environment in which the clustering and refactoring investigations took place.
Chapters 5 - 7 contain the bulk of the analysis and new work. These chapters discuss the utility of various clustering techniques for refactoring object-oriented classes. Chapter 5 discusses distance-based clustering techniques, such as agglomerative clustering and k-means [Har75, HW79, Ber02, JMF99]; Chapter 6 discusses graph-based clustering techniques, such as betweenness clustering and max flow/min cut [FF09]; and Chapter 7 discusses how combining multiple clustering techniques can aid refactoring. All three of these chapters follow a similar outline. They start with a background discussion of the clustering techniques and then describe prior work on applying clustering techniques to refactoring object-oriented systems. Next is a discussion of our contributions of applying the particular clustering technique towards refactoring, and an evaluation of the various approaches. Chapter 8 contains a review of the contributions of the thesis and discusses potential future work.
Evaluating the Quality of Classes
Our goal is to improve the structure of object-oriented classes to make them more maintainable. Given a sufficient description of the characteristics of good object-oriented classes, it should be possible to determine whether or not a class has those qualities.
Books often advise developers of object-oriented systems to create classes that represent single concepts [RBL+90] or have single responsibilities [Mar08],
and state that the members of a class should all work well together [BME+07].
However, as Booch, et al. [BME+07] point out, it is difficult to define a class
correctly the first time. Programmers can have different opinions about what constitutes a good class, because the concepts on which classes are based may be imprecise or overlapping, and there are subtleties that can affect the design, e.g., the desired granularity of the public interfaces to the class. There are additional constraints on design imposed by a desire to have maintainable classes, e.g., a class should be easy to analyze and change [ISO06, fS01].
These characteristics of a good object-oriented class are mostly based on the perceptions of the people using the class, and the degree to which a class possesses these characteristics will vary by individual. They are not easy characteristics to measure. These cognitive characteristics can be classified asexternal attributesof software, i.e., their measurement requires something in addition to the software itself. For example, measuring the analyzability of a class involves the software being analyzed, analysis tasks, and the humans performing the analysis.
Designing and executing experiments to measure cognitive abilities is difficult, due in part to the difficulty in determining the subjects’ thought processes, the many variables involved, and the difficulty in creating appropriate controls for
the variables being tested. Simpler attempts to measure cognitive characteristics of software also have drawbacks. For example, while it is possible to query many programmers about each class to determine whether the class had the desired characteristics, such an approach is expensive and generally impractical, due to the many programmers that need to be involved to make the results statistically significant.
It is generally easier and cheaper to measureinternal attributesof the software, i.e., measurements on the software itself. Some internal attributes that are frequently mentioned as desirable are small size, low coupling, low complexity, and high cohesion [CSC06, BBG08, DJ03, LH93, MPF08, ASKM07, CDK98]; however, it is worth noting that there is debate about whether these all correlate with maintainability [DJ03, EBGR01, BWZ02, BEGR00, SK03]. We use metrics based on internal attributes of the software to identify classes that may benefit from refactoring. Following refactoring, those same metrics are used to help evaluate the quality of the refactored classes relative to the original ones.
This chapter discusses how we attempt to measure the quality of object-oriented classes using internal attributes of the software. The chapter begins with a discussion of object-oriented software metrics, with an emphasis on class cohesion metrics. This is followed by a section on research that uses metrics to detect bad smells indicative of problem classes. Section 2.3 analyzes features of the Java language that can cause many cohesion metrics to give misleading results, while Section 2.4 discusses modifications we made to existing metrics to better handle those Java features, then discusses our experiments with the modified metrics to determine whether they helped to better identified flawed classes. The chapter concludes with an analysis of the use of metrics in the context of refactoring and a summary of our contributions.
2.1
Background – object-oriented software metrics
Software metrics can be used for many purposes, and particular metrics are better suited for some purposes than others. We are interested in using metrics to measure the quality of object-oriented classes – to help identify Java classes that are in need of refactoring and to help confirm that the classes’ quality has improved as a result of refactoring.
may correlate with maintainability. Many of these evolved from metrics that were used to help evaluate structured designs [YC79, SMC79] and were later adapted for the object-oriented paradigm [EKS94, CK91].
2.1.1
Class size
Intuitively, small classes should be easier to analyze and change than large classes, and several researchers have noted a correlation between class size and fault proneness [DJ03, EBGR01, LH93]. While measuring the size of software is a simple idea, there are several options of what can be measured – number oflines of code (LOC), number of methods, number of fields, etc. We most often use the total number of methods as a measure of an object-oriented class’s size, because this gives an indication of the number of high-level functions a class supports.
2.1.2
Intraclass complexity – WMC
Simple classes should be easier to analyze and change than complex classes. TheWeighted Methods per Class(WMC) metric combines both size and complexity. Chidamber and Kemerer [CK94] define the WMC as the sum of the complexities of a class’s methods. They deliberately do not define what constitutes the complexity of a method.
Several researchers [BLL09, CLM06, CAG11, LM06] use WMC with cyclomatic complexity [McC76] as the method complexity metric. Cyclomatic complexity measures the amount of logical branching (number of decision points) in a method. We also use WMC in combination with cyclomatic complexity to detect large, complex classes.
2.1.3
Intraclass complexity – cohesion
In general, cohesion refers to how strongly related the members of a group are. In structured design, cohesion refers to how closely related the processing elements in a module are [YC79]. In the most cohesive modules, the processing elements all pertain to the module’s single function. Slightly less desirable, but easier to recognize, are modules that are sequentially cohesive, where the output data from one processing element serves as input data for the next.
The ideas about cohesion from structured design were adapted for use in object-oriented design [EKS94, CK91]. For cohesion measurement purposes, the
classes, methods, and attributes in object-oriented design roughly correspond to the modules, processing elements, and data of structured design. Ideally, the methods and attributes in a class are closely related to each other, and this is reflected in their patterns of interaction. For object-oriented classes, the term
cohesionrefers to how well the attributes and methods of a class work together. Because cohesion is considered integral to good object-oriented design, there have been many attempts to measure it, both from a structural and from a conceptual point of view. There are over 40 different cohesion metrics in the literature (see Appendix D). Rather than attempt a detailed review, this section highlights cohesion metrics and principles that researchers have found useful relative to refactoring. See Briand, et al. [BDW97], for a more detailed overview of the early work on measuring object-oriented cohesion.
Structural cohesion metrics
Structural cohesion metrics measure relationships between various code constructs. We are most interested in metrics that measure the relationships among attributes and methods within a single class [CK94, BT07, BDW97, CKB00, EGF+04, Hen96,
HM95, ZLLX04], although some metrics measure the relationships between methods and parameters [BEDL99, CSC06], and others consider relationships to members of other classes [ML09, ML07]. Intraclass structural cohesion metrics analyze the structure of a single class’s code to calculate a cohesion score based on the degree to which a class’s methods access the other class members (e.g., attributes and methods). This is the largest class of cohesion metrics, presumably because measurements of the existing static interactions between class members is a logical indication of how much the members belong together.
As several authors [CKB00, HM95, ZLLX04, AD10] have noted, we can interpret many structural cohesion metrics in terms of graph analysis, where nodes in the dependency graph are methods or attributes, and edges indicate a method calling another method or a method accessing an attribute. The code in Figure 2.1 is a toyMetricDiscriminatorclass that will be used to show the differences between how various structural cohesion metrics calculate cohesion. Figure 2.2 is the correspondingintraclass dependency graph, where circular nodes representMetricDiscriminator’s methods, stars represent its attributes, and
the directed edges indicate methods calling methods or accessing attributes. In Figure 2.2, there is an arrow from m1 to m0, because the method m1 calls the
public c l a s s M e t r i c D i s c r i m i n a t o r { p r i v a t e i n t a1 , a2 , a3 , a4 = 4 , a5 ; public i n t m0(i n t i 1 , i n t i 2 ) { r e t u r n i 1 + i 2 ; } public i n t m1 ( ) { r e t u r n a1 = m0( a1 , 1 ) ; } public i n t m2 ( ) { a2 = a3 = 3 ; r e t u r n m0( a2 , a3 ) ; } public i n t m3 ( ) { r e t u r n a4 = a3 ; } public i n t m4 ( ) { r e t u r n a4 ; } public i n t m5 ( ) { r e t u r n a5 ; } public void m12 ( ) { m1 ( ) ; m2 ( ) ; } }
Figure 2.1: MetricDiscriminator source code
Figure 2.2: MetricDiscriminator intraclass relationships
methodm0, and there is an arrow fromm1toa1, because the methodm1accesses the attributea1.
LCOM
Chidamber and Kemmerer [CK94] thought that a well-designed class should have a set of attributes that are commonly used by the class’s methods. TheirLack of Cohesion in Methods (LCOM)metric compares the number of dissimilar pairs of methods to the number of similar pairs of methods, where two methods are similar if they each access a common attribute directly. If there is a greater number of similar methods than dissimilar methods, then LCOM is zero. Otherwise, LCOM equals the number of dissimilar pairs of methods minus the number of similar pairs of methods. A maximally cohesive class has an LCOM score of 0, as do some
other less cohesive classes. There is no upper bound on the scores of noncohesive classes.
In Figure 2.1, methods m2andm3are considered similar because they both
access attributea3, whereasm1andm2would be dissimilar, because they access
no common attributes. MetricDiscriminator has an LCOM score of 17, because (m2, m3) and (m3, m4) are similar, and the other 19 pairs of methods are dissimilar.
There are a number of problems with using LCOM to measure cohesion [HM95, BDW97, CKB00, ML06]. For example, many classes with varying degrees of cohesiveness can have an LCOM score of zero. Furthermore, LCOM is not a normalized metric. Because LCOM is measured based on the difference between the counts of dissimilar pairs of methods and similar pairs of methods, there is a correlation between the number of methods in classes and their LCOM scores. A relatively large LCOM score for a small class generally indicates a more disjointed class than that same score for a larger class. Despite its problems, LCOM has inspired a number of other cohesion metrics. In particular, many subsequent metrics also place primary importance on method-attribute interactions.
“LCOM*”
Henderson-Sellers’ enhancements to LCOM [Hen96] have been referred to by different names (LCOM* [BDW98, FPn06, BT07, SB10], LCOM3 [WZW+05],
LCOM5 [BDW97, AD10, CEJ06, BBG08, UFPG10], and LCOM-HS [LLL08]) by different authors. This thesis uses “LCOM*”, because that is the name used by the Metrics2 plug-in [SB10] that is part of our refactoring environment.
Henderson-Sellers wanted a lack of cohesion metric that was normalized to a range of 0.0 to 1.0, where 0.0 indicates perfect cohesion (every method accesses every attribute) and 1.0 indicates total lack of cohesion. LCOM* is defined as:
LCOM∗= 1 a Pa i=1n(Ai)−m 1−m (2.1)
whereais the total number of attributes,mis the total number of methods, and
n(A) is the number of methods that access attribute A. The LCOM* score for
“LCOM4”
Hitz and Montazeri’s enhancements to LCOM [HM95] have been referred to by different names (LCOM4 [BT07, CKB00, EGF+04], LCOM2 [WZW+05], and
LCOM3 [BDW97]) by different authors. This thesis uses “LCOM4”, in keeping with the majority.
Hitz and Montazeri take a graph-theoretic approach to cohesion. LCOM4
is defined as the number of connected components of an undirected intraclass dependency graph, so MetricDiscriminator has an LCOM4 value of 2.
Among LCOM4’s enhancements to LCOM is that it considers both direct and indirect access of methods to attributes. For example, LCOM4 considersm12and
m3to be similar, because they each access attributea3. Them12method accesses
a3indirectly throughm2, so the original LCOM would not considerm12andm3
to be similar.
There are several reasons for making indirect access from a method to an attribute within a class as important as direct access to an attribute. For example, consider a scenario where a class originally had a largem12that directly accessed a3. Later, a programmer refactors the large m12 method, so that it calls the extractedm2 method, which calls a3. The class has the same functionality as before theExtract Methodrefactoring, andm12is just as dependent ona3as it was originally.
LCOM4 is not normalized; it ranges from a maximal cohesion of one and has no upper bound on lack of cohesion. Because it is equivalent to the number of connected components of a graph, its definition of lack of cohesion appeals to those looking for classes that can be easily split.
TCC, LCC
The Tight Class Cohesion (TCC) and Loose Class Cohesion (LCC) metrics [BK95] measure the proportion of pairs of connected, visible instance methods to the maximum possible number of pairs of connected, visible instance methods, so TCC and LCC scores range from 0 (least cohesive) to 1 (most cohesive). TCC considers two methods to be connected when they both have paths to a common attribute following directed edges. Like LCOM4, TCC considersm12andm3to be
connected, because they both access attributea3either directly or indirectly. If one converts a directed dependency graph to an undirected one, LCC considers two methods to be connected if there is any path between them in
the undirected dependency graph that passes through one or more attribute nodes. In our example, LCC considersm2andm4to be connected, because both of them
are connected tom3(viaa3anda4respectively). The rationale behind this is that
the intermediary methods can pass values indirectly to the other methods via the attributes. In the example,m2sets the value ofa3;m3readsa3and setsa4, and
m4readsa4, som2can affect the output ofm4. Because this indirect connection exists,MetricDiscriminator’s LCC value (0.48) is greater than its TCC value (0.24). The LCC value will always be greater than or equal to the TCC value.
DCD, DCI
All of the previously mentioned cohesion metrics calculate cohesion based on some notion of connectivity between methods and attributes. Badri and Badri [BB04] point out that methods can be connected via access to common methods that do not necessarily access any attribute in the class.Degree of Cohesion Direct (DCD)and
Degree of Cohesion Indirect (DCI)are closely related to TCC and LCC respectively, but extend them, primarily by considering two methods to be connected if they access a common method either directly or indirectly, but also by considering static members. DCDand DCI scores range from 0 (least cohesive) to 1 (most cohesive).
DCIextends DCDsimilar to how LCC extends TCC. If one converts the directed dependency graph to an undirected one, DCI considers public methods to be connected if there is any path between the methods in the undirected dependency graph.
In the example of Figure 2.2, DCDand DCIconsider them1andm2methods to be connected, because they both use them0method. In contrast, TCC considers them to be unrelated, because they do not access a common attribute. (LCC considers m1 and m2 to be related via indirection through the method m12.)
Consequently, the DCD score (0.29) is slightly higher than the TCC score (0.24), while the DCIand LCC scores are the same (0.48). DCIconsiders them1andm3
methods to be connected, because both of those are connected tom2(viam0and
a3respectively), so the DCIscore is greater than the DCD score. The DCI value will always be greater than or equal to the DCD value.
CBMC, ICBMC
The metrics mentioned thus far base their calculations on the number of interactions between methods and attributes, but do not consider the pattern
of those interactions. Chae and his colleagues’ [CKB00]Cohesion Based on Member Connectivity (CBMC)cohesion metric considers the patterns of interaction based on a graph representation of the call pattern between methods and attributes.
They were motivated by what they perceived as deficiencies in some of the earlier approaches to measuring cohesion. Figure 2.3 illustrates the dependency graphs of four different classes, based on one of Chae’s examples [CKB00]. Although all four classes have the same number of methods and attributes, Chae contends that intuitively, cohesion increases going from classAto classD. While
A and B have the same number of attribute accesses, the graph of class A is
disconnected. While the dependency graphs of classesB-Dare all connected, the
number of edges increases, so cohesion should also increase. However, when they calculated cohesion for these classes using nine existing metrics (including the ones mentioned above), none of the metrics gave the expected behavior.1 Every metric showed at least two of the classes having the same cohesion value.
(a) Class A (b) Class B
(c) Class C (d) Class D
Figure 2.3: Cohesion graph variations
CBMC introduced a novel way of calculating cohesion, based on breaking apart a reference graph. Reference graphs are bipartite graphs consisting of nodes that represent methods or attributes. There is an edge between a method and an attribute if the method can access that attribute either directly or indirectly using other methods. CBMC breaks apart a reference graph by removing the nodes that
1Al Dallal [AD10] provides a larger set of dependency graphs that he uses to illustrate the lack
would most quickly fragment the graph into maximally connected components (MCCs), where an MCC is a graph where all of the method nodes are connected to all of the attribute nodes. Figure 2.3(d) is an MCC without the removal of any nodes, so it is maximally cohesive. The mechanism for calculating CBMC is complicated and can involve evaluating multiple alternatives for fragmenting the graph, so it will not be reproduced here.
Zhou, et al. [ZXZY02] noticed that there were some cases where CBMC calculated a higher cohesion score for a graph with fewer edges than a similar graph that was more densely connected. They eliminated this problem with their Improved CBMC (ICBMC) cohesion metric, which fragments the reference graph by removing edges rather than nodes. CBMC and ICBMC scores both range from 0 (least cohesive) to 1 (most cohesive).
Chae, et al. [CKB00] also made explicit the idea ofspecial methods, which are methods that should not be taken into account when calculating cohesion. Special methods are considered unrepresentative of the real purpose of the class and therefore serve as “noise” when trying to measure cohesiveness. Such methods include constructors, which access many attributes for initialization purposes, and accessors, which typically provide access to exactly one attribute but provide no behavioral logic.
Conceptual and semantic cohesion metrics
The ISO standard’s [ISO06, fS01] characteristics of maintainability (analyzability, changeability, etc.) are predominately semantic criteria. “Conceptual” and “semantic” metrics attempt to measure the software based on interpretations of the programmers’ intent based on word usage within the software [ED00, MP05, CEJ06, Etz06, MPF08, SDGP10, LPF+09, PM06, ED00]. Typically, these approaches
analyze the words that are embedded in the source code and associated comments, looking for overlapping meaning in different parts of the software.
Etzkorn [Etz06] uses semantic metrics to refer to metrics such as Logical Relatedness of Methods(LORM) [ED00] and Semantic Closeness from Disambiguity
(SCFD) [CEJ06], that measure software using knowledge-based natural language processing. These techniques are applied to identifiers and/or comments to see how close a class’s members are to each other conceptually. Etzkorn usesconceptual metricsfor metrics such asConceptual Cohesion of Classes(C3) [MP05] andConceptual Lack of Cohesion Between Methods(CLCOM5) [UFPG10], that rely on usage statistics
rather than some underlying knowledge base or dictionary. Because these terms are not always distinguished in the literature, and because they both analyze the content of identifiers and comments, we will generally use “semantic” and “conceptual” interchangeably.
The idea of using underlying knowledge bases or dictionaries to help determine the intent of the program is a good one; however, we do not use them in our research. Creating and using such knowledge bases is a challenging task and beyond the scope of this thesis. On the other hand, we do make use of conceptual metrics that are based on usage statistics.
The C3 metric [MP05] is a good example of a cohesion metric based on usage statistics. It measures the similarity in word usage between two methods. It is similar to document similarity metrics that measure the overlap in content between documents. For C3, the “documents” are the methods, and the words embedded in the identifiers and in the comments constitute the content of the documents.
C3 collects data on all of the methods in a class. For each method, it gathers the words that are present in the identifiers and comments, and puts them into a vector using latent semantic indexing (LSI) [DDF+90]. The authors note that
other information retrieval based techniques could be used, e.g., vector space models [TP10, SWY75], but that they chose LSI due to positive experiences with other software tasks based on semantics. They define theConceptual Similarity between Methods (CSM)function as the cosine similarity between their vectors. The C3 value for a class is the maximum of zero and the average CSM value for each pair of methods in the class. C3 ranges from a minimum of 0 to a maximum of 1. Because a C3 implementation was not available to us, I have created a variant of C3, theC3 (Vector space model variant) (C3V) metric. The primary differences between C3 and C3V is that C3V uses a vector space model to create a vector rather than LSI, and that the distance function that C3 uses only computes similarity between methods, while C3V’s function calculates distances between all class members.
While semantic cohesion metrics can be useful, they can also be unreliable. They depend on the programmer encoding meaningful information in the identifiers and documentation. For the extreme case of obfuscated code (or any code having non-meaningful identifiers), semantic cohesion metrics are nearly useless. Furthermore, a class’s semantic cohesion measurement can change due to a simple renaming of one of its members. This is an undesirable consequence,
given that the class functions exactly as before.
Comparative studies
Many researchers have done comparative studies on cohesion metrics, often in the context of showing why their new new metric is an improvement, e.g. [BB04, CKB00, ZLLX04]. The following paragraphs give a brief summary of the results of some of the more independent studies.
Briand, Daly, and Wust [BDW97] analyzed many cohesion metrics and created a theoretical framework encompassing the key points behind the various metrics. They observed that metrics differ in how they handle various features of object-oriented programming languages (e.g., inheritance, constructors, accessors, etc.). They note that there are different reasons for measuring cohesion, and that the purpose of the measurement should guide the selection of an appropriate metric. For the purposes of deciding when to split a class, they recommend cohesion metrics that are based on indirect connections between methods and attributes, rather than on direct connections.
Etzkorn et al. [EGF+04] set up tests to correlate the opinions of software
engineers regarding the cohesion of classes with the measurements produced by eight cohesion metrics. Each test was conducted on test sets consisting of fewer than 20 test classes. One group of evaluators was composed of seven software engineers with at least a BS degree in computer science or electrical engineering and five years of experience. The other was composed of graduate students studying software engineering. While there was variability between the opinions of the two group of evaluators, both groups’ opinion-based cohesion scores correlated most closely with LCC. (However, Dagpinar and Jahnke [DJ03] found no correlation between LCC and maintainability when they examined the maintenance history of two software systems.) Etzkorn’s study also found that there was often poor correlation between the cohesion values produced by some of the metrics.
Marcus and Poshyvanyk looked at the correlations between eleven different cohesion metrics [MP05]. They found significant correlations between some metrics and very little between others. The highly correlated metrics tended to be in the same “family” of metrics, e.g., the ones derived from LCOM; however, they did see some cross family correlations, including between the structure-based LCOM* [Hen96] and their semantics-based C3.
Barker and Tempero [BT07] conducted an empirical study of 16 cohesion metrics on 92 Java applications to see what values were typical for real-world systems. They also found some correlation between metrics in the same family and significant variation between metrics in different families. They concluded that “it is unclear which are of useful value”.
All of these studies found significant variation between different families of structural cohesion metrics. Some of these variations are due to imprecision in how the metrics were defined. For example, some metrics do not state what happens when there are no attributes or no methods. In other cases, implementers of metrics may make arbitrarily different decisions. One metric will consider a class with a single method to be maximally cohesive while another will consider it maximally noncohesive. Metrics also frequently differ in how they treat special methods. Section 2.4 discusses some techniques we have introduced to address some of the problems relative to special methods.
2.1.4
Interclass complexity – coupling
Couplingrefers to the dependencies of entities on external entities, for example, a method in one class depending on a method in another class. These dependencies include methods in one class calling methods in another class, inheritance relationships between classes, the use of a class as an attribute type, the use of a class as a parameter type or as a return type for a method, etc. [BDW99, CK91, EKS94, HM95].
Low coupling may indicate a good division of the functionality of the classes, i.e., classes are not directly reliant on the capabilities of many other classes. High coupling may indicate potential maintenance problems. With highly coupled classes, it can be more difficult to isolate the source of a behavior among the densely interconnected classes. Also, when a highly coupled class is changed, these changes are more likely to require follow-on changes to the coupled classes. Metrics differ in how they assign weights to various kinds of coupling. For example, some metrics [EKS94, HM95] consider the direct access of one class’s data by another to be a tighter coupling than when classes share data via the parameters of methods. In their summary of the variation between coupling metrics, Briand and his colleagues [BDW99] noted that the strength of coupling varies according to the types of connections and the numbers of connections between classes. Most coupling metrics give scores for an entity, e.g., they measure the degree to which a
class is connected to multiple other classes.
Coupling metrics can often be classified as either import coupling or export coupling metrics. Import couplingmetrics measure the dependencies a particular class has on others. The Message Passing Coupling (MPC) metric [LH93] is an example of an import coupling metric, because MPC counts the number of times a class calls methods external to the class. Export couplingmetrics measure how much a particular class is relied upon by others.Coupling Between Object Classes (CBO)[CK94] is a well-known example. For a given class, CBO is the number of classes which are in ausesrelationship with the indicated class; i.e., the count of the classes that access the methods or attributes of the indicated class.
Coupling metrics typically indicate which individual classes are highly coupled to others. They do not typically identify excessive coupling between two particular classes, which can be useful information for the task of identifying classes in need of refactoring. Nevertheless, several refactoring researchers have either used coupling metrics or have incorporated some of the principles of coupling metrics [TM05, LM06, FTSC11], mostly for help in determining whether a method should be moved from one class to another. Section 2.2.1 discusses coupling relative to detecting feature envy.
2.2
Related work – detecting bad smells
Bad smellsare emitted from code that “stinks” and needs changing [FBB+99]. Bad
smells are indicators of potential maintainability problems that can often be fixed by refactoring.
We agree with Beck and Fowler [FBB+99] that “no set of metrics rivals informed
human intuition” for detecting bad smells, at least for the current state of the art. In many small-scale software development scenarios, experienced developers can easily locate classes that are prone to error or difficult to maintain. However, on large systems, or when there is a lack of such expertise, it is useful to have a consistent, programmatic way of locating potential problem classes. The combi-nation of metrics and visualization tools can be particularly effective for helping programmers identify classes in need of refactoring [SSL01, PGN08, WL08].
The existing research on locating classes with bad smells using metrics [CLM06, DBDV04, FTSC11, LM06, MB08b, SSL01, TC09, TM05, Mun05, WL08] generally attempts to translate qualitative bad smell descriptions [FBB+99] into quantitative
criteria by which faulty classes can be identified programmatically. This entails picking the proper combination of metrics and thresholds for those metrics.
This section discusses how the feature envy and large class smells can be detected using metrics. Subsequent chapters discuss techniques for identifying how to refactor the classes once these smells are detected.
2.2.1
Detecting feature envy
A class suffers from feature envy when it makes heavy use of another class’s methods or attributes [FBB+99]. When this occurs, it is worth determining whether
some of the methods and attributes should be moved between the classes to lessen interclass dependencies and the consequent coupling.
There are several feature envy detection strategies in the literature, e.g. [LM06, TC09, TM05, SSB06]. Of these, the approach taken by researchers at the University of Macedonia [TC09] is the most detailed. Because there is much detail, we will only give a brief overview here. The cornerstone of their approach is anentity placement metric, which measures how tightly associated each class member is with its own class, i.e., what proportion of the member’s interactions are with members of its own class rather than members of other classes. The entity placement value for the system is the average value of the entity placement scores of its classes. Their technique allows them to identify which members are closely associated with other classes, and after relocating those members via refactoring, the system entity placement metric enables them to determine whether the system as a whole has improved. Their approach will be discussed in detail in Section 5.2.2.
2.2.2
Identifying large (god) classes
Large classes often contain too much functionality. When a class has too much functionality, some groups of functions might be better compartmentalized by placing them into additional classes.
There is no consensus on how to locate a class that is difficult to maintain due to its large size. There have been metric-based recommendations to limit class size since at least 1994, when Lorenz and Kidd [LK94] stated that the number of public instance methods in a class should be≤20 for a non-UI class and≤40 for a UI class, and the number of instance variables should be≤3 for a non-UI class and ≤9 for a UI class. On the other hand, several large class detection strategies are
based on more than just the size of the class [LM06, TM05, CAG11, OCS10, WL08]. These authors use the termgod classto indicate that it is a special kind of large class that is capable of performing many tasks. These god class detection strategies identify classes above a certain complexity and/or below a certain cohesion. (The specific criteria that we use to detect god classes are given in Section 2.4.3.)
However, it also seems clear that many programmers have a tolerance for large classes. For example, Gorschek, Tempero, and Angelis [GTA10] wanted to determine what theories of good object-oriented design were used in practice. They conducted a questionnaire-based on-line survey and analyzed 3785 responses from software practitioners. Over half of the respondents either were against a limit on the number of methods per class or did not care how many methods a class had. In the same study, only 45 respondents thought that there should be an absolute upper limit on the number of methods per class.
2.2.3
Determining thresholds of smell detection
For those people who believe in limits on class size, there is significant difference of opinion regarding what those limits should be. The 45 respondents from Gorschek’s study [GTA10] that supported an absolute upper limit had a median suggested limit of 10 methods per class. For the 2450 respondents who were “somewhat supportive” of a limit, the median suggested limit was 15 (although the highest suggested limit was 1000). For those researchers who implement bad smell detectors, the thresholds for the different metrics within the god class queries can differ considerably from one approach to the next.
Some bad smell detection approaches attempt to derive meaningful thresholds based on statistical measurements. For example, Lanza and Marinescu’s [LM06] thresholds are based on mean values and standard deviations, e.g., for many metrics, a high threshold is equal to the average value plus the standard deviation. Crespo, Lopez, and Marticorena [CLM06] make use of quartiles to determine metric value thresholds, e.g., a high value might be one in the upper quartile of a distribution. To our knowledge, nobody claims that their queries use threshold values based on empirical data that correlates metric values to maintenance activity. Because the threshold values are based primarily on intuition, it is not surprising that the values chosen vary widely. For example, the WMC threshold for god classes ranges from 13.5 [CLM06] to 47.0 [LM06], depending on the approach and project being investigated.
There is still considerable debate about what constitutes appropriate criteria for determining whether a large class is difficult to maintain and needs modification. However, unless the maintenance approach is fully-automated, it is not necessary to have precise criteria. Instead, maintainers can search for god classes in an iterative fashion. If the results of a search contain too many classes that do not need refactoring, the search criteria can be made more restrictive. If the results of a search contain a high percentage of classes that do need refactoring, the search criteria might be loosened in an attempt to find more classes to refactor. The decision about whether specific search criteria are effective can be based on human judgment or on other criteria, e.g. measurable improvement of the refactored classes.
2.3
Analysis of existing cohesion metrics – sources of
failure
Some of our early work on refactoring god classes [CAGN09] used a god class query to identify potential candidates for theExtract Classrefactoring. It seemed like our goal of locating poorly designed classes amenable to refactoring would be a simple matter. The plan was to create a bad smell query that used a cohesion metric to locate noncohesive classes, refactor those noncohesive classes, and then use the cohesion metric to validate that the cohesion had improved.
The plan did not work as well as we had hoped. Relative to our intuition, the cohesion metrics reported an inordinate number of false positives (classes that were reported as noncohesive, but were not) and false negatives (classes that were reported as cohesive, but were not). While the metrics helped narrow the scope of classes to look at, it was still necessary to inspect the classes manually to eliminate false positives.
We attribute much of the mismatch between our expectations and the actual cohesion results to flaws in how the metrics measure software. In their paper about software metric validation, Kitchenham et al. [KPF95] state that an important assumption regarding measuring software is “that two units contributing to a particular value are equivalent.” This is where existing metrics often fail – they do not distinguish enough between the various roles of methods, attributes, and the relationships between them when measuring cohesion.
undesirable affects on cohesion measurements. It explains how the presence of these features can cause cohesion measurements to be higher or lower than expected, sometimes to a large degree. We have separated these features into two broad categories, illusory and hidden cohesion, depending on whether they typically generate higher or lower cohesion values than expected. Many of these features will be discussed in the context of some deliberately noncohesive “PersonCar” classes from our test suite.
2.3.1
Example noncohesive classes – PersonCars
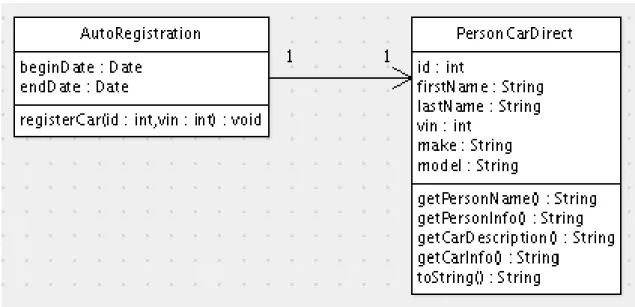
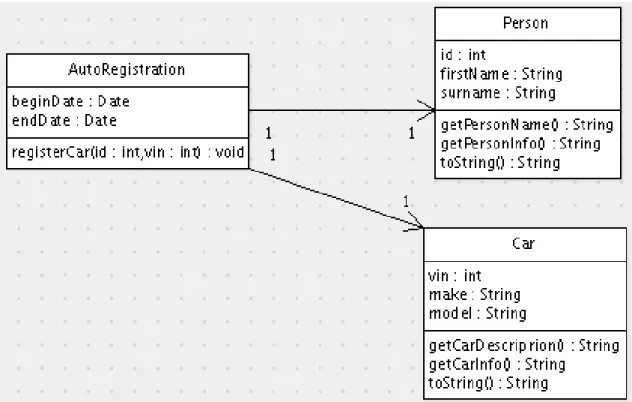
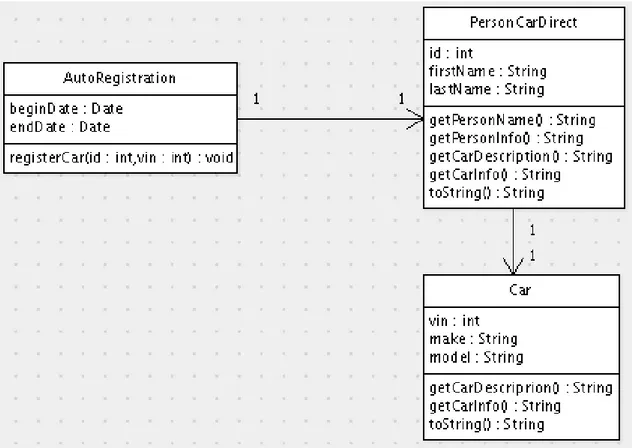
This section describes three closely related classes from our test suite that were designed to be conceptually noncohesive, and whose source code can be found in the appendices –PersonCarDisjoint(Appendix A.2),PersonCarDirect
(Appendix A.3), and PersonCarSpecial (Appendix A.5). Figure 2.4 shows intraclass dependency graphs for the three PersonCar variants.
Each of these classes has functionality pertaining to persons and functionality pertaining to cars. The person functionality includes the attributes id, first-Name, and lastName, their accessor methods, and the getPersonInfo and
getPersonNamemethods. The car functionality includes the attributes make,
model, and vin, their accessor methods, and the getCarDescription and
getCarInfomethods. PersonCarDirectandPersonCarSpecialalso have additional functionality unrelated to the primary purpose of the classes.
In each of the graphs in Figure 2.4, there is a group of members in the bottom left that pertains to cars, and is a group of members on the bottom right that pertains to persons. The three classes differ as follows:
1. The PersonCarDisjoint class of Figure 2.4(a) was designed to be noncohesive. It contains two distinct groups of members, and there are no interactions between the two groups.
2. ThePersonCarDirectclass of Figure 2.4(b) is likePersonCarDisjoint, but has an additionaltoStringmethod that callsgetCarInfoand get-PersonInfo, thereby connecting the previously disconnected groups.
3. ThePersonCarSpecialclass of Fi