Procedia Computer Science 57 ( 2015 ) 214 – 221
1877-0509 © 2015 The Authors. Published by Elsevier B.V. This is an open access article under the CC BY-NC-ND license (http://creativecommons.org/licenses/by-nc-nd/4.0/).
Peer-review under responsibility of organizing committee of the 3rd International Conference on Recent Trends in Computing 2015 (ICRTC-2015) doi: 10.1016/j.procs.2015.07.435
ScienceDirect
3rd International Conference on Recent Trends in Computing 2015 (ICRTC-2015)
Performance analysis of discrete wavelet transform based first-order
statistical texture features for hardwood species classification
Arvind R. Yadav
1*, R. S. Anand
2, M. L. Dewal
3, Sangeeta Gupta
41,2,3Department of Electrical Engineering, Indian Institute of Technology Roorkee, Roorkee,Uttarakhand, India 4Botany Division, Forest Research Institute, Dehradun, Dehradun,Uttarakhand, India
Abstract
A simple and efficient discrete wavelet transform (DWT) based first-order statistical (FOS) texture descriptor is proposed in this paper to accurately classify the microscopic images of hardwood species. Primarily, DWT decomposes each image up to 8 levels using selected Daubechies (db1- db10) wavelet as a decomposition filter. Subsequently, four FOS features, namely, mean, standard deviation, skewness and kurtosis are employed to obtain substantial signatures of these images at different levels. The db3 based FOS texture features has achieved 96.80% classification accuracy compared to 93.20% classification accuracy obtained by local binary pattern features using linear support vector machine (SVM) classifier.
© 2015 The Authors. Published by Elsevier B.V.
Peer-review under responsibility of organizing committee of the 3rd International Conference on Recent Trends in Computing 2015 (ICRTC-2015).
Keywords: Discrete wavelet transform; linear support vector machine; hardwood species; first-order statistics
1.Introduction
Hardwood species have great demand in construction, shipping, musical instruments, ammunitions (like rifle butts), railway sleepers, decorative items, furniture, etc. They emanate from angiosperm trees and are identified by their broad leaves. Hardwood species are both evergreen and deciduous and possess complex cellular structure which differs noticeably amongst the same species. Key elements that are worthwhile in identification of the
* Corresponding author. Tel.: +91-9410973149; fax: +91-1332-273560
E-mail address:[email protected], [email protected]
© 2015 The Authors. Published by Elsevier B.V. This is an open access article under the CC BY-NC-ND license (http://creativecommons.org/licenses/by-nc-nd/4.0/).
Peer-review under responsibility of organizing committee of the 3rd International Conference on Recent Trends in Computing 2015 (ICRTC-2015)
hardwood species are vessels, fibers, parenchyma and rays [1]. Surfaces of any wood can be acquired from three geometrical planes such as cross-sectional (transverse), radial and tangential. These planes speak about the surface uncovered during the process of marking. Microscopic images of cross-sectional surfaces contain ample information necessary to discriminate the hardwood species. Reasons which necessitate identification of wood species are: to protect illicit import and export of endangered wood species, to prevent wood traders from receiving undue profit margin by carrying out amalgamation of wood species, and to assist custom officials in the assessment of tariff and enforcement of trade regulations [2].
The wood species of any standing tree can be easily identified either by its leaves or fragrance or fruitlets or all. When these parts of a tree are axed from its trunk it becomes difficult to recognize timber and tree, thus necessitating the use of wood species identification techniques. These techniques are broadly classified in two categories; viz., traditional and machine vision. Traditional techniques of wood identification are based on analysis of macroscopic structures, hardness, color and scent of wood samples. Hardwood species identification, based on analysis of microstructures of image samples is the prevailing technique. The features of unidentified samples of hardwood species are matched against features of known hardwood species samples [3]. Traditional methods of wood identification are not only time consuming, but may also be erroneous as the identification accuracy is highly dependent on the competency of the officials involved in the identification process. Machine vision technology has been introduced with an aim to overcome shortcomings associated with the traditional methods of wood identification. It involves application of image processing techniques for identification and classification of image samples of hardwood species [4-12].
Initial wood identification technique employed use of gray level co-occurrence matrix (GLCM) to extract texture
features of images of wood species and multilayer perceptron as classifier [4]. An in-house “Visual System
Development Platform (VSDP)” to classify 20 tropical wood species of Malaysia was proposed by Khalid et al. [5].
They extracted texture features of each images using GLCM and used multilayer perceptron backpropagation neural network (ML-BP-NN) for classification. Bremananth et al. [6] proposed GLCM based texture features present in their barks classified with Pearson correlation technique for categorization of different Indian wood species. This technique helped to achieve high rates of classification accuracy. Combination of basic gray level aura matrix (BGLAM) and statistical properties of pore distribution (SPPD) techniques to identify 52 species of wood was proposed by Khalid et al. [7]. Moreover, Khairuddin et al. [8] suggested use of k-means clustering (18 clusters were selected based on minimum variance), followed by local discriminant analysis (LDA), kernel discriminant analysis (KDA)/generalized singular value decomposition (GSVD), with k-nearest neighborhood (KNN) as a classifier. A method for recognition of 24 wood species using the Gabor entropy feature along with mean and standard deviation classified by nearest neighbor classifier was proposed by Wang et al. [9].
Martins et al. [10] developed a database of microscopic images of hardwood and softwood species. In their investigation, features of image samples of hardwood and softwood species were extracted by means of GLCM, local binary pattern (LBP) and statistical methods with 24, 59 and 6 features, respectively. The LBP features classified with SVM achieved the best classification accuracy of 86%. Yadav et al. [11-12] proposed two different texture feature extraction techniques for classification of microscopic images of 25 different hardwood species using MLP-BP-NN classifier. The first technique integrated GLCM with Gabor wavelet to obtain texture features and yielded an accuracy of 92.60% [11], whereas the second technique, using Coiflet DWT based texture features provided classification accuracy of 92.20% [12].
The assessment of above work suggests that several texture feature extraction and classification techniques are used to improve the classification accuracy of hardwood species. It is obvious that the quality of the texture features extracted from the images of hardwood species have significant impact on the classification accuracy of the classifier. This research work proposes use of a DWT based FOS texture feature technique for improving the classification accuracy of hardwood species. Linear SVM classifier is used for evaluating the performance of proposed texture feature technique.
The present work is organized as follows: Section-2 presents the proposed DWT based FOS texture features for classification of hardwood species, Section-3 briefly describes DWT, FOS and linear SVM classifier, Section-4 details the performance evaluation of the DWT based FOS texture features, and Section-5 concludes the work.
2.Proposed methodology
The steps involved in the classification process of hardwood species are preprocessing, texture feature extraction and classification. The same is schematically represented in Fig.1.
Fig.1 Block schematic of hardwood species classification using DWT based FOS texture features
Since the microscopic images of hardwood species contain added colour information to enhance certain anatomical features of it, thus preprocessing is employed to transform colour (RGB) image into grayscale image. This transformation results in significant reduction of computational time in texture feature extraction process. During feature extraction the grayscale images are decomposed by DWT upto several levels (1 to 8) using Daubechies (db1 - db10) wavelet family as decomposition filter. The decomposition process is as follows: grayscale image is segmented into four identical quarter-size subimages, viz., approximation (LL1), horizontal (LH1), vertical
(HL1) and diagonal (HH1) components at the 1st level of decomposition. The approximation (LL1) component is
subsequently decomposed into four quarter-size subimages, LL2, LH2, HL2 and HH2 of identical size to produce
2nd level of decomposition. Similarly, approximation coefficient of each level is again segmented into four
subimages of equal-size to obtain next higher level of decomposition. Further, four first-order statistical (FOS) features, viz., mean, standard deviation, skewness and kurtosis are calculated from each of these subimages. Moreover, these texture feature vectors containing various range of values are normalized in the range of 0 to 1, by using Eq. (1),
ܨேൌ ቀ
ிିሺிሻ
௫ሺிሻିሺிሻቁ (1)
where, ܨேǣ normalized feature vector data, ܨǣ original feature vector data. The normalized feature vector is then applied to the input section of a linear SVM classifier to classify the hardwood species into 25 distinct classes.
3.Theoretical background
Following subsections brief about the theoretical concept of texture feature extractor and classifier for the proposed hardwood species classification method.
3.1.Two dimensional-discrete wavelet transform (2D-DWT)
The 2D-DWT is widely used in numerous types of image processing applications, namely; image denoising, image compression, video compression, face recognition, speech recognition, pattern recognition and content based image indexing [13-16]. DWT has the tendency of attaining spatial and frequency localization at any given instant simultaneously [17]. It has been widely utilized by researchers because of its multiresolution analysis capability, helpful in detecting features at a unique resolution which is undetectable at any other resolution. A 2D-DWT
includes four critical elements, one 2D scaling function ߮ሺݔǡ ݕሻǡ and three 2D wavelet
functionsሺ߰ுሺݔǡ ݕሻ,ɗሺݔǡ ݕሻ and߰ሺݔǡ ݕሻሻ. The aforesaid scaling and wavelet functions are product of two 1D
functions. These wavelets are used for measurement of intensity variations along different orientations of images,
such that ߰ு denotes variations measured in horizontal orientations, ߰ signifies variations in vertical orientations
and ߰responds to variations along the diagonal orientations. The DWT expression to an image ݂ሺݔǡ ݕሻ of size
M × N is given by [14]: ሺǡ ǡ ሻ ൌ ଵ ξσ σ ሺǡ ሻɔ୨బǡ୰ǡୡሺǡ ሻ ିଵ ୷ୀ ିଵ ୶ୀ (2)
ܹటሺ݆ǡ ݎǡ ܿሻ ൌ ଵ ξெேσ σ ݂ሺݔǡ ݕሻ߰ǡǡ ሺݔǡ ݕሻ ேିଵ ௬ୀ ெିଵ ௫ୀ , ݅ ൌ ሼܪǡ ܸǡ ܦሽ (3)
where, represents the arbitrary starting scale. An approximation of image ݂ሺݔǡ ݕሻ at scale ݆ is defined by
ܹఝሺ݆ǡ ݎǡ ܿሻ coefficients. The diagonal, vertical and horizontal details for scale ݆ ݆ is given by
ܹటሺ݆ǡ ݎǡ ܿሻcoefficients.
Digital filters and down samplers are required to implement 2D-DWT. For image decomposition the rows of images are convolved with low pass filter and high pass filter followed by down sampling its columns to produce two subimages. This causes reduction by a factor of 2 in horizontal resolution of two subimages. Approximation and detail components refer to low frequency and high frequency information in the vertical direction, respectively. Further, two subimages are filtered column wise and down sampled by a factor of 2, to produce four output
subimages of quarter sizeܹఝ,ܹటு, ܹట andܹట. The N-scale decomposition of an image involves N number of
iterations of its filtering process.
The characteristic of resulting wavelet transform depends on mother wavelet. Selection of mother wavelet is of utmost importance as it produces wavelet functions, through scaling and translation. The choice of Daubechies wavelet as basis function depends on its distinctive properties as given in [18-19]. Daubechies wavelet families are well known basis function used as decomposition filter in DWT. Ingrid Daubechies has designed compactly supported orthogonal wavelets with a pre-assigned degree of smoothness. Daubechies wavelet is used in several image processing applications [20]. These wavelets are also known as maxflat wavelets, because maximum flatness in the frequency response is observed at 0 and Ɏ frequencies.
3.2.First-order statistical (FOS) features
The first-order statistical moments of the gray level histogram of images, namely mean, standard deviation,
skewness and kurtosis are used for feature extraction [14]:Mean is the measure of average intensity of pixels in an
image. The standard deviation refers to the measure of contrast in an image. The skewness (3rd moment) is a
measure of symmetry; which deals with the degree of histogram asymmetry around the mean. The kurtosis (4th
moment) is a measure of relative flatness also known as fourth moment, a descriptor of the shape of a probability distribution. The mathematical expression of the above descriptors are available in [14].
3.3.Linear SVM Classifier
Support vector machine [21] is an effective machine learning technique widely used for classification task. It was originally proposed as a binary classifier that works on the principle of constructing an optimal hyper plane to separate the two classes. This classifier has been extended for multiclass classification by researchers using different approaches such as "one versus one", "one versus all" and "directed acyclic graph" [22]. In this paper, L2-Regularized L2-Loss support vector classifier (dual) is used as optimization problem solver for multiclass classification. The reason for choosing this solver is that even for large dataset it requires less memory and was recommended for regular classification task [23]. These days, linear classifier is method of choice as it works directly on the given input data space, over kernel based classifier which maps data into higher dimension. Linear SVM classifier is ideal for a dataset having massive features, and is sparse in nature. It is considered to be efficient and enjoys faster training and testing procedure. Also, the price paid for predicting testing instance by linear classifier is simply O (n) contrast to O (ln) for nonlinear classifier [23].
4.Results and discussions
In order to appraise the effectiveness of the DWT based FOS texture feature extraction technique described in Section-2, investigations were conducted on available microscopic image database of hardwood species.
4.1.Hardwood species database
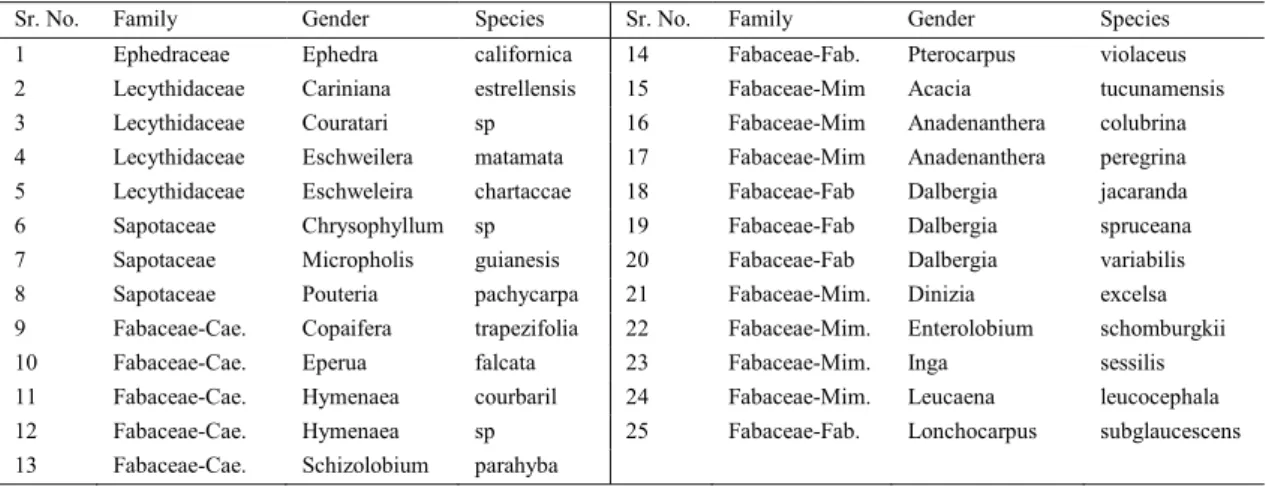
The hardwood species database developed by Martins et al.[10] in association with Wood Anatomy Laboratory of Federal University of Parana, Curitiba, Brazil; contains 20 samples of each species. Each image sample has the resolution of 1024 × 768 pixels. All the samples were correctly labeled by the experts. The proposed work investigates the classification of 25 hardwood species enlisted in Table 1.
Table 1 List of 25 categories of hardwood species
Sr. No. Family Gender Species Sr. No. Family Gender Species 1 Ephedraceae Ephedra californica 14 Fabaceae-Fab. Pterocarpus violaceus 2 Lecythidaceae Cariniana estrellensis 15 Fabaceae-Mim Acacia tucunamensis 3 Lecythidaceae Couratari sp 16 Fabaceae-Mim Anadenanthera colubrina 4 Lecythidaceae Eschweilera matamata 17 Fabaceae-Mim Anadenanthera peregrina 5 Lecythidaceae Eschweleira chartaccae 18 Fabaceae-Fab Dalbergia jacaranda 6 Sapotaceae Chrysophyllum sp 19 Fabaceae-Fab Dalbergia spruceana 7 Sapotaceae Micropholis guianesis 20 Fabaceae-Fab Dalbergia variabilis 8 Sapotaceae Pouteria pachycarpa 21 Fabaceae-Mim. Dinizia excelsa 9 Fabaceae-Cae. Copaifera trapezifolia 22 Fabaceae-Mim. Enterolobium schomburgkii 10 Fabaceae-Cae. Eperua falcata 23 Fabaceae-Mim. Inga sessilis 11 Fabaceae-Cae. Hymenaea courbaril 24 Fabaceae-Mim. Leucaena leucocephala 12 Fabaceae-Cae. Hymenaea sp 25 Fabaceae-Fab. Lonchocarpus subglaucescens 13 Fabaceae-Cae. Schizolobium parahyba
4.2.Results and evaluation of experimental work
The primary goal of this investigation is to assess the performance of the proposed DWT based FOS texture feature extraction techniques using linear SVM classifier for classification of microscopic images of hardwood species. This classifier is implemented using wrapper class of LibLINEAR tool [24] available in Waikato Environment for Knowledge Analysis (WEKA) [25] using L2-regularized L2-loss support vector classification (dual) optimization problem solver. Further, stratified 10-fold cross validation is used to produce the final classification result. The reason to employ 10-fold cross validation is to ensure that the results remain unbiased for a given partitioned data. This method divides the whole dataset into 10 uniform folds out of which 9-folds are used as training data and remaining one fold becomes test data. This process is repeated 10 times and the average of these outcome generates final result. The accuracy of given classifier largely depends on C parameter. In this work, the C,
and Ɍ parameter values for linear SVM classifier have been preferred as 1 and 0.01, respectively. The reason for
fixing C parameter is to ensure that attention is paid only to the evaluation of texture features produced by the DWT based FOS technique [26]. With the above set of parameters, two investigations have been carried out, the first using conventional texture features and the second using proposed DWT based FOS texture features.
The first investigation deals with the performance evaluation of widely used texture feature techniques such as local binary pattern (LBP) [27], rotation invariant local binary pattern (LBPri) [28-29], uniform local binary pattern
(LBPu2) [29], rotation invariant uniform local binary pattern (LBPriu2) [29] and local directional pattern (LDP) [30]
for classification of hardwood species. The MATLAB code for the aforesaid methods provided by their authors are used for texture feature generation. For LBP and its variants, P and R parameter values are selected as 8 and 1,
respectively. The texture features obtained by LBP, LBPri, LBPu2, LBPriu2, and LDP have given classification
accuracies; 93.20% (256), 78.20% (36), 87.20% (59), 54.40% (10) and 84.60% (256), respectively. Amongst them, the LBP has achieved highest classification accuracy, whereas LBPriu2 has offered least classification accuracy.
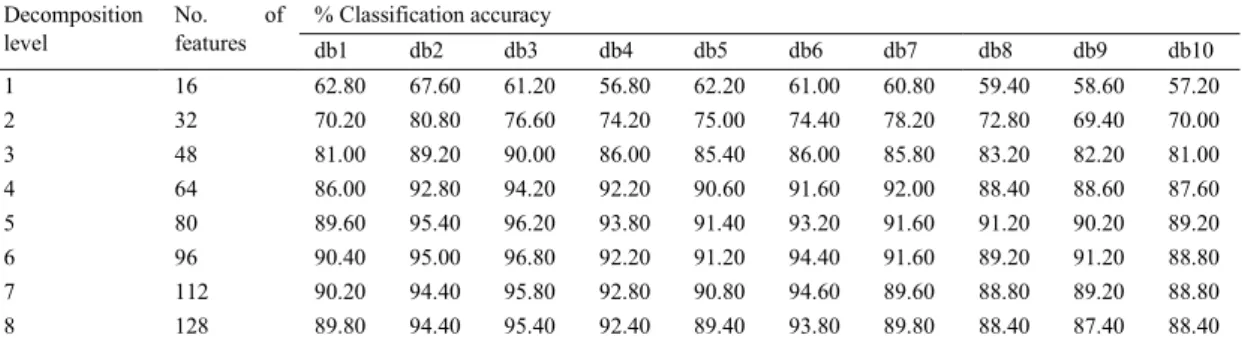
Table 2. Performance evaluation of DWT based FOS texture feature techniques using linear SVM classifier. Decomposition level No. of features % Classification accuracy db1 db2 db3 db4 db5 db6 db7 db8 db9 db10 1 16 62.80 67.60 61.20 56.80 62.20 61.00 60.80 59.40 58.60 57.20 2 32 70.20 80.80 76.60 74.20 75.00 74.40 78.20 72.80 69.40 70.00 3 48 81.00 89.20 90.00 86.00 85.40 86.00 85.80 83.20 82.20 81.00 4 64 86.00 92.80 94.20 92.20 90.60 91.60 92.00 88.40 88.60 87.60 5 80 89.60 95.40 96.20 93.80 91.40 93.20 91.60 91.20 90.20 89.20 6 96 90.40 95.00 96.80 92.20 91.20 94.40 91.60 89.20 91.20 88.80 7 112 90.20 94.40 95.80 92.80 90.80 94.60 89.60 88.80 89.20 88.80 8 128 89.80 94.40 95.40 92.40 89.40 93.80 89.80 88.40 87.40 88.40 The second investigation evaluates the effectiveness of the DWT based FOS texture feature techniques proposed in Section-2 for the classification of hardwood species by applying these features at each level of image decomposition as an input to the linear SVM classifier. The percentage classification accuracy obtained by these texture features up to 8th level of image decomposition is presented in Table 2.
From Table 2 it is seen that amongst DWT based FOS texture feature techniques, the db2 texture features has achieved better classification accuracy of 67.60% and 80.80% at image decomposition level 1 and level 2, respectively. Further, db3 based texture features has produced highest classification accuracy of 90%, 94.20%, 96.20%, 96.80% 95.80% and 95.40% for rest of the six image decomposition levels (3 to 8), respectively. The db3
based texture features at 6th level of image decomposition has attained best classification accuracy of 96.80% for
hardwood species dataset, amongst the proposed techniques. Moreover, the lowest classification accuracy of 56.80%
is attained by db4 based texture features at 1st level of image decomposition. It is evident from Table 2 that the
classification accuracy of texture features classified with linear SVM classifier increases as the image decomposition level increases from 1st to 6th level and thereafter the classification accuracy hardly improves. As a result, texture
feature beyond 8th level of image decomposition have not been investigated. The performance of db1 to db10 based
FOS texture features have seen remarkable improvement as the decomposition level has increased.
The performance of the proposed DWT based FOS and conventional texture features are compared. It is seen that the classification accuracy obtained by the proposed texture features are notably higher than the conventional texture features for hardwood species database. It is also found that db3 based texture features (96) gives the best classification accuracy of 96.80% in comparison to LBP texture features (256) that has produced 93.20% classification accuracy when classified with linear SVM classifier.
The performance of the linear SVM classifier has been investigated using parameters namely, kappa statistic, mean absolute error (MAE), true positive rate (TP), false positive rate (FP), precision, recall, F-measure, Matthews correlation coefficient (MCC), receiver operating characteristic (ROC) area and precision-recall curve (PRC) area. For the aforementioned parameters, 0.9667, 0.0026, 0.968, 0.001, 0.968, 0.968, 0.968, 0.963, 0.933, 0.940, value has been achieved, respectively. Among 500 samples of hardwood species, 484 samples have been classified correctly for db3 based texture features. Lower value is expected for FP and for rest of the parameters considered in this work, higher values are expected for better performance of classifier [31]. Also, the higher value of kappa statistics (0.9667) [32], in the range (0-1) for linear SVM classifier, suggests superior classification performance.
5.Conclusions
In this paper, performance analysis of a DWT based FOS texture feature techniques has been discussed for classification of an open source database of 500 microscopic image samples of 25 different hardwood species. A linear SVM classifier has been used for assessing the performance of the proposed feature extraction techniques for 8 different levels of image decomposition by DWT. Critical analysis of the obtained results reveals that db3
(amongst db1 to db10) based FOS texture features contain discriminative features at 3rd to 8th levels of image
decomposition. Superlative classification accuracy of 96.80% is obtained for db3 based texture features at the 6th
known texture features such as LDP and variants of LBP for microscopic image database of hardwood species. It can also be concluded that the considered classifier performs superiorly due to db3 based texture feature as higher weighted values of kappa statistics (0.9667), TP-rate (0.968), precision (0.968), recall (0.968) and F-measure (0.968) which are in the range (0-1) are achieved.
Acknowledgements
The authors would like to express their gratitude to Prof. Luiz Eduardo S. Oliveira, Federal University of Parana (UFPR), Department of Informatics, for providing microscopic images of hardwood species for academic research [10]. The authors also express their earnest gratitude to those researchers who have made available MATLAB codes of LBP and its variants on www.cse.oulu.fi/CMV/Downloads.
References
[1] Bond B. Wood identification for hardwood and softwood species native to Tennessee. The University of Tennessee Agricultural Extension Service 2002:PB1692.
[2] Wheeler EA, Baas P. Wood identification: a review. IAWA Journal 1998;19(3):241-264.
[3] Baas P, Wheeler EA, Gasson PE. IAWA list of microscopy features for hardwood identification. IAWA Bull.(NS) 1989;10:219-332. [4] Tou JY, Lau PY, Tay YH. Computer vision-based wood recognition system. Proc. Int. Workshop on Advanced Image Technology
2007.
[5] Khalid M, Lee ELY, Yusof R, Nadaraj M. Design of an intelligent wood species recognition system. International Journal of Simulation System, Science and Technology 2008;9:9-19.
[6] Bremananth R, Nithya B, Saipriya R. Wood species recognition using GLCM and correlation. Proc. IEEE Int. Conf. on Advances in Recent Technologies in Communication and Computing(ARTCom'09), Kottayam, Kerala, 2009:615-619.
[7] Khalid M, Yusof R, Khairuddin ASM. Tropical wood species recognition system based on multi-feature extractors and classifiers.
Proc. 2nd IEEE Int. Conf. on Instrumentation Control and Automation (ICA), Bandung, 2011:6-11.
[8] Khairuddin ASM, Khalid M Yusof R. Using two stage classification for improved tropical wood species recognition system.
Intelligent Interactive Multimedia Systems and Services, Springer, 2011:305-314.
[9] Wang H-J, Qi H-N, Wang X-F. A new wood recognition method based on gabor entropy. Advanced Intelligent Computing Theories and Applications With Aspects of Artificial Intelligence, Springer, 2012:435-440.
[10] Martins J, Oliveira L, Nisgoski S, Sabourin R. A database for automatic classification of forest species. Machine vision and applications, 2013;24:567-578.
[11] Yadav AR, Dewal ML, Anand RS and Gupta S. Classification of hardwood species using ANN classifier. Proc. IEEE Int. Conf. Computer Vision, Pattern Recognition, Image Processing and Graphics, Jodhpur, 2013:1-5
[12] Yadav AR, Anand RS, Dewal ML,Gupta S. Analysis and classification of hardwood species based on Coiflet DWT feature extraction and WEKA workbench. Proc. IEEE Int. Conf. Signal Processing and Integrated Networks, Noida, 2014:9-13
[13] Kemal Ekenel H, Sankur B. Multiresolution face recognition. Image Vision Comput.,2005;23(5):469-477. [14] Gonzalez RC, Woods RE. Digital image processing. 3rd, Pearson Prentice Hall, 2002.
[15] Singh B, Choudhary R, Jayas DS, Paliwal J. Wavelet analysis of signals in agriculture and food quality inspection. Food Bioprocess Technol., 2010;3:2-12.
[16] Subrahmanyam M, Maheshwari R, Balasubramanian R. Expert system design using wavelet and color vocabulary trees for image retrieval. Expert Syst. Appl., 2012;39:5104-5114.
[17] Livens S, Scheunders P, Van de Wouwer G, Van Dyck D. Wavelets for texture analysis, an overview. Proc. 6th IET Int. Conf. on Image Processing and Its Applications, Dublin, 1997:581-585.
[18] Cohen A, Daubechies I, Feauveau JC. Biorthogonal bases of compactly supported wavelets. Commun. Pure Appl. Math., 1992;45:485-560.
[19] Satiyan M, Hariharan M, Nagarajan R. Comparison of performance using Daubechies wavelet family for facial expression recognition. Proc. 6th IEEE Int. Colloquium on Signal Processing and Its Applications (CSPA), Mallaca City, 2010:1-5.
[20] Wang JZ, Wiederhold G, Firschein O, Wei SX. Content-based image indexing and searching using Daubechies' wavelets.
International Journal on Digital Libraries, 1998;1:311-328.
[21] Cortes C, Vapnik V. Support-vector networks. Machine learning, 1995;20:273-297.
[22] Platt JC, Cristianini N, Shawe-Taylor J. Large margin DAGs for multiclass classification. NIPS,1999;12:547-553. [23] Yuan G-X, Ho C-H, Lin C-J. Recent advances of large-scale linear classification. Proc. IEEE, 2012;100:2584-2603.
[24] Fan R-E, Chang K-W, Hsieh C-J, Wang X-R, Lin C-J. LIBLINEAR: A library for large linear classification. The Journal of Machine Learning Research, 2008;9:1871-1874.
[25] Hall M, Frank E, Holmes G, Pfahringer B, Reutemann P, Witten IH. The WEKA data mining software: an update. ACM SIGKDD explorations newsletter,2009;11:10-18.
[26] Alexandre LA. Gender recognition: A multiscale decision fusion approach.Pattern Recognit. Lett., 2010;31:1422-1427.
[27] Ojala T, Pietikäinen M, Harwood D. A comparative study of texture measures with classification based on featured distributions.
Pattern Recognit., 1996;29:51-59.
[28] Pietikäinen M, Ojala T, Xu Z. Rotation-invariant texture classification using feature distributions. Pattern Recognit., 2000;33: 43-52. [29] Ojala T, Pietikainen M, Maenpaa T. Multiresolution gray-scale and rotation invariant texture classification with local binary patterns.
IEEE Trans. Pattern Anal. Mach. Intell., 2002;24:971-987.
[30] Jabid T, Kabir MH, Chae O. Facial expression recognition using local directional pattern (LDP). Proc. 17th IEEE Int. Conf. on Image Processing (ICIP), Hong Kong, 2010:1605-1608.
[31] Ghosh S, Biswas S, Sarkar D, Sarkar PP. A tutorial on different classification techniques for remotely sensed imagery datasets.
SmartCR, 2014;4:34-43.
[32] Fleiss JL, Levin B, Paik MC. The measurement of interrater agreement. Statistical methods for rates and proportions, 1981;2 :212-236.