Legacy Language Atlas Data Mining: Mapping Kru Languages
An online tool based on dialectometric methods, DistGraph, is applied to a group of Kru languages of Côte d’Ivoire, Liberia and Burkina Faso. The inputs to this resource consist of tables of languages x linguistic features (e.g. phonological, lexical or grammatical), and statistical and graphical outputs are generated which show similarities and differences between the languages in terms of the features as virtual distances. In the present contribution, attention is focussed on the consonant systems of the languages, a traditional starting point for language comparison. The data are harvested from a legacy language data resource based on fieldwork in the 1970s and 1980s, a language atlas of the Kru languages. The method on which the online tool is based extends beyond documentation of individual languages to the documentation of language groups, and supports difference-based prioritisation in education programmes, decisions on language policy and documentation and conservation funding, as well as research on language typology and heritage documentation of history and migration.
Keywords: online virtual map tool, legacy data, Kru languages, language distance, natural language processing
1. Objectives
1 documentation project for languages of Côte d’Ivoire.2 An important objective is to raise the efficiency of language comparison in relation to traditional manual methods. The objective of the online implementation is to facilitate remote cooperation within the project. Unlike most language resources, this dual resource of online tool and value-added description of langauge data extends beyond the documentation of individual languages to the creation of a resource for policy decision making, based on differences between groups of languages, interpreted as virtual distances.Disciplines such as digital humanities, computational linguistics, natural language processing, speech processing, language typology and language documentation are not as aware of each other as they could be, to the mutual benefit of each other. The present study touches on each of these areas.
The legacy data are harvested from an atlas of Kru languages of Côte d’Ivoire (Marchese, 1984). There are clearly many possible options for selecting among
1 This paper is dedicated to the memory of my colleague and host, Henrike Grohs, Director of the Goethe-Institut in Abidjan, Côte d’Ivoire, who died at the hands of terrorists in Grand Bassam, Côte d’Ivoire, on 13th March 2016.
2 Language in cultural context, PI Stavros Skopeteas, associated scientists Firmin Ahoua, Dafydd Gibbon, funded by DAAD, Germany (Project-ID: 57143498, funding period: 2015-2018).
phonological, lexical and grammatical features to compare languages in terms of similarities and differences, but for the present resource consonant inventories in the Kru languages were initially selected. The motivation for selecting consonant inventories first is that consonant inventories are relatively well-defined, fairly clearly structured, sufficiently small to be tractable in a pilot study, and have a long tradition of use in philological language reconstruction as a reliable initial source of information for classifying languages typologically and genetically (cf. Grimm’s Law of consonant change from Indo-European to Germanic, e.g. dʰ>d>t>θ).
The online tool supports comparison of vectors of language features (i.e. elements in inventories) using a choice of distance measures (Hamming Distance, Levenshtein Distance, Set Distance). In the present application, the inventories of 19 Kru languages are compared, with a total of 44 different consonants in the set union of the 19 inventories. The tool provides techniques of dimensionality reduction for prioritisation of features in description and visualisation, including the generation of virtual language maps. The virtual maps document typological relations and it is not implied here that the maps correspond to historical or geographical topologies, or to mutual intelligibility, or learning difficulty. Inter-domain correspondences of these kinds are not a priori excluded, however, and in some cases the virtual distance relations strongly suggest historical and on some cases geographical interpretations. Inter-domain interpretation of this kind is an empirical issue which is not immediately relevant to the present context and is only mentioned in passing.
2. Data
In the 1970s and 1980s a large-scale programme of language documentation was organised in Côte d’Ivoire, coordinated by the Institut de Linguistique Appliquée at the Université de Cocody (now Université Houphouet Boigny) in Abidjan. For each of the major language groups, Gur, Mande, Kru and Kwa, extensive language atlas volumes were created, containing sketch grammars and lexicons for each language, with outline maps and descriptions of the situation of the languages. Very few copies of these atlases still exist due to deterioration and loss, and the preservation of these atlases in a digital archive, with accessibility to all interested parties, is a matter of urgency. Work on this task is in progress. No less important is the provision of value-added material on this data in order to permit efficient reusability of the data; this aspect is the concern of the current work.
For the present context, the Kru atlas (Marchese, 1984) was selected, and the consonant systems for 19 Kru languages, 17 in Côte d’Ivoire and 2 in neighbouring Liberia and Burkina Faso were extracted (the atlas has the former name of Burkina Faso, ‘Haute Volta’): Aïzi (isolate in Côte d’Ivoire), Bassa, Bete, Cedepo, Dewoin, Dida de Lozoua, Dida F, Godie, Grebo, Guere, Klao, Koyo, Krahn, Kuwaa (isolate in Liberia), Neyo, Niaboua, Seme (isolate in Burkina Faso), Tepo, Wobe.3 The approach is also being applied to the Gur, Kwa and Mande groups of Côte d’Ivoire languages.
Figure 1: Four examples of the scanned legacy information on consonant systems of Kru languages.
The consonant systems of the Kru languages have several related properties: phonemic distinctions between implosive vs. non-implosive stops, palatal vs. velar consonants, and singly articulated consonants vs. dual articulated consonants such as labiovelar /kp, kw, gb, gw/ and prenasalised /ŋw, ŋm/. The inventories of all the languages share some consonants, and many of the 3 The Ethnologue catalogue (Lewis et al., 2015) lists 39 Kru languages, but it does not list Cedepo, Dewoin, Koyo and Niaboua, it gives more than one variety of some languages, and it lists others as one of a group of related languages. Dida and some Dida varieties are listed, but varieties named Dida de Lozoua and Dida F are not.
inventories share differing subsets of the consonants. It is this observation about differing numbers of differences which provides the basis for the visualisation of relations between the languages in terms of virtual distance.
A legitimate critique of the use of consonant inventories is the coarse granularity of unanalysed phonemic units like consonants: each consonant is treated as equally distant from all the others, making expected changes such as p>f have the same value as implausible changes such as p>s. In order to overcome this, decomposition of the consonants into feature vectors would be required. This step has not been taken at the present stage since the initial objective is to demonstrate fitness for purpose of the tool as a language comparison resource, rather than to provide a definitive analysis of the languages.
3. Method
3.1. Previous related studies
The method used in the present study for virtual distance calculation between languages is related to work in computational dialectometry described by Nerbonne et al. (2003) and is a simpler variety of the calculation and visualisation methods used by Petroni et al. (2010) and Jäger (2012) for lexically based language comparison. Related distance measures are also used for stylometry in digital humanities research, which, inter alia, investigates authorship attribution on the basis of lexical similarities and differences as virtual distances between works of literature (Rybicki et al. 2013).
3.2. Workflow overview
A methodology was developed for developing a state-of-the-art virtual map (or conceptual map) of smilarities and differences between the Kru languages in the Marchese (1984) atlas, with the long-term intention of extending the method applied to consonant inventories to inventories of lexical and grammatical properties of Kru languages (cf. Kipré, 1989). The tool is implemented as a server-side online application in order to facilitate remote cooperation and ensure consistency of the resource.4
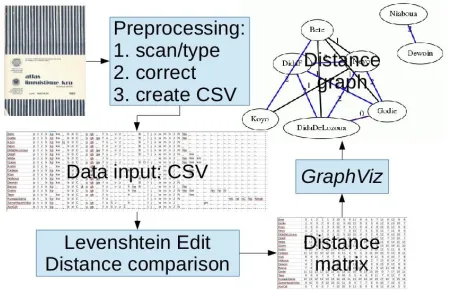
Figure 2: Language atlas mining workflow.
4 Cf. http:// wwwhomes.uni-bielefeld.de/gibbon/DistGraph/
A simplified overview of selected aspects of the workflow for language atlas data mining is shown in Figure 2. After initial digitisation and correction, tables of the consonant inventories were created, one language inventory per row, with consonants ordered in equal length rows and a dummy symbol for missing items in specific inventories.
3.3. Distance measures
The rows in the data matrix may be used as ordered sequences or as sets of features. In the latter case the complement of the set intersection, CSI (i.e. the size of the union minus the intersection), is used as the similarity measure: |x y\x∩y|.∪
If the rows consistently represent the values of ordered attributes and if they are of equal length (for example when missing items are given an explicit dummy symbol), the rows can be interpreted as sequences. There are many similarity/distance options which may apply pairwise to the rows in the consonant table; the Hamming Distance (HD) measure is the most relevant to the present case:
HD(x , y)=
∑x
n=y=11if xi≠yielse0,for|x|=|y| If the sequences are not of equal length, Levenshtein Edit Distance (LED) can be used, i.e. the minimum number of atomic deletions, insertions or substitutions required to edit one sequence into another: LED(x,y) = argmin(del(x,y)+ins(x,y)+sub(x,y)). It is possible for the two string edit measures to produce different results, with LED(x,y) < HD(x,y), for strings of equal length, e.g. in string rotations: LED(‘abc’, ‘bca’) = 2, HD(‘abc’, ‘bca’) = 3 (in the consonant inventory data this case does not arise). In the specification of the online tool, CSI and LED are included. With the given data format restrictions, HD and LED yield the same index, so only the more flexible measure, the LED, is retained.The pairwise application of the distance measure to the rows of the table yields a triangular distance table of size (n2-n)/2 with a diagonal of zeros:
distance(x,y)=distance(y,x) and distance(x,y)=0
3.4. Visualisation of distances as virtual map
3.4.1. Dimensionality reduction
Dimensionality reduction is a key issue in many classification tasks (van der Maaten et al., 2009). The attributes (i.e. consonants) in the table of inventories define the dimensionality of the distance pattern: with 44 consonants, as in the present case, there are 44 potential dimensions. The task of creating a two-dimensional virtual map thus requires a reduction from 44 to 2 dimensions. Fortunately, not all of these consonants are equally important in defining distances: some are shared by all languages in the set, and there are many other shared subsets. Three dimensionality reducing approaches are used: (1) graph generation with use of a dimensionality-reducing spring force-directed algorithm for the purpose of visualisation as a virtual map; (2) Low Variance Filter; (3) induction of decision trees over the consonant set. The problem to be addressed here is about
pairwise relationships, not about classification or clustering, for which a dimensionality reduction would also be required (this is a task to be addressed in future work).
3.4.2. Graph generation
The main output of the online tool is a visualisation of virtual distances between the languages, interpreted as a virtual map. The idea behind this is to make it easier for non-experts to assess potential relationships between the languages. The necessary dimensionality reduction is achieved by a spring force-directed algorithm which attempts to minimise a global energy function and is equivalent to statistical multi-dimensional scaling (Kamada et al., 1989). The virtual map is not intended to reflect the properties of a geographical map (for instance the virtual distances are only approximately rendered by edge length and colour, and direction is not interpretable).
3.4.3. Low Variance Filter
If feature values in a data column have low variance, they contribute less to distinguishing between the objects represented in the rows than columns with high variance. In order to apply the LVF, the categorial feature values (consonants) are first converted into normalised numerical features 1 and 0, signifying presence or absence of a particular consonant in the inventory, respectively. Standard deviation is in fact used, rather than variance, in order to provide a clearer human-readable relation to the original values. The standard deviation of each column is calculated, and the features are ranked in order of variance. The threshold for rejecting low variance (low standard deviation) features depends on the classification required; is not explicitly used. In the present application the threshold is implicitly set in the spring force-directed graph generation and decision tree induction algorithms.
3.4.4. Decision tree induction
Binary decision trees are induced over the data matrix, as an aid to identifying the most closely related languages, and the reasons for their similarity. Decision tree induction over the consonant data is indeterminate, since several features can have the same variance. For this induction, with an external call to the graph generation software GraphViz, which implements several visualisation algorithms, including the neato spring force-directed algorithm (Gansner et al., 2000, 2005; North, 1992). Options for the other visualisations besides neato are also provided for demonstration purposes.
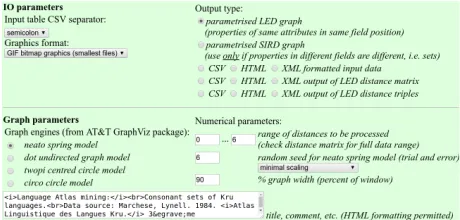
distance algorithm, spring force strength and random seed, as well as various output options and formats (e.g. virtual map type, Low Variance Filter table, distance table, distance triples, range of distances to be displayed).
Figure 3: Input parameters of the DistGraph tool.
For the data formats used in the online tool it is sufficient to use the more general Levenshtein Edit Distance measure rather than providing a choice between this and the Hamming Distance.
In addition to the generated outputs, a tabular summary of the parameter settings is provided (Table 1).
Data matrix: 19 entities × 44 properties
Input CSV separator: ;
The generated output includes the Low Variance Filter table (not currently parametrised), and the selected output, essentially: (1) as virtual map with histogram of virtual distance distributions table of mean virtual distances, plus a table of the pairwise sets of differing consonants, or (2) the selected virtual distance tables in different formats. In order to avoid server overload and security issues, file upload is not permitted; instead, the CSV table is pasted into a textarea input field and transmitted to the server-side application via CGI, together with the selected parameter settings. This is not ‘Big Data’ technology but adequate for the purpose. For the same reason, but in order to facilitate multi-user functionality, the output graphs are stored temporally for a short period of time as PNG files with process-specific filenames.
For development purposes and to handle large data sets and batch processing there is an offline version of the tool.
4. Application: results and discussion
The Levenshtein Edit Distance index (here identical to the Hamming Distance index), which was described in Subsection 3.3, is applied pairwise in order to determine the differences between the consonant inventories, interpreted as distances.Each langugage is compared pairwise with each other language, with 171 comparisons for the entire set of 19 languages, i.e. (n2-n)/2. The immediate result of the
pairwise comparison of the consonant inventories of the
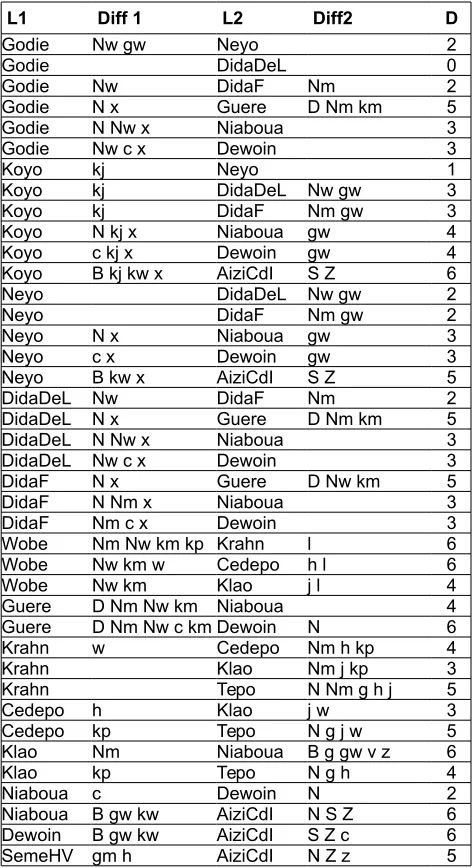
Kru languages using the Hamming Distance measure is a distance relation, shown in triple format in Table 2, only for distances 1…4, yielding 50 pairs within these distances. The list of distances shows that several languages are very closely related in respect of their consonant inventories, and that two, Godie and Dida de Lozoua, have identical inventories. Table 2: Kru language distance relation for LED range 1...6.
The Levenshtein Edit Distance for all 171 distances between the Kru consonant inventories is expressed more compactly as a distance matrix in Table 3.
B
Table 3: Kru virtual distance matrix (all distances).
the mean distance of each langauge to all other languages (Table 4), which is an index of ‘centrality’ or ‘core status’. The core languages have on average a distance to other languages of only 6, while the peripheral languages have up to 13 differences on average (the minimum distance for this set is 0 and the maximum is 19).
Language Mean distance
Language Mean distance
Neyo 6.000 AiziCdI 8.167
Bete 6.278 Krahn 8.389
Niaboua 6.278 Guere 8.611
Dida de L 6.667 Seme 9.000
Dida-F 6.667 Cedepo 9.278
Godie 6.667 Bassa 9.722
Dewoin 6.944 Wobe 10.000
Koyo 6.944 Grebo 11.556
Klao 7.167 Kuwaa 13.500
Tepo 7.833
Table 4: Pairwise mean distances between each Kru language and the other 18 Kru languages.
The virtual distance does not necessarily correspond to geographical distance, of course, though Kuwaa, the only language in the set which is located in Liberia, has the greatest mean virtual distance, which is no doubt not entirely a coincidence, and it is presumably also not a coincidence that the two languages which are geographically furthest apart, Kuwaa, located in Liberia, and Seme, located in Burkino Faso, show the greatest virtual distance. As already noted, virtual-geographical distance correspondence is not explicitly addressed at the current stage of the work, however.
The mean distance table (Table 4) has some expressive power, but not a great deal. Currently more suitable advanced clustering criteria are being implemented. As a first step, the issue of dimensionality reduction, from 44 features (i.e. consonants) to a dimensionality which can be represented in a 2-dimensional graph. This is done in three ways, as already noted: using the neato spring-force algorithm for the representation of the result graphically as a virtual map, selecting features by variance ranking, and ranking by decision trees.
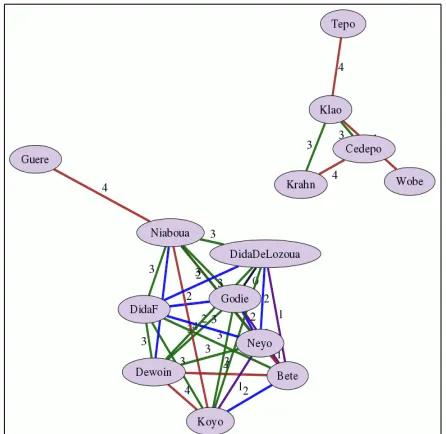
The online tool permits parametrisation of the distance range to be displayed, and Figure 4 shows a virtual map based on the range 0…4. A display of all 15 distances in a small printed graphic turns out to be unreadable.
The initial result is that the Kru languages are grouped at this distance level into two main groups, shown in Figure 4 at bottom left and top right. These groups correspond to the initial language atlas classification into Eastern Kru (the bottom left group) and Western Kru (the top right group). The distances shown on the virtual map do not necessarily correspond to geographical distances, though these subsets of the Kru languages are indeed geographically separated. The upper submap contains 5 of the Western Kru languages; there are no distances below 3 in the consonant systems of these language, showing a
higher degree of heterogeneity than among the more homogeneous consonant systems of the Eastern Kru languages.
Figure 4: Virtual map of Kru languages, distances 0 ... 4.
Figure 5: Virtual map of Kru languages, distances 0 ... 8.
not appear until distance 10, with a maximum distance of 19.
Figure 6: Decision tree for main distinguishing consonants in Eastern Kru languages (Bete, Dida de Lozoua, Dida-f, Godie, Koyo).
The second approach to dimensionality reduction is by feature selection based on the Low Variance Filter method. Items with high variance may be retained for further use (depending on the required dimensionality), while items with low variance are discarded. According to this criterion, the consonants which do not occur in all inventories are ranked as follows from high to low variance (as IPA glyphs): [ , z, ŋ, v, x, ŋ w, ŋ m , gw , h,ɓ
g, kw, j, kp, km, hw, c, , w, nd, n , mb, l, kj, hn, hm, hl,ʃ ɟ
gm, gb, dj, , ŋ mgb, ŋ g, ]. The consonants [t, s, p , n,ʒ ɗ
m, k, f, d, b, , ] ɲ ɟ occur in all inventories and thus have zero variance. These dimensions can therefore be ignored.
The third approach to dimensionality reduction is taken by checking the relative importance of the features (consonants) in the comparisons using decision trees as a basic form of machine learning (Figure 6). The data set is not ‘big’, but when more features and the other languages of Côte d’Ivoire are included at a later date, other machine learning methods will also be needed.
The decision tree algorithm uses a version of the Low Variance Filter method in order to determine priorities among consonants in terms of their discriminatory power. Several consonants in the inventories have more or less equally high variance, and consequently several decision trees were generated for the set; the decision tree shown in Figure 6 is one of this set.
As a step towards the induction of rules stating systematic sound changes, a table of pairwise differing consonant sets is also generated (Table 5). The differing consonant sets are in general unrelated in terms of the component features of the consonants, and their status, for example as a result of phoneme split and phonematisation of allophones will be the subject of further descriptive
Table 5: Pairwise sets of differing consonants (set union minus set intersection).
5. Conclusion and current developments
The online tool has been applied initially to the Kru languages of Côte d’Ivoire, adding an additional layer of information to the data. The results concur in general with the manual analyses included in the sketch descriptions of the legacy atlas resource, but not in all cases, and provide additional information as a result of computational atlas mining.In addition to enhancing traditional language comparison methods with additional computed results, the overall objective of increasing the efficiency of language comparison in relation to traditional manual methods has been achieved: once the data matrix has been prepared and entered, all results are immediately available online.
The following further developments are being undertaken within the project:
1. decomposition of consonants into distinctive features in order to enhance both granularity and interpretability of distance measurement;
2. inclusion of other linguistic features in addition to phonological features (lexical and grammatical);
3. extension of the scope of the investigation to all four language groups of Côte d’Ivoire;
4. inclusion of further machine learning procedures in order to handle larger data sets and to induce more detailed language relationships. Documentation: Language in cultural context project, and not least to the reviewers who were very undeservedly kind to the initially submitted version of this paper, and helpfully pointed out several sources of potential misunderstanding.
7. Bibliographical References
Gansner, Emden R. and Stephen C. North. 2000. An open graph visualization system and its applications to software engineering. In: Software – Practice and Experience, 30 (11) 1203—1233.
Gansner, Emden R., Yehuda Koren, and Stephen North. 2005. Graph Drawing by Stress Majorization. Lecture Notes in Computer Science 3383, pp 239-250.
Jäger, Gerhard. 2012. Estimating and visualizing language similarities using weighted alignment and force-directed graph layout. Proceedings of LINGVIS & UNCLH, Workshop at the European Association for Computational Linguistics 2012, Avignon.
Kamada, Tomihisa and Satoru Kawai. 1989. An algorithm for drawing general undirected graphs. Information Processing Letters 31:1, April 1989.
Kipré, Blé François. 1989. Morphophonologie und Morphotonologie der Nominalphrase einer Kru-Sprache: (Bete der Mundart von Daloa).
Lewis, M. Paul, Gary F. Simons and Charles D. Fennig, eds. 2015. Ethnologue: Languages of the World, 18th edition. Dallas, TX: SIL International. Online version: http://www.ethnologue.com.
van der Maaten, Laurens J. P., Postma, Eric O. van den Herik, and H. Jaap. 2009. Dimensionality Reduction: A Comparative Review. Tilburg University: Technical Report TiCC TR 2009–005.
Marchese, Lynell. 1984. Atlas linguistique kru. Agence de coopération culturelle et technique, Université
d'Abidjan, 3ème éd.
Nerbonne, John and William Kretzschmar Jr., eds. 2003. Computational Methods in Dialectometry. Special issue of Computers and the Humanities, 37(3).
North, Stephen C. 1992. neato User's Guide. AT&T Bell Laboratories Murray Hill, NJ.
Petroni, Filippo and Maurizio Serva. 2010. Measures of lexical distance between languages. Physica A 389, 2280-2283.
Rybicki, Jan and Maciej Heidel. 2013. The stylistics and stylometry of collaborative translation: Woolf’s Night and Day in Polish. Literary and Linguistic Computing 28, 708-717.
8. Language Resource References
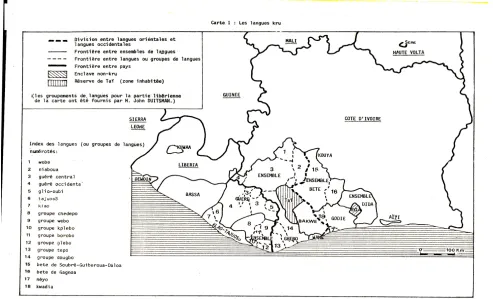
The metadata, data and value-added information are currently being archived on the project website5, and will be submitted to longer-term archives at the end of the project.9. Appendix: Geographical Sketch Map
The Kru language atlas includes hand-drawn sketch maps of the approximate geographical locations of the Kru languages. Although the map does not fulfil modern requirements based on geolocations, it is nevertheless useful in gaining insights into the geographical locations of the languages whose virtual distances are discussed in the present study. The raw scan of the original is of dubious reproduction quality, and therefore a slightly post-processed scan of the map is included (Figure 7).The dark dividing line through the Kru language area indicates the division into Western Kru and Eastern Kru, based on linguistic analysis. The Liberian isolate Kuwaa is located to the West, the Burkina Faso isolate Seme is located to the North-East, and the Côte d’Ivoire isolate Aïzi is located to the East of the other languages.