A Monthly Double-Blind Peer Reviewed Refereed Open Access International e-Journal - Included in the International Serial Directories International Journal in Management and Social Science
http://www.ijmr.net.in email id- [email protected] Page 665
CHEMINFORMATICS METHOD OF PREDITING THE
BIOLOGICAL ACTIVITY OF PHYTOCHEMICALS BASED ON
THEIR STRUCTURE
R. Prathipa
Assistant Professor, Department of Chemistry, Sree Sakthi Engineering College,
Karamadai, Coimbatore – 641 035, Tamilnadu, India
Abstract
A Monthly Double-Blind Peer Reviewed Refereed Open Access International e-Journal - Included in the International Serial Directories International Journal in Management and Social Science
http://www.ijmr.net.in email id- [email protected] Page 666
Once the real substituent and its descriptor are correlated to the biological activity, changing the descriptor would change in the potency and activity of the compounds biological activity.
1. Introduction
The QSAR is highly predictive and statistical. It tries to correlate certain physical and chemical properties to its biological activities. But biological activity of a compound is not defined by the physicochemical properties alone. The absorption, transport and metabolism of the substance in vivo condition are controlled by several unpredictable factors. Therefore the QSAR analysis though very powerful in prediction in establishing the inter relationship of structure to property, the application in vivo rest upon clinical trials. But still the cheminformatic approach eliminates the initial phase of screening the chemicals in the laboratories. Several thousands of compounds can be screened computationally in few hours.
1.1. Cheminformatics:
Cheminformatics is transforming the data into information and information into knowledge for the intended purpose of making better decisions faster in the area of drug lead identification and optimization.
1.1.1 File Formats:
The chemical structure and descriptors data are maintained in certain file formats so that all computer systems and operating systems can recognize them and render the appropriate details on the computer screen and calculations.
Chemical structures are represented In silico using formats such as XML based chemical Markup language or SMILES. These representations are often used for storage in large chemical databases.
1.1.2 Molecular Similarity:
A Monthly Double-Blind Peer Reviewed Refereed Open Access International e-Journal - Included in the International Serial Directories International Journal in Management and Social Science
http://www.ijmr.net.in email id- [email protected] Page 667
2. Data Source
Biologically active Phytochemicals, are from a group of fungi known as Aphyllophorales. These are commonly called Polypores. Eighty-eight phytochemical substances originated from 34 species of wood rotting fungi are chosen for cheminformatic analysis. Phytochemicals chosen for cheminformatic analysis rendered into 2D and 3D files. The structures are drawn by using free stand alone software known as Chemsketch. The structures are cleaned and 3D atomic coordinates are created using the same software and saved as MD. mol file.
PASS prediction server is capable of predicting the biological effects and mechanism of action of the compounds based on the structural features.The SMILE notation of the compounds is submitted to the online server one at time. The PASS results provide us two values for the said compound. These are Pa and Pi values.
Pa indicates the Probability of predicted activity and Pi indicates the Probability of Predicted absence of said activity. The difference in the Pa and Pi values gives us the actual activity value. It is said that valued above 5-7 are reliable. PASS results for cyclophellitol is shown below.
PASS Result Cyclophellitol taken from Phellinus sp.,
Effects Mechanism
23 Substructure descriptors; 0 new.
Glucosylceramidase inhibitor
67 Possible activities at Pa > 50%
Pa Pi for Activity:
0.943 0.005 Phosphatase inhibitor
0.904 0.022 Hematotoxic
0.878 0.005 Glycerol-1-phosphatase inhibitor
EFFECTS
0.535 0.019 Antiviral
0.535 0.01 Antiviral (Herpes)
A Monthly Double-Blind Peer Reviewed Refereed Open Access International e-Journal - Included in the International Serial Directories International Journal in Management and Social Science
http://www.ijmr.net.in email id- [email protected] Page 668
0.515 0.035 Antiviral (Influenza)
0.515 0.035 Immunostimulant
0.515 0.031 Antiviral (HIV)
MECHANISMS
0.943 0.005 Phosphatase inhibitor
0.943 0.005 Antineoplastic
0.878 0.005 Glycerol-1-phosphatase inhibitor
0.863 0.008 CDP-diacylglycerol-glycerol-phosphate 3-posphatidyltransferaseinhibitor
0.855 0.003 Chitinase inhibitor
Among 88 compounds when analyzed using PASS prediction values only 33 compounds show phosphatase activity and 14 compounds possess limonene synthestase inhibition activity among them some are listed in Table 1 which is shown below.
Types Name of the molecule
PASS Prediction
Result
Class generated for activity
li
mon
e
n
on
A
c
ti
v
ity
3 Acetyloxylanosta 8,24 Dien 21
oic Acid.mol 0.866 Medium
Bisabolol.mol 0.945 High
Ganodermadiol.mol 0.802 Low
Ph
osp
h
at
ase
A
ct
ivi
ty
Albaconol.mol 0.85 Medium
Corolin.mol 0.938 High
A Monthly Double-Blind Peer Reviewed Refereed Open Access International e-Journal - Included in the International Serial Directories International Journal in Management and Social Science
http://www.ijmr.net.in email id- [email protected] Page 669
Table 1
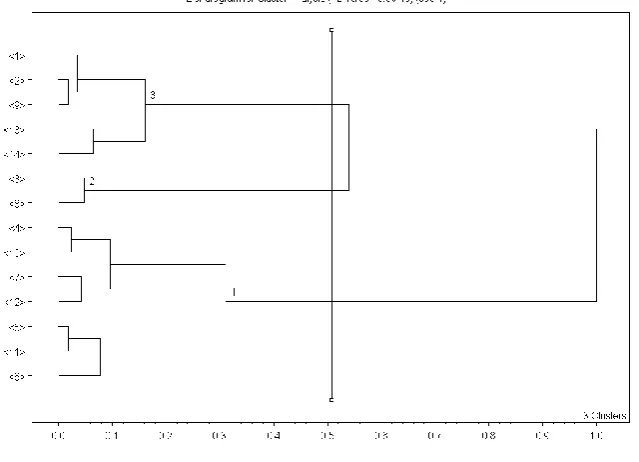
Cluster analysis of molecules showing limnonene synthetase inhibitor activity
based on certain physical parameters
.
Figure 1
Regression analysis of limonene synthestase inhibition activity with
varying molecular descriptors
The 14 compounds possessing limonene synthestase activity are segregated into 2 clusters as identified in cluster analysis experiment (Figure 1) and were loaded into the TSAR as a separate project. Eleven parameters encompassing steric, lipophilic and electronic parameters are calculated. Regression analysis was carried out and the results are presented in the table 2.
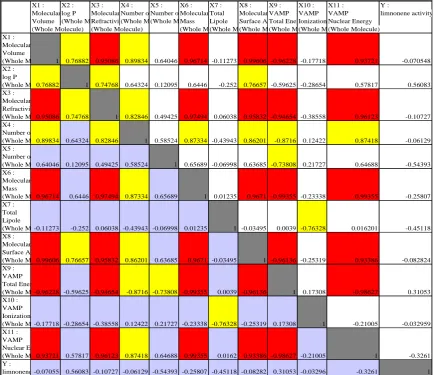
Table 3, are results of correlation between 11 parameters and biological activity of two groups of compounds for cluster 1.
It is clear that log P and VAMP total energy parameters correlate well with limonene synthestase inhibition activity. The figure 2 & 3, represents the correlation graph of members of the group positive correlation is evident.
It can be concluded that the log P and Total energy of the compounds are the major contributing factors for the said biological properties.
A Monthly Double-Blind Peer Reviewed Refereed Open Access International e-Journal - Included in the International Serial Directories International Journal in Management and Social Science
http://www.ijmr.net.in email id- [email protected] Page 670
Table2: correlation between the eight physical parameters and
limnonene synthetase inhibitor activity.
X1 : X2 : X3 : X4 : X5 : X6 : X7 : X8 : Y :
Molecular log P Molecular Number of H-bond DonorsNumber of H-bond AcceptorsMolecular Total Molecular limnonene activity Volume (Whole Molecule)Refractivity(Whole Molecule)(Whole Molecule)Mass Lipole Surface Area
(Whole Molecule) (Whole Molecule) (Whole Molecule)(Whole Molecule)(Whole Molecule) X1 : Molecular Volume (Whole Molecule) X2 : log P (Whole Molecule) X3 : Molecular Refractivity (Whole Molecule) X4 :
Number of H-bond Donors (Whole Molecule) X5 :
Number of H-bond Acceptors (Whole Molecule) X6 : Molecular Mass (Whole Molecule) X7 : Total Lipole (Whole Molecule) X8 : Molecular Surface Area (Whole Molecule) Y : limnonene activity -0.1561 -0.10941 0.365 -0.15165 -0.31829 -0.35773 -0.21781 -0.12833 -0.1561 1
0.50756 0.96959 0.01413 1 0.98663 0.68047 0.96548 0.50551
-0.21781
-0.04483 -0.16031 0.07398 -0.07932 0.10332 0.05364 1 0.01413 -0.12833 0.52977 1 0.05364 0.96959
0.97274 0.55267 0.97403 0.45422
-0.31829 0.46541 -0.01111 0.35891 0.54085 1 0.52977 0.10332 0.50756 -0.35773
0.54085 0.45422 -0.07932 0.50551 0.47034 0.39023 0.41228 1
0.365
0.96308 0.66907 1 0.41228 0.35891 0.97403 0.07398 0.96548 -0.15165 0.98663 -0.10941 0.67614 1 0.66907 0.39023 -0.01111 0.55267 -0.16031 0.68047
0.47034 0.46541 0.97274 -0.04483 1 0.67614 0.96308
X1 : X2 : X3 : X4 : Y :
VAMP VAMP VAMP VAMP limnonene activity
Total EnergyTotal Molecular ChargeIonizational PotentialNuclear Energy (Whole Molecule)(Whole Molecule)(Whole Molecule)(Whole Molecule) X1 : VAMP Total Energy (Whole Molecule) X2 : VAMP
Total Molecular Charge (Whole Molecule) X3 : VAMP Ionizational Potential (Whole Molecule) X4 : VAMP Nuclear Energy (Whole Molecule) Y :
limnonene activity0.15168 - -0.00577 -0.11788 1
-0.0057711
-0.97093 - -0.27964 1 -0.11788
0.2773 - 1 -0.27964
-0.97093 0.15168
- - - -
A Monthly Double-Blind Peer Reviewed Refereed Open Access International e-Journal - Included in the International Serial Directories International Journal in Management and Social Science
http://www.ijmr.net.in email id- [email protected] Page 671
Table 3: Correlation between eleven Physical Parameters and
Limnonene Synthetase Inhibitor Activity for Cluster 1.
X1 : X2 : X3 : X4 : X5 : X6 : X7 : X8 : X9 : X10 : X11 : Y :
Molecular log P Molecular Number of H-bond DonorsNumber of H-bond AcceptorsMolecular Total Molecular VAMP VAMP VAMP limnonene activity Volume (Whole Molecule)Refractivity(Whole Molecule)(Whole Molecule)Mass Lipole Surface AreaTotal EnergyIonizational PotentialNuclear Energy
(Whole Molecule) (Whole Molecule) (Whole Molecule)(Whole Molecule)(Whole Molecule)(Whole Molecule)(Whole Molecule)(Whole Molecule) X1 : Molecular Volume (Whole Molecule) X2 : log P (Whole Molecule) X3 : Molecular Refractivity (Whole Molecule) X4 :
Number of H-bond Donors (Whole Molecule) X5 :
Number of H-bond Acceptors (Whole Molecule) X6 : Molecular Mass (Whole Molecule) X7 : Total Lipole (Whole Molecule) X8 : Molecular Surface Area (Whole Molecule) X9 : VAMP Total Energy (Whole Molecule) X10 : VAMP Ionizational Potential (Whole Molecule) X11 : VAMP Nuclear Energy (Whole Molecule) Y :
limnonene activity -0.03296 -0.3261 1
-0.3261 -0.07055 0.56083 -0.10727 -0.06129 -0.54393 -0.25807 -0.45118 -0.08282 0.31053
0.93386 -0.98627 -0.21005 1
1 -0.21005 -0.032959
0.93721 0.57817 0.96123 0.87418 0.64688 0.99355 0.0162
0.31053
-0.17718 -0.28654 -0.38558 0.12422 0.21727 -0.23338 -0.76328 -0.25319 0.17308
-0.96136 1 0.17308 -0.98627
-0.25319 0.93386 -0.082824
-0.96228 -0.59625 -0.94654 -0.8716 -0.73808 -0.99355 0.0039
-0.45118
0.99606 0.76657 0.95832 0.86201 0.63685 0.9671 -0.03495 1 -0.96136
-0.03495 0.0039 -0.76328 0.016201
-0.23338 0.99355 -0.25807
-0.11273 -0.252 0.06038 -0.43943 -0.06998 0.01235 1
-0.54393
0.96714 0.6446 0.97494 0.87334 0.65689 1 0.01235 0.9671 -0.99355
0.63685 -0.73808 0.21727 0.64688
0.12422 0.87418 -0.06129 0.64046 0.12095 0.49425 0.58524 1 0.65689 -0.06998
-0.10727 0.89834 0.64324 0.82846 1 0.58524 0.87334 -0.43943 0.86201 -0.8716
0.95832 -0.94654 -0.38558 0.96123
-0.28654 0.57817 0.56083
0.95086 0.74768 1 0.82846 0.49425 0.97494 0.06038
-0.070548 0.76882 1 0.74768 0.64324 0.12095 0.6446 -0.252 0.76657 -0.59625
0.99606 -0.96228 -0.17718 0.93721 0.89834 0.64046 0.96714 -0.11273
A Monthly Double-Blind Peer Reviewed Refereed Open Access International e-Journal - Included in the International Serial Directories International Journal in Management and Social Science
http://www.ijmr.net.in email id- [email protected] Page 672
Figure 2.Showing the correlation between VAMP total energy and
limnonene synthetase inhibitor activity cluster 1
Figure 3.Showing the correlation between log P and limnonene
synthetase inhibitor activity cluster 1.
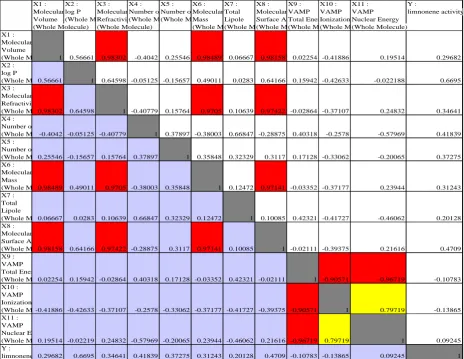
Table 4. Correlation between eleven Physical Parameters and
Limonene Synthetase Inhibitor Activity for Cluster 2
X1 : X2 : X3 : X4 : X5 : X6 : X7 : X8 : X9 : X10 : X11 : Y :
Molecular log P Molecular Number of H-bond DonorsNumber of H-bond AcceptorsMolecular Total Molecular VAMP VAMP VAMP limnonene activity Volume (Whole Molecule)Refractivity(Whole Molecule)(Whole Molecule)Mass Lipole Surface AreaTotal EnergyIonizational PotentialNuclear Energy
(Whole Molecule) (Whole Molecule) (Whole Molecule)(Whole Molecule)(Whole Molecule)(Whole Molecule)(Whole Molecule)(Whole Molecule) X1 : Molecular Volume (Whole Molecule) X2 : log P (Whole Molecule) X3 : Molecular Refractivity (Whole Molecule) X4 :
Number of H-bond Donors (Whole Molecule) X5 :
Number of H-bond Acceptors (Whole Molecule) X6 : Molecular Mass (Whole Molecule) X7 : Total Lipole (Whole Molecule) X8 : Molecular Surface Area (Whole Molecule) X9 : VAMP Total Energy (Whole Molecule) X10 : VAMP Ionizational Potential (Whole Molecule) X11 : VAMP Nuclear Energy (Whole Molecule) Y :
limnonene activity -0.13865 0.09245 1
0.09245 0.29682 0.6695 0.34641 0.41839 0.37275 0.31243 0.20128 0.4709 -0.10783
0.21616 -0.96719 0.79719 1
1 0.79719 -0.13865
0.19514 -0.02219 0.24832 -0.57969 -0.20065 0.23944 -0.46062
-0.10783
-0.41886 -0.42633 -0.37107 -0.2578 -0.33062 -0.37177 -0.41727 -0.39375 -0.90571
-0.02111 1 -0.90571 -0.96719
-0.39375 0.21616 0.4709
0.02254 0.15942 -0.02864 0.40318 0.17128 -0.03352 0.42321
0.20128
0.98158 0.64166 0.97422 -0.28875 0.3117 0.97141 0.10085 1 -0.02111
0.10085 0.42321 -0.41727 -0.46062
-0.37177 0.23944 0.31243
0.06667 0.0283 0.10639 0.66847 0.32329 0.12472 1
0.37275
0.98489 0.49011 0.9705 -0.38003 0.35848 1 0.12472 0.97141 -0.03352
0.3117 0.17128 -0.33062 -0.20065
-0.2578 -0.57969 0.41839 0.25546 -0.15657 0.15764 0.37897 1 0.35848 0.32329
0.34641 -0.4042 -0.05125 -0.40779 1 0.37897 -0.38003 0.66847 -0.28875 0.40318
0.97422 -0.02864 -0.37107 0.24832
-0.42633 -0.022188 0.6695
0.98302 0.64598 1 -0.40779 0.15764 0.9705 0.10639
0.29682 0.56661 1 0.64598 -0.05125 -0.15657 0.49011 0.0283 0.64166 0.15942
0.98158 0.02254 -0.41886 0.19514 -0.4042 0.25546 0.98489 0.06667
A Monthly Double-Blind Peer Reviewed Refereed Open Access International e-Journal - Included in the International Serial Directories International Journal in Management and Social Science
http://www.ijmr.net.in email id- [email protected] Page 673
A Monthly Double-Blind Peer Reviewed Refereed Open Access International e-Journal - Included in the International Serial Directories International Journal in Management and Social Science
http://www.ijmr.net.in email id- [email protected] Page 674
CONCLUSION
In their investigation 88 chemical compounds known to be biologically active are taken from literatures for QSAR study. Using cheminformatics tools both specific biological activity and physico chemical parameters are quantified. Using the quantified values multiple regression analysis was performed. This analysis revealed several interesting information’s that could be put into knowledge based drug discovery.
Three biological properties were recognized and quantified in these 88 compounds. Some of them showed strong phosphatase inhibition activity, and others showed limonene synthestase inhibition. Some of the compounds possessed all the three activities together, though in varying extends.
A strong positive correlation between log p value and some what weak relation with molecular total energy and limonene synthestase activity. Most conclusive results are obtained only with compared showing pulmonary hypertension activity with certain parameters.It is surprising that a hydrogen donor number increase positively correlated well with pulmonary hypertension activity in ane cluster, while it is exactly opposite in another cluster.
It is known that both 11 donors and 11 acceptors should be well within 5 numbers for a good drug. It is one of the 4 major canons of lipinskeys rule of 5.What is interesting here is in one set of compounds hydrogen donor number has strong relation while it is hydrogen acceptor is another. As the correlation, value is very close to 1 it is to be considered seriously. There is not an iota of doubt that manipulating such characters would bring about highly potent lead molecule.
REFERENCES
1.Lewell, X.Q. et al.; RECAP � retro synthetic combinatorial analysis procedure: a powerful new technique for identifying privileged molecular fragments with useful applications in combinatorial chemistry. J. Chem. Inf. Comput. Sci. 1998, 38, 511-522
2.Schneider, G. et al.; De novo design of molecular architectures by evolutionary assembly of drug-derived building blocks. J. Comput.-Aided Mol. Des. 2000, 14, 487-494
A Monthly Double-Blind Peer Reviewed Refereed Open Access International e-Journal - Included in the International Serial Directories International Journal in Management and Social Science
http://www.ijmr.net.in email id- [email protected] Page 675
4.All-Orientation Search and All-Placement Search in Comparative Molecular Field Analysis.Wang, R.; Gao, Y.; Liu, L.; Lai, L. J. Mol. Modeling, 1998, 4, 276-283.
5.A New Empirical Method for Structure-Based Estimation of Binding Affinities Wang, R.; Liu, L.; Lai, L.; Tang, Y. J.Mol.Modeling, 1998, 4, 379-394.
6.Calculating Partition Coefficients of Peptides by the Addition Method Peng Tao, Renxiao Wang, and Luhua Lai. J. Mol. Model. 1999, 5, 189-195.
7. L. B. Kier and L. H. Hall, Quantitative Information Analysis: The New Center of Gravity in Medicinal Chemistry, Med. Chem. Res. 7, 335-339 (1997).
8.L. B. Kier, Molecular Orbital Theory in Drug Research, Academic Press, New York (1971).
9. L. B. Kier and L. H. Hall, Molecular Connectivity in Chemistry and Drug Research, Academic Press, New York (1976).
10. L. B.Kier and L. H. Hall, Molecular Connectivity in Structure-Activity Analysis, John Wiley, New York (1986).