University of South Carolina
Scholar Commons
Theses and Dissertations
2015
Relationships Between Law Enforcement
Officer-Involved Vehicle Collisions And Other Police
Behaviors
John Andrew Hansen University of South CarolinaFollow this and additional works at:https://scholarcommons.sc.edu/etd Part of theCriminology and Criminal Justice Commons
This Open Access Dissertation is brought to you by Scholar Commons. It has been accepted for inclusion in Theses and Dissertations by an authorized administrator of Scholar Commons. For more information, please [email protected].
Recommended Citation
RELATIONSHIPS BETWEEN LAW ENFORCEMENT
OFFICER-INVOLVED VEHICLE COLLISIONS
AND OTHER POLICE BEHAVIORS
by
John Andrew Hansen
Bachelor of Science
University of South Carolina, 2004
Master of Arts
University of South Carolina, 2008
Submitted in Partial Fulfillment of the Requirements
For the Degree of Doctor of Philosophy in
Criminology and Criminal Justice
College of Arts and Sciences
University of South Carolina
2015
Accepted by:
Geoffrey P. Alpert, Major Professor
Robert W. Brame, Committee Member
Jeffrey J. Rojek, Committee Member
Scott E. Wolfe, Committee Member
DEDICATION
This work is dedicated to my family, who has supported me in this and all other
endeavors. My mom and dad, Bonnie and John, raised me to think about others and work
hard. Ben has always been an encouraging and patient brother. Kloo is my partner in life
and I am fortunate to have her beside me. I appreciate their love more than words can
ACKNOWLEDGEMENTS
This study would not have been possible without the assistance of several people.
In the Prince George’s County Police Department, Assistant Chief Kevin Davis
supported this research and allowed access to the agency before being appointed Chief of
the Anne Arundel County Police Department (he was recently appointed Interim
Commissioner of the Baltimore Police Department). This project continued under the
leadership of PGPD Chief Mark Magaw, Deputy Chief Hank Stawinski, Mr. Carlos
Acosta, and Major Pete Eliadis. Sergeant Wendy Contic was a knowledgeable and
cheerful guide who helped me conduct the survey. FOP Lodge 89 President Dean Jones
provided a support letter that helped convince officers to participate.
Meeting with members of the CalPOST SAFE Driving Campaign was
motivational. Bureau Chief Dr. Bryon Gustafson welcomed me to the research group and
assisted our data collection while visiting agencies in California. POST Executive
Directors Paul Cappitelli and Bob Stresak and Assistant Executive Director Alan Deal
also facilitated my experiences researching officer-involved collisions in the state.
Many past and present members of the Department of Criminology and Criminal
Justice at the University of South Carolina have helped me over the years. Early in my
education, Drs. John Burrow and Mitch Miller took an interest in my undergraduate
studies. John worked with me on my thesis, while Mitch and Dr. Megan Kurlychek
helped me publish my first article. Dr. Mike Smith was chair when I returned for my
needed it most. Outside the department, the Office of Program Evaluation in the College
of Education was a wonderful group of people to look at education in the state with.
I am also grateful to my doctoral committee for their service. Drs. Geoff Alpert
and Jeff Rojek provided considerable support throughout my doctoral program. Geoff
always took the time to introduce me to his friends and colleagues at conferences and
meetings and to review my work. I was assigned to be Jeff’s teaching assistant at the
beginning of my master’s program and he involved me in many research projects over the
years. Geoff and Jeff have opened many doors for me and I am thankful. Dr. Scott Wolfe
agreed to serve on my committee before he even arrived at USC and I appreciate his
eagerness for research. I always feel better about my research and myself when I leave
the office of Dr. Robert Brame. The excitement Bobby has for his family and research is
ABSTRACT
Specialization and versatility regarding officer negative outcomes have different
implications for agency policies and practices. Versatility suggests interventions that
address several problematic behaviors, while specialization may necessitate more
targeted interventions. If officers who engage in one form of negative behavior are also
more likely to be involved in other undesired outcomes than co-monitoring behaviors via
early intervention systems or other mechanisms may be an effective means of identifying
problematic officers. The threat posed by officer-involved motor vehicle collisions to the
safety of police and the public has received increased attention from practitioners and
researchers in the past decade or so. However, we do not know if officers in negative
outcomes while on duty are also more likely to be in vehicle collisions. This study
examines these links with a survey of patrol officers and their supervisors in a large
police department. The findings demonstrate significant effects of citizen complaints for
reasons other than excessive force but none of the other negative officer outcomes on
collision involvement. In addition, off-duty collisions and secondary employment
consistently increase the likelihood of on-duty crashes. The policy implications of these
TABLE OF CONTENTS
DEDICATION ... iii
ACKNOWLEDGEMENTS ... iv
ABSTRACT ... vi
LISTOFTABLES ...x
LISTOFFIGURES ... xi
CHAPTER1:INTRODUCTION ...1
1.1 Motor Vehicle Collisions and Other Negative Officer Outcomes ...3
1.2 Goals and Overview of this Study ...7
CHAPTER2:POLICEOFFICER-INVOLVEDMOTORVEHICLECOLLISIONS ...11
2.1 The Relevance of Officer-Involved Vehicle Collisions ...11
2.2 The Costs of Officer-Involved Vehicle Collisions ...13
2.3 Explaining Officer-Involved Vehicle Collisions ...25
2.4 Conclusion ...32
CHAPTER3:LINKINGVEHICLECOLLISIONSTOOTHERNEGATIVEOFFICER OUTCOMES...34
3.1 The Relevance of Negative Officer Outcomes ...34
3.2 Negative Officer Outcomes in the United States ...37
3.3 Monitoring Co-Occurring Negative Officer Outcomes ...47
3.4 The Prevalence of Negative Officer Outcomes ...48
3.6 Conclusion ...79
CHAPTER 4: METHODOLOGY ...83
4.1 The Prince George’s County Police Department ...83
4.2 Data Collection ...95
4.3 Missing Data Strategy ...101
4.4 Description of Measures and Sample ...105
4.5 Analytic Strategy ...119
CHAPTER 5: RESULTS ...121
5.1 Any On-Duty Collision Involvement...121
5.2 On-Duty Collision Frequency ...125
5.3 Any At-Fault Collision Involvement ...133
5.4 At-Fault Collision Frequency ...136
CHAPTER6:DISCUSSIONANDCONCLUSION ...142
6.1 Summary of the Study ...142
6.2 Limitations and Future Directions ...145
6.3 Summary of Findings ...150
6.4 Implications for Policy and Practice ...159
6.5 Study Conclusion ...170
REFERENCES ...173
APPENDIXB:SURVEYCOVERLETTER ...194
APPENDIXC:SURVEYSUPPORTLETTER ...195
APPENDIXD:SURVEYINSTRUMENT ...196
LIST OF TABLES
Table 4.1. Sample description ...118
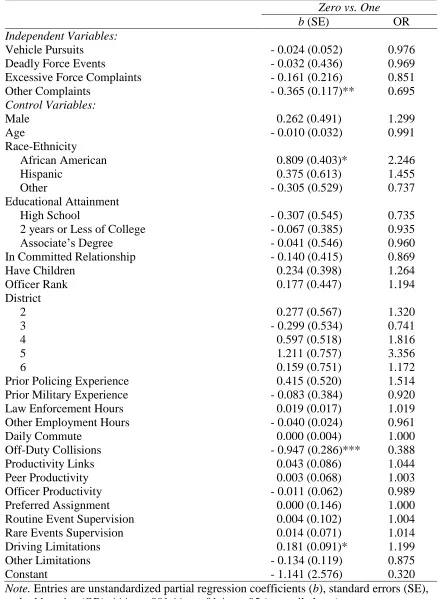
Table 5.1. Logistic regression of undesired events on on-duty collision involvement ....122
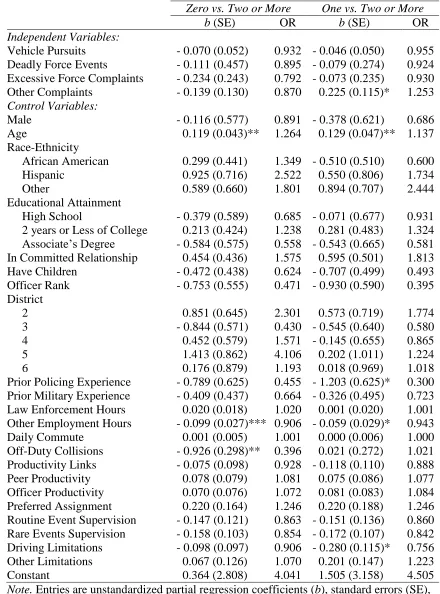
Table 5.2. Multinomial regression of undesired events on on-duty collision frequency .126
Table 5.3. Multinomial regression of undesired events on on-duty collision frequency .127
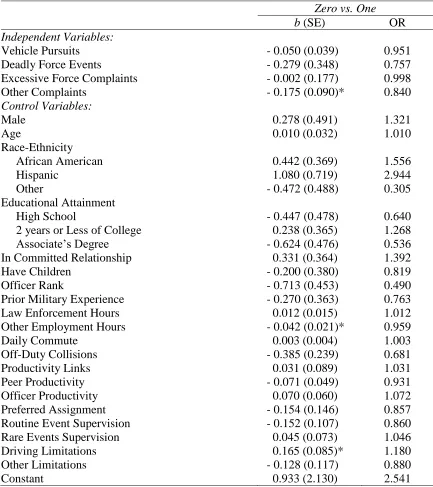
Table 5.4. Logistic regression of undesired events on at-fault collision involvement ....134
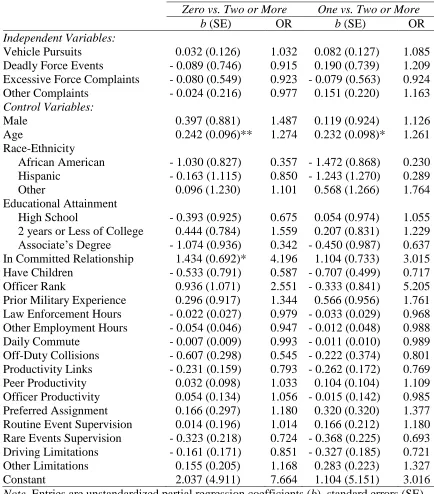
Table 5.5. Multinomial regression of undesired events on at-fault collision frequency ..137
Table 5.6. Multinomial regression of undesired events on at-fault collision frequency ..138
Table 6.1. Summary of significant effects on all on-duty collisions ...152
LIST OF FIGURES
Figure 2.1. FBI (LEOKA) data on all causes of officer deaths: 1994-2013 ...15
Figure 2.2. FBI (LEOKA) data on all causes of officer deaths: 2004-2013 ...16
Figure 2.3. FBI (LEOKA) data on accidental causes of officer deaths: 2004-2013 ...16
Figure 2.4. NLEOMF data on causes of officer deaths: 2004-2013 ...18
CHAPTER 1
INTRODUCTION
The amount of specialization in offending is a question with great significance for
the development of theories of crime and deviance1. Empirical evidence of specialization
suggests theoretical explanations should be able to account for observed differences in
offending behaviors. Developmental theories, such as Moffitt’s (1993) taxonomy that
assumes two groups of offenders, are appropriate for this task. On the other hand, if
individuals engage in varied manifestations of crime and deviance, an all-encompassing
framework such as self-control theory as explicated in Gottfredson and Hirschi’s (1990)
seminal text, A General Theory of Crime, may be better suited to explain their offending
behaviors. Decades of research on the generality of crime and deviance has established
that individuals tend not to specialize (Brame, Mulvey, Piquero, & Schubert, 2014;
Kempf-Leonard, 1987; Paternoster, Brame, Piquero, Mazerolle, & Dean, 1998; Piquero,
Paternoster, Brame, Mazerolle, & Dean, 1999; Sampson & Laub, 1993). However,
researchers have also demonstrated that versatility is not absolute and important
differences exist. For instance, Osgood & Schreck (2007) discovered a greater amount of
specialization among violent offenders than nonviolent offenders, and Lynam, Piquero,
and Moffitt (2004) found more violent specialization in self-report data than official
1 Paternoster, Brame, Piquero, Mazerolle, and Dean (1998) defined specialization as “the
records2. Overall, the criminological literature contains mixed evidence in support of both
general and developmental theories of crime and deviance.
Theoretical explanations of crime and deviance committed by police officers
specifically are not nearly as well developed. Sherman (1980) sought to develop “a
substantive theory of police behavior” (p. 94), and summarized quantitative research on
four police officer behaviors including violence, which he broadly defined as, “justified
and unjustified use of any physical force (including deadly force) against citizens” (p.
69). Black (1976, 1980) also took an encompassing approach when he explained the
conditions under which officers apply the law, while others have taken a narrower slant
and addressed particular behaviors such as racially-biased decision making (Smith &
Alpert, 2007). Still, a theory of negative police officer outcomes does not exist.
One key piece of information that is missing and hindering theories of negative
police officer behaviors concerns the question of specialization or generalization. We
simply do not know if officers involved in one type of concerning behavior are also more
likely to be in other negative outcomes while on duty. This information would be useful
in determining whether a theory of police deviance should be general in scope or specific
to a particular negative outcome. Specialization and versatility regarding police officer
negative outcomes have different implications with respect to law enforcement agency
policies and practices and therefore hold considerable significance for police practitioners
and policymakers. Versatility suggests that agencies may be able to design interventions
that address a wide range of problematic behaviors, while specialization may necessitate
more targeted interventions. If police officers who engage in one form of negative
behavior are also more likely to be involved in other undesired outcomes than
co-monitoring a wide range of behaviors via early intervention systems (EIS) or other
mechanisms may be an effective means of identifying problematic officers.
Police practitioners and policymakers are constantly balancing many demands
including protecting public and officer wellbeing as well as the image of police in
society. Today, threats to public safety and support of the police span historical concerns
such as deadly and excessive force and contemporary additions to the list of negative
officer outcomes such as officer-involved motor vehicle collisions. As leaders search for
methods of reducing newly recognized hazards and those that will continue emerging in
the future, evidence of empirical associations with more traditional concerns may offer
policy guidance by drawing on ideas from more established areas of research. For
instance, researchers have found that agencies with more restrictive policies have fewer
deaths from vehicle pursuits (Alpert, 1997; Crew, Kessler, & Fridell, 1994) and deadly
force incidents (Fyfe, 1979; Meyer, 1980; Sherman, 1983; Uelmen, 1973). It may be that
more restrictive policies are also an effective way of reducing other negative officer
outcomes as well.
Motor Vehicle Collisions and Other Negative Officer Outcomes
Police researchers and the American public have always paid close attention to
officer behaviors with the potential to threaten the lives and prosperity of fellow officers
and citizens. Research on negative police outcomes has centered on force broadly
speaking, more specifically deadly force, excessive force, and force that causes injuries.
Historical changes in the police institution and citizenry have shifted the scope of
to police that must be monitored. Among all of the potentially concerning police
outcomes that have been the subject of empirical investigation, it appears that motor
vehicle collisions have been overlooked in terms of the threat posed to the safety of
officers and the public. In recent years, police practitioners and researchers have
recognized that motor vehicle collisions are among the most harmful police behaviors. In
this way, motor vehicle collisions are similar to deadly and excessive force, vehicle
pursuits, and other negative officer outcomes that threaten citizen and officer safety and
undermine the legitimacy of police.
There are numerous pieces of evidence to support the hypothesis that officers in
motor vehicle collisions may also be disproportionately represented among other negative
outcomes including deadly force, citizen complaints, and vehicle pursuits. To begin, this
study was inspired by conversations with police leaders and policy makers who
speculated about the associations between officer-involved vehicle collisions and other
negative outcomes during 2012 and 2013 meetings of the California Commission on
Peace Officer Standards and Training (CalPOST) Situation-Appropriate, Focused, and
Educated (SAFE) Driving Campaign. The knowledge of experienced police officials
should not be discounted (Sparrow, 2011). This issue was also raised at the June, 2013
Maryland State Summit on Reducing Deaths, Disabilities, and Injuries to Maryland Law
Enforcement Officers Engaged in Traffic-Related Activities, which included police
executives and other delegates from the state and beyond who gathered to produce a
report to the Maryland Highway Safety Office. The agenda of discussion questions
included the following: “Does officer, deputy, and trooper behavior behind the wheel
driving safety alone?”, and “Should abuse of the police vehicle be treated in the same
way as abuse of force?”
Police agencies have co-monitored numerous negative officer outcomes for many
years in hopes of identifying and addressing potentially problematic employees. Early
intervention systems, a common mechanism used by agencies to identify problematic
officers, operate by monitoring numerous different behaviors at the same time including
use of force, deadly force, and citizen complaints (Alpert & Walker, 2000; Walker,
Alpert, & Kenney, 2001). Although it is relatively less common, some agencies also
include vehicle collisions in their EIS. Of course, agencies have received and investigated
citizen complaints regarding a variety of different behaviors for many years as well
(Rojek, Decker, & Wagner, 2015). The Prince George’s County (MD) Police Department
(PGPD), where this study was conducted, records citizen complaints as an open-ended
narrative (Prince George’s County, 1991), and ultimately categorizes them into nine
categories (Prince George’s County Citizen Complaint Oversight Panel, 2014). Many of
these categories are quite broad. For instance, “conduct related” complaints refer to
“excessive, unwarranted or unjustified behavior that reflects poorly on the officer the
department or on the county government, regardless of duty status. This category
includes allegations of misconduct, unbecoming conduct, and unreported misconduct”
(Prince George’s County Citizen Complaint Oversight Panel, 2014, p. A1). The approach
of monitoring comorbidities, or the co-occurrence of negative outcomes, is popular in
hospitals and the fields of medicine and public health. Finally, agencies have attempted to
and closer supervision and monitoring, all of which are tactics that have been used in the
past to address other negative outcomes including deadly force and vehicle pursuits.
Research on negative officer outcomes is often limited to one outcome such as
deadly force, citizen complaints, pursuits, and more recently motor vehicle collisions.
However, researchers of negative officer outcomes have tended to focus on the same
characteristics of officers, agencies, and situations—suggesting particular variables may
have predictive value across a variety of behaviors. For instance, researchers have
repeatedly pointed to demographic characteristics such as officer age and gender and
aspects of agency culture including supervision and enforcement of policies. Sherman
(1980) summarized quantitative research on detection activities, arrest decisions, service
behaviors, and violence, and his review of explanatory variables at the individual-,
situational-, organizational-, community-, and legal-level demonstrated overlap across
multiple officer behaviors many of which had been used to explain more than type of
officer behavior. One of the only studies to simultaneously consider officer involvement
in multiple negative outcomes was conducted in the NYPD by Fyfe and Kane (2006),
who reviewed files of terminated officers. Several studies based on that research have
found that officers involved in career-ending forms of misconduct were also more likely
than their peers to be involved in a range of other problematic on-duty behaviors (Kane &
White, 2013).
Research at the officer-level, such as that by Fyfe and Kane (2006), is based on
the repeated finding that negative outcomes are clustered within a small group of officers,
which have been termed “bad apples.” Although the reasons for this is debated, it has
outcomes in their agencies such as excessive force (Brandl, Stroshine, & Frank 2001;
Christopher Commission, 1991; Kolts Commission, 1992; Lersch, 1998b, 2002). The
Christopher Commission (1991) found that only 44 officers out of 8,450 officers
employed by the LAPD during their study had received 6 or more citizen complaints for
excessive force. Two-thirds of LAPD officers had received no force complaints over the
4 year study period (Christopher Commission, 1991). The clustering of problematic
behaviors among offenders has also been established (e.g., Braga, 2012; Chaiken &
Chaiken, 1984; Greenwood & Abrahamse, 1982; Peterson & Braiker, 1981; Williams &
Lucianovic, 1979; Wolfgang, Figlio, & Sellin, 1972). However, we do not know if the
small groups of officers causing negative outcomes in their agencies are specialists or
generalists. Walker et al. (2001) conducted a national study of early intervention systems
in the U.S. including case studies and reported, “It has become a truism among police
chiefs that 10 percent of their officers cause 90 percent of the problems” (p. 1). Motor
vehicle collisions also appear to be clustered within a small group of officers who cause a
disproportionate amount of the total crashes in their respective agencies. In their study of
844 officers in serious collisions, Rix, Walker, and Brown (1997) found that 233 (28
percent) had previously been in one other crash and 115 (14 percent) had been in three or
more vehicle collisions.
Goals and Overview of this Study
Today, officer-involved crashes continue to be a substantial yet under-examined
risk to both citizens and officers in the United States. The longstanding oversight among
the practitioner and researcher communities and recent recognition of the disastrous
supervisors in a position of scrambling for ideas to reduce these events. Among pressing
questions to police executives is the relationship between officer involvement in motor
vehicle collisions and undesired officer behaviors such as use of force, vehicle pursuits,
excessive force incidents, and other behaviors that have resulted in citizen complaints.
At its core, this study considers whether officers who cause harm with their
behind the wheel driving behaviors also disproportionately misuse other tools, weapons,
and powers granted to police but expected to be used judiciously. More specifically, this
study empirically examines whether officer involvement in vehicle pursuits, deadly force
incidents, and citizen complaints about a variety of officer behaviors increases the
likelihood of vehicle collisions. This study uses multivariate analyses to control for
potentially confounding variables and is broader than the question of specialization in
officer negative outcomes but it should shed light on this issue. As a group, the
concerning and potentially costly behaviors examined in this study are referred to as
negative outcomes, events, and behaviors throughout the following pages. Other terms
used by prior researchers could also encapsulate negative officer outcomes. For instance,
Barker and Carter (1994) defined police abuse of authority as “any action by a police
officer without regard to motive, intent, or malice that tends to injure, insult, trespass
upon human dignity, manifest feelings of inferiority, and/or violate an inherent legal right
of a member of the police constituency in the course of performing ‘police work’” (p. 7).
Certainly deadly and excessive force, vehicle crashes, and other negative outcomes have
tendencies to injure the public. Other researchers have used terms including officer or
employee misconduct, deviance, and crime (Kane & White, 2013; Kappeler, Sluder, &
general consensus among practitioners, researchers, the public, and other stakeholder
groups that deadly force, excessive force and other behaviors that result in citizen
complaints, and vehicle pursuits and crashes are socially undesirable and potentially
harmful events that should be limited whenever possible.
The perception that motor vehicle collisions are accidents presents a mental
roadblock to the idea that they represent negative behaviors and decision-making in the
same way as excessive force. Although motor vehicle collisions are often referred to as
accidents—a term which implies a random and unpredictable nature, it is clear that some
portion of these negative officer outcomes is preventable. For instance, 45.1 percent of
PGPD officers reported one or more collisions in this study, while 29.6 percent of
officers reported at least one at-fault collision. A NHTSA study of fatal officer-involved
collisions in the U.S. from 1982 to 2008 found 931 driver-related factors including
speeding among the 726 vehicles involved (Noh, 2011). CalPOST reported that one
driving behavior, operating motor vehicles at unsafe speeds, caused more than 1/3 of the
over 7,100 injury and fatality collisions from 1997 to 2007 in the state (Gustafson, 2009).
This study serves several purposes to the academic and practitioner communities
interested in police vehicle collisions. This research may open or close the door to
learning about officer-involved vehicle collisions from more established bodies of
research on other negative outcomes including deadly force, citizen complaints, and
vehicle pursuits. These outcomes have been the cause of considerable concern among the
public and have been monitored by police departments and risk managers in the United
States to detect problematic officers. It is unclear if these undesired behaviors can also be
assesses whether officers in negative on-the-job outcomes are disproportionately likely to
expose their employer to liability and other costs resulting from on-duty vehicle
collisions.
This study unfolds over the course of six chapters. Chapter Two reviews the
current state of knowledge regarding the impact and causes of officer-involved motor
vehicle collisions. Chapter Three justifies the importance of conducting research on
negative officer outcomes that threaten public including officer safety as well as trust
between the police and those they serve. Chapter Three also reviews the extant literature
on other negative officer outcomes, a body of literature that suggests commonalities
between involvement in these events and vehicle collisions. Chapter Four details the
methodological procedures utilized in this study. The site for this research, the Prince
George’s County (Maryland) Police Department, is described. Measurement of the
independent and dependent variables is noted and the missing data and analytical
strategies are detailed. Chapter Five provides the results of four regression models that
examine the impact of deadly force, complaints for excessive force and other reasons,
and vehicle pursuits on vehicle collisions among patrol officers in the PGPD. Finally,
Chapter Six summarizes the significant findings and discusses he policy implications in
terms of reducing officer-involved collisions in the PGPD and other law enforcement
CHAPTER 2
POLICE OFFICER-INVOLVED MOTOR VEHICLE COLLISIONS
It is necessary to justify undertaking this research before turning to the reasons
that police officer-involved vehicle collisions may be related to other negative outcomes.
Although little empirical research has been devoted to understanding the causes and
correlates of officer-involved vehicle collisions, the available research makes one thing
clear: officer-involved vehicle collisions are threats to public and officer safety. Chapter
Two begins with details of the human and financial costs of officer-involved vehicle
collisions in the United States. Next, Chapter Two reviews the extant literature that has
attempted to explain police crashes. Despite limited information about police crashes
relative to other negative officer outcomes, it later becomes clear that many of the same
causes have been implicated in numerous behaviors.
The Relevance of Officer-Involved Vehicle Collisions
Police behaviors with the potential to harm the public and fellow officers have
always been of paramount concern. The importance of harmful police officer behaviors is
a consequence of the vital and unique role of public police—reducing the overall amount
of disorder and acts that threaten the prosperity and safety of citizens. To accomplish
their goal, police officers are granted authority to use exceptional powers and tools. In the
United States, police are allowed in certain circumstances to use deadly force, detain and
arrest citizens, and disregard laws regarding motor vehicle operations on public
the extent required in accomplishing their mandate—any excesses introduce harm that
undermines the fundamental purpose of police. This agreement creates the foundation of
the police-public social contract, which is spelled out in state and federal legal codes,
agency policies, and court decisions. Perceived and actual violations of this trust have led
to some of the most significant acts of civil unrest in United States’ history.
As societal expectations of police have shifted, the officer behaviors that have
been scrutinized by the public, government, researchers, and other interested parties have
evolved as well. Concerns regarding officer behaviors focused on serious, deliberate
officer misdeeds such as brutality and corruption a century ago but have expanded and
incorporated events that are more commonly encountered in the daily activities of
officers. Increased attention has also been paid to behaviors that threaten officer safety in
the field, which have also shifted as technological advances have introduced new tools
and weapons for police officers and suspects. Many tools used by officers present
benefits in terms of officer and citizen safety but also hold the potential for misuse.
Notable examples have included firearms, oleoresin capsicum (OC) spray, and conducted
energy devices (CEDs) (i.e., Taser).
Perhaps the most significant technological advancement in policing over the past
century has been the motorized vehicle. However, the potential negative results of police
motor vehicle operations have not been accorded nearly as much attention as other
potentially harmful officer behaviors such as use of force in general. The proliferation of
motor vehicles in the general public during the early 20th century created a public safety
concern that quickly became a focus of the police (Richardson, 1974). The danger
reorganized agencies that dedicated a large portion of manpower and other resources to
traffic safety (Richardson, 1974). Motorized patrol became a ubiquitous part of policing
and a visible representation of police. The importance of patrol has increased as
American’s have continued to embrace automobile ownership as a vital part of daily life
and commerce. Over the years, police vehicles have provided sanctuaries from
unfavorable weather, a place to store essential weapons and communications devices, and
a means of transporting unruly suspects. Motor vehicles may reduce police response
times, expected to be impacted by travelling speeds to calls (Pate, Ferrara, Bowers, &
Lorence, 1976)3. However, the benefits of police motor vehicle operation must be
weighed against the foremost goal of citizen and officer safety because motor vehicle
collisions frequently cause great harm and suffering.
The Costs of Officer-Involved Vehicle Collisions
There is a lack of information available to conduct an ‘apples to apples’
comparison of the harm caused by motor vehicle collisions and other negative outcomes
such as excessive force incidents. In fact, there is an overall deficit in research on motor
vehicle collisions involving officers, a constant theme of this study. Estimates of the
number of officers killed in vehicles and on the streets of the United States are available
at the national level from two sources: the federal government and a non-profit.
Officer Fatalities
The primary source of national information about officers killed in the line of
duty is the Federal Bureau of Investigation’s (FBI’s) Law Enforcement Officers Killed
and Assaulted (LEOKA) program. Information regarding officers who have been killed
or assaulted is provided by city, county, state, university and college, tribal, and federal
law enforcement agencies participating in the FBI’s Uniform Crime Reporting (UCR)
program. Additional information on officers, suspects, and circumstances is provided by
FBI field offices and nonprofit groups including the National Law Enforcement Officers
Memorial Fund (NLEOMF). Data received by the FBI are ultimately classified into
officers feloniously killed and accidentally killed. Accidental deaths include officers
killed in falls, aircraft accidents, accidental shootings, and struck by vehicles. More
germane to this discussion are officers accidentally killed in automobile and motorcycle
collisions. For the purposes of this research, automobile and motorcycle deaths are
combined to measure officers killed operating motor vehicles.
Over the past 20 years, a total of 2,463 police officers died at work in the United
States, including 1,127 officers killed feloniously and 1,336 accidental deaths (FBI,
1995-2014). Fortunately, the LEOKA data show a decline in the total number of police
officers killed annually in the line of duty over this two decade period (see Figure 2.14).
This drop has occurred in spite of motor vehicle collisions, which do not display the
downward trend seen in felonious deaths. From 1994 to 2013, 874 police officers were
killed in motor vehicle collisions (758 in automobiles and 116 on motorcycles), while
1,127 died in assaults by suspects. On average, 43.7 officers were killed each year in
motor vehicles from 1994 to 2013, compared with 56.4 officers killed per year
feloniously during the same period. An average 35.2 percent of annual officer deaths in
the U.S. during the last 20 years were due to vehicle collisions. The largest number of
officers killed in crashes over this period was 60 in 2003 and the lowest was 27 in 2013.
In comparison, officers killed feloniously ranged from 79 in 1994 to 27 in 2013.
Figure 2.1. FBI (LEOKA) data on all causes of officer deaths: 1994-2013.
A more positive picture emerges over the past 10 years with respect to officer
fatalities as measured by the FBI (2005-2014) and shown in Figure 2.2. The trend of
decreasing fatal collisions becomes more evident and recent lows were observed in both
collision-related and felonious deaths. The downward trend in officer fatalities is more
easily observed in Figure 2.3, which excludes total officer deaths. The average number of
officers killed in crashes was 42.5 from 2004 to 2013, while the number of officers killed
by suspects was 51. The numbers of officers killed feloniously and in vehicle collisions
were equal in 2013 (27)—the safest year for police officers in the United States in
decades. Still, 37 percent of all officers killed on-duty from 2004 to 2013 were in 20
30 40 50 60 70 80 90 100 110 120 130 140 150 160
94 95 96 97 98 99 00 01 02 03 04 05 06 07 08 09 10 11 12 13
Feloniously Killed
Motor Vehicles
Figure 2.2. FBI (LEOKA) data on all causes of officer deaths: 2004-2013.
Figure 2.3. FBI (LEOKA) data on accidental causes of officer deaths: 2004-2013. 20 30 40 50 60 70 80 90 100 110 120 130 140 150 160
04 05 06 07 08 09 10 11 12 13
Feloniously Killed Motor Vehicles Total Deaths 20 25 30 35 40 45 50 55 60 65 70 75 80
94 95 96 97 98 99 00 01 02 03 04 05 06 07 08 09 10 11 12 13
Feloniously Killed
Another source of information regarding American officers killed in the line of
duty is the National Law Enforcement Officers Memorial Fund (2015), which maintains
a monument in Washington, D.C. and an online repository of information. In order to be
added to the memorial, nomination forms must be signed by agency heads and submitted
to a committee that reviews the cases for eligibility. Military police and correctional
officers are eligible only if they were performing normal law enforcement duties or were
recognized as law enforcement officers by their employers, respectively. Part time
officers are considered on a case by case basis. Annual figures on the number of officers
killed are available back to the 1791, but data on the causes of death are only available
for the past 10 years (NLEOMF, 2015).
According to the NLEOMF (2015), a total of 1,501 officers died in the line of
duty from 2004 to 2013. Of those, 504 officers were killed in motor vehicles, which
included 434 automobile deaths and another 70 motorcycle crash fatalities. Thus, 50
officers have died each year on average from automobile collisions in the United States
over the past decade, a higher figure than that found in the FBI’s LEOKA data. In
comparison, 548 officers were fatally shot, 14 were stabbed, 9 died from terrorist attacks,
8 were beaten, and 1 each were strangled and poisoned to death during the previous 10
year period, based on NLEOMF data. Approximately 33.6 percent of all officer deaths in
the U.S. from 2004 to 2013 according to the NLEOMF (2015) were motor vehicle
related. The number of officers killed in automobiles ranged from 32 in 2013 to 71 in
Figure 2.4. NLEOMF data on causes of officer deaths: 2004-2013.
Overall, the LEOKA and NLEOMF data provide slightly different estimates of
the numbers of officers killed due to differences in reporting procedures and eligibility
criteria. However, the overall picture of the prevalence of fatal officer involved collisions
is alarming: approximately one-third of annual officer deaths in the United States have
consistently been caused by motor vehicle collisions. Furthermore, officer motor vehicle
deaths have been declining in recent years to a low in 2013, but have not been declining
as quickly as deaths from other threats to officer safety.
Information on fatal officer-involved vehicle collisions is also available from the
National Highway Traffic Safety Administration (NHTSA), which has agreements with
state governments to provide information regarding fatal motor vehicle collisions that
take place on their roadways annually. Crash information is maintained in NHTSA’s
Fatality Analysis Reporting System (FARS). A report based on these data is published 20
30 40 50 60 70 80 90 100 110 120 130 140 150 160 170 180 190 200
04 05 06 07 08 09 10 11 12 13
Motor Vehicles
annually by NHTSA and includes involvement of emergency vehicles, which are
categorized as ambulances, fire trucks, or police vehicles. Information regarding
officer-involved vehicle collisions is limited in these annual reports but counts are provided of
the number of officers and civilians killed (see Table 2.5). In 2011, Noh conducted a
detailed analysis of officer-involved vehicle collisions in the U.S. from 1980 to 2008
based on the FARS data. Noh (2011) found that FARS consistently provided a lower
estimate of officer deaths due to motor vehicles than the LEOKA data due to different
definitions of police vehicles, a FARS requirement that death take place within 30 days
of collisions, and variations in state data filing procedures. Still, Noh (2011) reported that
trends in vehicle deaths from 1980 to 2008 were similar in the FARS and LEOKA data.
Officer Injuries
Much less information is available regarding officer-involved vehicle collisions
that have not resulted in one or more fatalities. The FBI’s LEOKA program only collects
data on officer injuries that result from assaults and so the number that have resulted from
vehicle crashes at the national level is unknown. Data from NHTSA’s FARS are limited
to fatalities. However, recent evidence has suggested that nonfatal collisions, some of
which result in serious, debilitating injuries to police officers and the public, are
concerning in scope. Wolfe, Rojek, Alpert, Tiesman, and James (2015) reported that 39
officers were killed in California but another 7,684 officers were injured in vehicle
collisions from January, 2000 to December, 2009. This equates to nearly 200 officers
injured for every 1 officer killed in California behind the wheel between 2000 and 2009
(Wolfe et al., 2015). An earlier study of California peace officers reported that for each
non-fatal officer injuries (Gustafson & Cappitelli, 2010). A smaller ratio of officer
injuries to deaths was found by Rix et al. (1997), who examined officer-involved
collisions that occurred in England and Wales from 1990 to 1993 and resulted in 511
injured officers and 16 officer deaths.
Details regarding the injuries sustained by United States’ police officers due to
vehicle collisions are limited. Wolfe et al. (2015) examined records from the California
Department of Motor Vehicles and found a total of 35,840 collisions involving peace
officers had occurred in the state from 2000 to 2009. Wolfe et al. (2015) found that
collisions over that decade resulted in 7,684 injured officers. A total 9,181 officer injuries
were reported, including 6,380 complaints of pain, 2,395 other visible injuries, 367
serious injuries, and 39 fatalities (Wolfe et al., 2015). Between 19.0 and 23.2 percent of
annual collisions from 2000 to 2009 involving California law enforcement officers
resulted in one or more officer injuries or fatalities (Wolfe et al., 2015).
Even less is known about the minor collisions that are most common in police
departments, including those that result in little or no property damage. Part of the reason
for this oversight is that collisions without injuries are less harmful on the personal level.
Another reason is that law enforcement agencies and state departments of motor vehicles
may require injuries or a certain amount of damage before requiring officers to report
their collisions. However, overlooking minor vehicle collisions is a costly mistake for
agencies because of their magnitude. For instance, the Los Angeles Times reported that
LAPD officers alone were in over 1,250 collisions over a 3 year period (Rubin, 2012). Of
course, costly damage to police vehicles, civilian vehicles, and other forms of personal
officer-involved vehicle collisions that has been limited to crashes resulting in fatalities
or even injuries to officers has severely underestimated the scope of the problem.
Citizen Fatalities
Broadly speaking, motor vehicle collisions are a major public safety threat in the
United States. The National Center for Injury Prevention and Control reported that
33,804 Americans were killed in motor vehicle traffic collisions in 2013 (Centers for
Disease Control and Prevention, 2013). This figure is slightly higher than the 32,719
people NHTSA (2015) estimates were killed in the U.S. in 2013. A 2013 Centers for
Disease Control and Prevention (CDC) report on the leading causes of death in the U.S.
for 2010 found that “unintentional motor vehicle accidents” were the most frequent cause
of deaths among the 5 to 9 years, 10 to 14 years, and 15 to 24 years of age groups. They
were also the leading causes of injury related deaths among all ages (Centers for Disease
Control and Prevention, 2013). Motor vehicle collisions were the second leading cause of
injury related deaths among 6 of the 7 remaining age groups (Centers for Disease Control
and Prevention, 2013). However, precise estimates of the number of civilians killed in
motor vehicle collisions involving police officers in the United States are unavailable.
The lack of research is shocking considering that several sources have indicated police
crashes actually result in more deaths to citizens than officers. The British Home Office
reported that 76 out of 92 deaths (82.6 percent) that resulted from officer-involved
crashes in the United Kingdom from 1990 to 1993 were members of the public (Rix et
al., 1997). In a presentation at the 69th Annual Meeting of the American Society of
were killed in officer-involved vehicle collisions in California over 2 years (2008-2009)
and only 5 of them were peace officers.
The deadly consequences of officer-involved collisions on everyday American
citizens over time are evident in NHTSA’s (2005-2015) FARS data (see Figure 2.5).
According to NHTSA, police vehicle crashes killed more citizens than officers during
each of the past 10 years. From 2004 to 2013, police vehicle collisions caused an average
of 69.2 citizen deaths and 30.6 officer deaths per year. The maximum number of annual
citizen deaths was 90 in 2007 and the minimum number of citizens killed in collisions
with police officers was 50 in 2010. Unlike officer fatalities, the number of citizen motor
vehicle fatalities increased from 2010 to 2013. In terms of officer fatalities, FARS data
from 2004 to 2013 show a similar trend as was found in the LEOKA and NLEOMF
data—an overall decline over the past decade and a low in 2013.
Figure 2.5. NHTSA (FARS) data on motor vehicle-related deaths: 2004-2013. 0
10 20 30 40 50 60 70 80 90 100
04 05 06 07 08 09 10 11 12 13
Citizen Fatalities
Citizen Injuries
Nonfatal motor vehicle collisions are also extremely costly in the United States.
The National Highway Traffic Safety Administration (2015) estimated that 2,313,000
people were injured in vehicle collisions on U.S. roadways in 2013. In 2011, motor
vehicle crashes were the fourth leading cause of nonfatal injuries treated in hospital
emergency departments in the United States for the 6 age groups from 15 to 65 years and
older, as well as among the entire population. During 2010 and 2011, the approximately
3.9 million emergency department visits for motor vehicle collisions accounted for 10.1
percent of the total injury-related emergency department visits in the United States
(Albert & McCaig, 2015). Officer-involved vehicle collisions cause considerable nonfatal
harm among the general public as well but this issue has been largely overlooked. For
example, Hansen et al. (2013) found that 48.3 percent of serious injuries, 49.9 percent of
other visible injuries, and 51.6 percent of complaints of injuries that resulted from
officer-involved collisions in California during 2008 and 2009 were sustained by
members of the public. Looking abroad, Rix et al. (1997) found officer-involved
collisions in England and Wales from 1990 to 1993 caused 511 serious injuries to law
enforcement officers and 514 serious injuries among the greater public. Overall, it
appears that estimates of the harm caused by officer-involved vehicle collisions that have
excluded citizens have substantially underestimated the total destruction that has resulted
from police collisions.
Financial Costs
The total extent of the losses due to officer-involved vehicle crashes to surviving
but the financial costs can be estimated and are alarming on their own. The National
Highway Traffic Safety Administration conducted a comprehensive study of all vehicle
collisions in 2000, not just incidents that involved police officers, and reported the total
cost of a fatal crash was $977,208 (Blincoe, Seay, Zaloshnja, Miller, Romano, Luchter, et
al., 2002). A follow-up reported that the cost of a fatal collision had risen to $1.4 million
in 2010, not including lost quality of life (Blincoe, Miller, Zaloshnja, & Lawrence, 2014).
These estimates of the total cost of a fatal collision in the U.S. included emergency
services, property damage, medical care, and lost productivity (Blincoe et al., 2002,
2014). In the cases of police line of duty deaths, surviving family members receive more
than $333,000 from the Public Safety Officers’ Benefits Program5 (Public Safety
Officers’ Benefits Program, 2014). The amount awarded by the federal government is the
same for officers killed on the streets and in their vehicles.
The number of deaths is dwarfed by the number of police officers who have
suffered debilitating and costly injuries resulting from vehicle collisions. In terms of per
incident costs, NHTSA estimated each non-fatal crash in the U.S. during 2010 cost
between $13,000 and $1,100,000 depending on severity, but did not examine police
officer-involved collisions specifically (Blincoe et al., 2014). Similar to fatal collisions,
costs have not been calculated specifically for collisions that have involved police
officers. However, rough estimates based on the number of fatal police collisions and the
costs per incident in the general public suggest that the costs of these events are
tremendous. Many of the costs related to officer collisions will be borne by local
5 Officers killed on or after October 1, 2013 receive $333,604.68 from the Bureau of
governments, which employ the majority of police in the United States, and all will
consume resources that could be used elsewhere.
The liability resulting from vehicle collisions can also pose considerable costs to
law enforcement agencies and local governments. For instance, the Los Angeles Times
reported that the LAPD paid almost $24 million over 9 years in approximately 400 civil
cases that resulted from officer-involved collisions (Rubin, 2012). Car crashes were the
reason for one out of four lawsuits filed against the LAPD during this period (Rubin,
2012). The city only went to trial in a few of these cases, which suggests
acknowledgment of some liability associated with these collisions (Rubin, 2012).
Explaining Officer-Involved Vehicle Collisions
Research into the correlates of officer-involved vehicle collisions is worthy of
study because of the considerable impact (no pun intended) on members of the public as
well as officers. The extant literature regarding the causes of on-duty collisions is
examined in this section but there is a broad deficiency of empirical knowledge and
research on the topic. Although 425 officers were killed in vehicle crashes in the decade
from 2004 to 2013, slightly fewer than the 510 killed by suspects (FBI, 2005-2014), and
an unknown number of citizens have been killed as well, much more attention has been
devoted to negative consequences of firearms than motor vehicles. In the field of law
enforcement, the risks posed by the motor vehicle have been largely overlooked
(Cappitelli, 2015)6. Until recently, researchers of officer use of force and officer safety
have focused more attention on tools including CED’s and OC spray than on motor
vehicles. One exception has been research on police pursuit driving specifically (e.g.,
Alpert, 1987; Alpert, 1997; Alpert & Dunham, 1989). However, police pursuits have
accounted for only a small portion of the total officer collisions, from about 5 percent
(Alpert & Dunham, 1989) to 10 percent (Noh, 2011)7. Thus, research limited to
pursuit-related collisions can only provide a partial picture of officer-involved crashes.
It is unfortunate but true that little is known about the causes or correlates of
officer-involved vehicle collisions (Stephens, Fielder, & Edwards, 2013). On the positive
side, heightened interest has also been observed over the past few years among
practitioners and academics who have partnered to discover means of reducing harmful
driving behaviors. Examples include the Officer Safety and Wellness group that was
created by the Bureau of Justice Assistance and Office of Community Oriented Policing
Services, the International Association of Chiefs of Police (IACP) Research Advisory
Committee, and the CalPOST SAFE Driving Campaign’s Research Advisory Committee.
Finally, President Obama’s Task Force on 21st Century Policing (2015) also included
hearings on these issues.
Much of what we know about officer-involved vehicle collisions has been
provided by two federal and one state organization: the British Home Office (Rix et al.,
1997), the California Commission on Peace Officer Standards and Training (Gustafson,
2009), and the National Highway Traffic Safety Administration (Noh, 2011). An early
examination of officer-involved vehicle collisions was conducted by Rix et al. (1997),
who studied 770 crashes that involved police in England and Wales from 1990 to 1993
and resulted in 1,025 persons being injured and 92 deaths. More recently, NHTSA (Noh,
2011) conducted a study of fatal officer-involved collisions in the United States from
1980 to 2008, which took the lives of 823 officers. CalPOST was among the first
practitioner organizations to devote itself to the problem of officer-involved motor
vehicle collisions. CalPOST established the SAFE Driving Campaign, and created
partnerships with a group of researchers from the University of South Carolina,
Washington State University, the University of California – Berkeley, California State
University – Sacramento, and the University of Colorado Denver. One CalPOST
contribution to the extant literature focused on driver training but also examined several
officer-level characteristics (Gustafson, 2009).
Finally, a handful of research articles have attempted to explain officer-involved
vehicle collisions in the U.S., including those in the August, 2015 special issue of
Policing: An International Journal of Police Strategies and Managementthat is dedicated
to police crashes. In fact, most of the studies published in this journal issue were
conducted by researchers affiliated with the CalPOST SAFE Driving Campaign. The
diversity of approaches to better understanding officer-involved vehicle collisions is
well-demonstrated by this issue that contains studies that have examined characteristics of
officers (Hansen et al., 2015; James, 2015; James & Vila, 2015; Wehr, 2015; Wolfe et al.,
2015), incidents (LaTourrette, 2015; Rice, Troszak, & Gustafson, 2015; Wolfe et al.,
2015), organizations (Wehr, 2015), and states (Gustafson, 2015). Looking across this
body of literature, characteristics that have been blamed for motor vehicle collisions have
been similar to those that have that have been found relevant to explaining use of deadly
and excessive force, vehicle pursuits, and citizen complaints—suggesting a potential link
Research Findings Regarding Officer-Involved Collisions
Several researchers have examined demographic characteristics of officers in
vehicle collisions. Not surprising considering their representation within law enforcement
organizations, male officers have been disproportionately involved in serious and fatal
collisions in the U.S. and abroad. In an analysis of FARS data, Noh (2011) found that
93.0 percent of officers killed in the U.S. between 1980 and 2008 were male. A study of
10 years of police crashes in California reported that 91.1 percent involved male officers
(Wolfe et al., 2015). All 39 officers killed behind the wheel in the study by Wolfe et al.
(2015) were male. Comparisons to non-involved peers were not made in these studies so
it is unclear exactly how these figures related to the overall driving officer populations in
those areas and times. In England and Wales, Rix et al. (1997) found approximately 90
percent of officers in serious or fatal collisions were male. For comparison purposes, 87
percent of officers at the time were male. On the other hand, Hansen et al. (2015) found
nonsignificant gender effects on collisions in their survey of patrol officers in eight
California agencies. Rice et al. (2015) found that female officers were more likely than
male officers in California to have been culpable for their collisions.
Officer age is another demographic variable that has been linked to on-duty
vehicle collisions. In his classic explanation of police behavior, Sherman (1980) stated
that “conventional police wisdom holds that younger officers are more aggressive, and
also more likely to make mistakes than older officers” (p. 71). It is also possible that
younger officers have received less exposure to the negative consequences of unsafe
driving. Simply put, they may not have responded to deadly collisions—a sobering
officer-involved collisions peaked around 25 to 29 years of age and exhibited a steady decline
afterwards. Overall, 41.0 percent of officers in injury or fatality collisions in the study by
Rix et al. (1997) were between the ages of 25 and 34. After accounting for the age
representation of all officers, Rix et al. (1997) concluded that serious collisions were
more common among younger officers. For instance, individuals over 40 year of age
represented 33 percent of officers in the U.K. but accounted for only 15 percent of
serious collisions (Rix et al., 1997). More recently, Rice et al. (2015) found that younger
drivers were significantly more likely than officers aged 50 years or older to be culpable
for their collision involvement.
Regardless of the underlying reasons why age is associated with crashes, similar
arguments also appear to apply to officer experience. In fact, Hansen et al. (2015)
included measures of officer age and experience on their survey of California officers but
could not model the effects of both variables due to multicollinearity issues.
Nonsignificant effects of officer experience on any duty collision involvement and
on-duty collision frequency were reported by Hansen et al. (2015).
Officer rank has also been examined in relation to vehicle collisions. Rix et al.
(1997) found that 86 percent of officers in serious collisions were constables as compared
with 76 percent of all officers in the U.K. at the time. Rix et al. (1997) also suggested that
the relationship they found between age and collisions was because younger officers were
more likely to be at the rank of constable and to be assigned an operational role—both of
which demand more driving and therefore place young officers at greater risk for
collisions. Hansen et al. (2015) also noted that younger officers are more likely to be
increased exposure to driving-related issues including collisions all else being equal.
Hansen et al. (2015) found that supervisors were significantly less likely than patrol
officers to be in 1 or more as opposed to 0 collisions as well as 2 or more versus 0
collisions. In fact, officer rank was one of only three consistently relevant variables in the
models presented by Hansen et al. (2015).
Another body of literature that holds promise with respect to reducing
officer-involved collisions considers the effects of officer fatigue. Much of this research has been
conducted by Vila and colleagues, who have studied effects on officer fatigue that
secondary employment (Vila, 2000, 2009; Vila & Kenney, 2002), excessive hours
on-duty (Vila, 2000, 2006 2009; Vila & Kenney, 2002; Vila, Kenney, Morrison, & Reuland,
2000), and shift work (Amendola, Weisburd, Hamilton, Jones, & Slipka, 2011; Vila,
2006). In turn, officer fatigue has been shown to have negative effects on officer safety,
health, and on-duty accidents (Vila et al., 2000). In fact, the effects of fatigue on officer
performance levels have been compared with the effects of alcohol (Vila, 2000, 2009;
Vila & Kenney, 2002). The relationship between officer fatigue and collisions were
recently considered in experiments conducted by James and Vila (2015), who found
significantly worse post-shift driving performance among officers working night shifts
than day shifts. A study by Rajaratnam, Barger, Lockley, Shea, Wang, Landrigan et al.
(2011) reported that 40 percent of officers had sleep disorders—approximately twice the
rate among the general public.
Other studies have examined the relevance of training on driving. For instance,
research conducted in California found that officers who completed an Emergency
were significantly less likely to be in collisions (Gustafson, 2009). Alternatively, Rix et
al. (1997) found that the most qualified “advanced level” drivers were in more serious
collisions than the least trained “basic level” drivers and concluded that “there would
appear to be no simple relationship between driving skills and involvement in serious
accidents” (p. 19). Rix et al. (1997) add that “this apparently paradoxical situation is,
however, explained in terms of the types of activity each group was involved in” (p. 19),
because advanced drivers were more likely to be in pursuits than basic drivers.
Furthermore, advance drivers were actually less likely than basic drivers to strike
vehicles or people during pursuits (Rix et al., 1997). The finding that officers with more
driving training and experience may be placed in more dangerous situations should be
kept in mind when considering the effects of age and experience on collisions.
With the return of war veterans from Afghanistan and Iraq, law enforcement
agencies may receive more applications from potential employees with military
experience in the near future. It has been suggested that combat veterans may have
unique difficulties driving safety, particularly in the period immediately following
deployment. The United States’ Army Medical Department (2011) focused on safe
driving among veterans in a publication titled, “Post-Combat Driving: The American
Road.” The publication reported a survey of combat veterans found 25 percent had
disregarded stop signs, 49 had become anxious when cars approached too quickly, and 20
percent had been anxious during routine driving during the previous 30 days. The Army
argued the driving behaviors that kept soldiers safe at war were the same behaviors that
mechanisms behind this unsafe driving at home, it referred to feelings of stress, anxiety,
frustration, and anger (United States Army Medical Department, 2011).
Researchers have also examined how agency driving culture may impact
individual officers’ safe driving and collision involvement. Wehr (2015) conducted
interviews with California officers and found that aspects of agency culture that were
related to collisions included morale, field training, supervision, and adherence to policies
and procedures. Hansen et al. (2015) also studied the effects of supervision and
enforcement concerning agency driving policies on collisions, but used a survey of patrol
officers in eight California agencies. Hansen et al. (2015) found significant effects of
perceived likelihood of supervisory enforcement of speeding and technology-use (cell
phone use for calls and texting) policies on self-reported collision frequency. There were
no discernable effects on collisions for supervision and enforcement of policies regarding
seatbelt use or code driving (Hansen et al., 2015).
A few studies have considered influences at the situational- or
environmental-level. One variable that appears relevant to this study is time of day. For instance, Wolfe
et al. (2015) found that officer-involved collisions over a one decade timeframe in
California were most likely to have occurred between noon and 6pm, and suggested that
this may be due to evening rush hour traffic. The research by Wolfe et al. (2015) suggests
that collisions may be related to citizen demand, risk exposure, and opportunity.
Conclusion
The tools available to police officers to accomplish their mandate have changed
dramatically over the history of police, among the most notable being the addition of the
become an omnipresent aspect of policing in the United States and have drastically
changed the daily routines of officers. Although vehicles are a relatively new tool and
weapon in the field of law enforcement, crashes have been quickly climbing to the top of
the list of problematic police events. Indeed, officer-involved vehicle collisions pose
considerable threats to officer and public safety on American roadways. Over the past
decade, motor vehicle collisions accounted for 42.5 percent of all officer deaths in the
United States while 51.0 percent of line-of-duty deaths were caused by felonious assaults
(FBI, 2004-2013). In some areas, officer-involved vehicle collisions have been found to
have caused more deaths to citizens than officers (Hansen et al., 2013). The number of
serious and minor injuries to members of the law enforcement community and general
public is far greater than the number of fatalities, and although these collisions are less
distressing in personal terms, the financial burden to families, agencies, and communities
should not be discounted. Overall, many of the costs associated with officer-involved
vehicle collisions are borne by members of the public, a problem that could potentially
threaten the vital yet tenuous trust between the police and the public. In fact, traffic safety
has become a foundational role of police in the United States (Richardson, 1974). Despite
the dangers to public and officer safety, little research has been conducted in this area.
For this reason alone, police crashes are worthy of the level of investigation that has been
afforded other harmful events. Still, many variables that appear to predict collision
CHAPTER 3
LINKING VEHICLE COLLISIONS TO OTHER NEGATIVE OFFICER OUTCOMES
Based on the personal and financial damage caused to officers, their families,
agencies, and the general public, it appears that officer-involved vehicle collisions are
quickly climbing to the forefront of concerning behaviors. However, potential for harm to
officers and agencies is not the only connection between officer involvement in vehicle
collisions and other undesired behaviors. Although differences exist, there exist several
reasons to support the hypothesis that the same officers involved in collisions are also
disproportionately represented among their peers in other negative outcomes including
deadly and excessive force, citizen complaints, and vehicle pursuits.
Exploring the links between these events is the purpose of Chapter Three. The
chapter begins with a discussion of the role of police. Next, Chapter Three turns to the
importance of monitoring undesired police behaviors in the United States. The remainder
of this chapter pieces together the various pieces of evidence that suggest officers
involved in vehicle collisions may also be disproportionately represented among the
causes of other undesired outcomes in their employing agencies. First, similarities in
explanatory variables are explored across several negative outcomes. Second, likenesses
in agency responses to negative officer outcomes are discussed.
The Relevance of Negative Officer Outcomes
The balance of individual freedoms with governmental control over citizens forms
police was named after the ancient Greek city-state or polis, where societal development
and prosperity required former strangers to live together in a mutually-beneficial manner.
Social norms arose including the reduction of violence and other coercive acts that had
formerly been accepted means of settling disputes between private parties. Reduced
violence and other antisocial acts had the ability to increase societal order and economic
success so the need naturally arose for a public body that could intervene justly and fairly
between private parties, often at their own request, when no other legal or legitimate8
recourse was available. Certain aspects of public police, an institution comprised of
individuals nested in organizations, naturally emerged as agents of many governments.
The foundation of these public bodies was built on achieving the societal goal of
decreased disorder and violence.
Democratic public police and their inseparable coercive powers originally arose
from the citizenry. The institution was a natural governmental response to societal needs
and later citizen requests for a public entity that promoted order and justice by
intervening in private, volatile situations for which there was no other solution. Bittner
(1970) described police activities as addressing,
“Something-that-ought-not-to-be-happening-and-about-which-somebody-had-better-do-something-now” (p. 39). Thus, the
legitimacy of the institution has been and always will be based on citizen’s views
regarding the police success in reducing actions that could damage the internal integrity
of societies.
8 Tyler defined legitimacy as “a psychological property of an authority, institution, or