University of South Carolina
Scholar Commons
Theses and Dissertations
12-14-2015
Optical Second Harmonic Generation in the
BaTiO
3
Phase on Magnetically Aligned
Multiferroic Nanofibers
Katia GasperiUniversity of South Carolina - Columbia
Follow this and additional works at:https://scholarcommons.sc.edu/etd Part of thePhysics Commons
This Open Access Thesis is brought to you by Scholar Commons. It has been accepted for inclusion in Theses and Dissertations by an authorized administrator of Scholar Commons. For more information, please [email protected].
Recommended Citation
Gasperi, K.(2015).Optical Second Harmonic Generation in the BaTiO3Phase on Magnetically Aligned Multiferroic Nanofibers.(Master's
Optical Second Harmonic Generation in the BaTiO
3phase
of magnetically aligned multiferroic nanofibers
by
Katia Gasperi
Master of Nanophysics, Nanocomponents, and Nano-measurements Paul Sabatier University / National Institute of Applied Sciences, 2003
Submitted in Partial Fulfillment of the Requirements
For the Degree of Master of Science in
Physics
College of Arts and Sciences
University of South Carolina
2015
Accepted by:
Yanwen Wu, Director of Thesis
Thomas Crawford, Reader
ii
Acknowledgements
I want to thank my advisor Dr. Wu for her guidance and for sharing her immense
knowledge; thanks to Dr. Crawford and his team for promoting collaboration and sharing
their sample and equipment; thanks to Dr. Crittenden for sharing his knowledge and
equipment; thanks to Dr. Webb for his patience, availability, experience and equipment;
thanks to all of Dr. Wu’s team; thanks to Fiona Oxsher for sharing her knowledge
concerning the photolithography projector; thanks to Arthur Illingworth and Allen Frye
for all their detailed and crucial advice concerning the milling machine; thanks to James
Clawson for his constant availability as well as for the oscilloscope, the wires, the power
supply, the crimping tools, the connectors, the variable, the computer,…etc..; and thanks
to Zachary Marsh, and Warren Steckle, for letting me use the SAXS Lab.
I also want to thank all the professors whose courses contributed to this work, especially
Dr. Bazaliy for his magnetism class, Dr. Creswick for his solid state physics class, and Dr.
Kunchur for his topics class; I want to thank all the “librarian chatters” for finding
important articles at any time of the day; thanks to Beth Powell, Lisa Saxon, Evelyn Wong,
Amanda Davis, Kelly Gibson, Sam Beals for their hard work and their kindness; thanks to
the maintenance team for all their help; thanks to the cleaning team for their work and
iii
Leila Aneta Net for their support and encouragement, and special thanks to David Edelson
for improving every single day my English, step by step.
Finally I want to thank all my friends and family among the greats who gave me the
strength of achieving this work: Sarah Gasperi, Danielle Gasperi, Rebecca Gasperi, Jacques
Gasperi, Bernard Maruejouls, Daniel Beau, Solange Mottal, Jacques Mottal, Christine
Morrison, Peter Morrison, Mary Bull, Craig Kridel, Fabrice Gil, Fabrice Benhamou, Pascale
Marty, Marianne Cathalat, Ocine Himeur, Frederique Faure, E Richard Walton, Akelina
cherie, Veronique Correch, Olivier Danger, Sandrine Dupuy, Jacqueline Masnari, Carole
Chalut, Claudine Urquhart, Regine Dufaur, Michel Dufaur, Julie Hubbert, Laetitia Pont,
Sandrine Buhours, Nelly Garzon, Desiré Nguessan, Hinda Boudiaf, Stefanie Mellet,
Theodore Monod, Yasmina Khadra, Coluche, Guillaume Galliene, l’Abbé Pierre, Albert
iv
Abstract
Multiferroic materials enable the exploration of electrical control of magnetic
properties and vice versa. Their increasing interest is especially due to their potential
applications in the industry of information storage. Thanks to recent progress in
nanotechnology, they have also been found to have many other applications such as
transducers and sensors, and they already occupy a unique place in the biomedical field.
The objective of this project is to study multiferroic nanofibers made of cobalt ferrite
CoFe2O4 (CFO) and barium titanate BaTiO3 (BTO) with a specific focus in the
characterization of the ferroelectric phase. We researched the state of knowledge
concerning the size effects on phase transition for nanoparticles and polycrystals BTO.
The ferroelectric phase transition of BTO occurs when it changes from a tetragonal
(anisotropic) crystal structure to a cubic (isotropic) structure. This change suggests that
optical second harmonic generation (SHG) is a good measurement technique for
monitoring the phase transition of the BTO half of the nanofibers. We designed and
prepared a temperature dependent SHG experiment on magnetically aligned fibers in
transmission with the possibility to investigate the polarization dependence of the signal.
We also prepared interdigital electrodes on glass for the future study of the fibers in an
v
Table of Contents
Acknowledgements ... ii
Abstract ... iv
List of tables ... vii
List of figures ... viii
Chapter 1: Motivations for the study of multiferroic materials. ... 1
Chapter 2: Preliminary studies: barium titanate BaTiO3 ... 6
1. Perovskites: ... 6
2. Bulk material: different crystals, ferroelectricity, T dependance ... 7
3. Size effect ... 9
4. Optical Second Harmonic Generation (SHG) ... 12
Chapter 3: Experimental section ... 18
1. Experimental design and expectations ... 18
2. Sample preparation ... 19
3. Sample holder and sample mount ... 23
4. Experiment alignment for SHG in transmission ... 26
vi
6. Future plans: conduct of the experiment ... 31
Glossary ... 33
vii
List of tables
Table 1.1 Electric and magnetic properties ... 4
Table 2.1 Optical SHG coefficients for bulk barium titanate ... 16
Table 2.2 Optical SHG coefficients for BaTiO3 on MgO[14] ... 17
Table 3.1 Calibration: mount used with one heater alone ... 25
viii
List of figures
Figure 1.1 Relationship between multiferroic and magnetoelectric materials[1]. ... 2
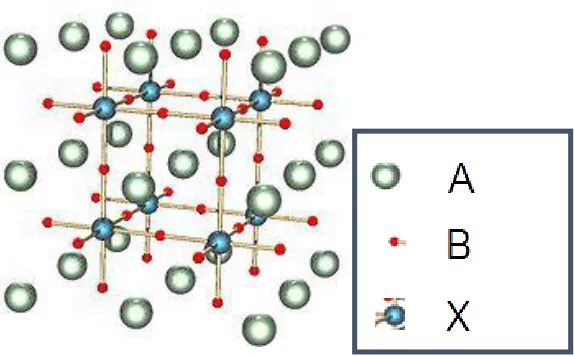
Figure 2.1 Structure of a perovskite with a chemical formula ABX3 ... 6
Figure 2.2 Phase transitions for barium titanate[6] ... 7
Figure 2.3 Cubic Tetragonal phase transition © DoITPoMS, University of Cambridge ... 8
Figure 2.4 Ti movement in the O octahedra © DoITPoMS, University of Cambridge ... 9
Figure 2.5 Change in tetrogonality c/a with particle size at room temperature[10] ... 10
Figure 2.6 DSC measurements for BaTiO3 polycrystals with different grain sizes[11] ... 11
Figure 3.1 Sample I prepared by the Dr. Crawford’s Team on glass ... 20
Figure 3.2 Sample II prepared by Dr. Crawford’s Team on glass ... 20
Figure 3.3 Fibers in interdigital electrodes ... 21
Figure 3.4 Sample on glass (aligned under 2.36kG after vortex agitation) ... 21
Figure 3.5 Sample on mica ... 22
Figure 3.6 Sample holder ... 23
Figure 3.7 Heaters A and B... 24
Figure 3.8 Heater A configuration (back side) ... 24
Figure 3.9 Heater B configuration (front side) ... 24
Figure 3.10 A + B configuration ... 25
ix
Figure 3.12 Measurements made for a line width of 20 points ... 29
Figure 3.13 Measurements made for a line width of 50 points ... 29
Figure 3.14 Measurements made for a line width of 100 points ... 30
Figure 3.15 Calibration for the projection photolithography ... 30
Figure 3.16 Sample holder ... 31
1
Chapter 1:
Motivations for the study of multiferroic materials.
This work is part of a project involving multiferroic nanofibers made of cobalt ferrite
CoFe2O4 (CFO) and barium titanate BaTiO3 (BTO) in collaboration between Dr. Crawford’s
group and Dr. Wu’s group. Its ultimate goal is to study the coupling between the two
phases. The context and motivations to study this CFO/BTO multiferroic material will be
discussed in this chapter. The investigation will then concentrate on the ferroelectric
phase characterization of barium titanate, which is the main objective of this specific
work. Details of this investigation will be discussed in the second and third chapter.
The increasing interest concerning multiferroic and magnetoelectric materials is
especially due to their potentially long-term applications in the industry of information
storage[1]. In addition, being a part of the “smart materials,” they find a multitude of
applications such as transducers or magnetic field sensors[2] as well as occupy a unique
place in the field of biomedical[3]. While multiferroic and magnetoelectric materials can
be single phase, most of them are multiphase. The meaning of “multiferroic” has evolved
since such materials have been studied, and its current definition is a material that
2
Figure 1.1 Relationship between multiferroic and magnetoelectric materials[1].
For the information storage application, magnetoelectric coupling is the key: It allows for
the writing of data electrically (avoiding the necessity to generate a high field to write
magnetically) and for the reading of data magnetically (avoiding the problems to
electrically read ferroelectric random access memory FeRAMs, which is usually a
destructive process). The magnetoelectric coupling may arise from any magnetic and
electric order. This coupling could happen directly between the two orders or indirectly,
for example via strain. For a multiphase multiferroic system, the strain due to the
interface of the two materials often plays an important role. Indirect coupling via strain
could result in interesting properties such as piezomagnetism, magnetostriction,
piezoelectric, electrostriction (see glossary for detailed definitions). First, we consider the
magnetoelectric coupling without any mechanical stress or strain involved. The free
energy determines the behavior of the material and its response to a magnetic or electric
3
Using the Einstein summation convention, the free energy of a system in response to an
electric field E and a magnetic field H could be expressed as:
− 𝐹(𝐸, 𝐻) =12𝜀0 𝜀𝑖𝑗𝐸𝑖𝐸𝑗+12 𝜇0𝜇𝑖𝑗𝐻𝑖𝐻𝑗+ 𝛼𝑖𝑗𝐸𝑖𝐻𝑗+ 12 𝛽𝑖𝑗𝑘𝐸𝑖𝐻𝑗𝐻𝑘+ 12𝛾𝑖𝑗𝑘𝐻𝑖𝐸𝑗𝐸𝑘
where,
𝜀𝑖𝑗 (relative permittivity tensor) is temperature dependent,
𝜇𝑖𝑗 (relative permeability tensor) is temperature dependent,
𝛼𝑖𝑗 is a linear magnetoelectric coupling coefficient and is temperature dependent,
𝛽𝑖𝑗𝑘 and 𝛾𝑖𝑗𝑘 are quadratic magnetoelectric coupling coefficients and are
temperature dependent.
Note that we have ignored higher coupling orders in this expression. However, it is
important to keep in mind that couplings involving higher rank tensor than 𝛼𝑖𝑗 might
become dominant in many cases. As an example, 𝛽𝑖𝑗𝑘𝐻𝑗𝐻𝑘 dominates 𝛼𝑖𝑗𝐻𝑗 in the
piezoelectric paramagnet NiSO4 ,6H2O [4]. In general, the coupling coefficients are rather
difficult to determine and highly dependent on the structure of the materials. Now, if we
want to include the couplings via mechanical stress or strain, cross terms need to be
added in the free energy equation above. The coupling will become even more difficult
4
In order to catch a glimpse of all the possible combinations among multiferroics, the
following table gives a list of properties between which couplings may occur (see glossary
for the corresponding definitions of the properties):
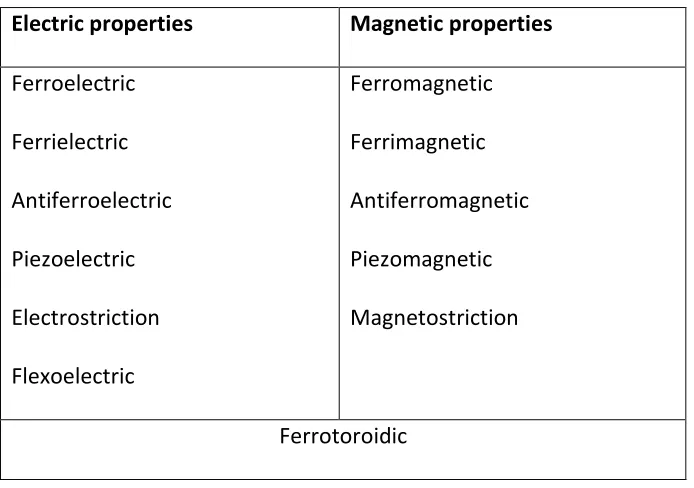
Table 1.1 Electric and magnetic properties
Electric properties Magnetic properties
Ferroelectric Ferrielectric Antiferroelectric Piezoelectric Electrostriction Flexoelectric Ferromagnetic Ferrimagnetic Antiferromagnetic Piezomagnetic Magnetostriction Ferrotoroidic
Among these properties, ferroelectric and ferrimagnetic are expected to be the dominant
ones in our cobalt ferrite / barium titanate (CFO/BTO) nanofibers sample. The CFO part is
ferrimagnetic and the BTO part is ferroelectric. The fiber as a whole is multiphase where
strain is expected to be the main coupling mechanism. However, before we can achieve
and analyze coupling between the two phases, we need to fully understand the two
phases separately. In this project, we will investigate the ferroelectric BTO phase. The
plan of the experiment builds on the state of knowledge in the field, more specifically on
the size effects affecting phase transitions, ferroelectricity and optical properties of
5
second chapter. We will discuss how the crystal symmetry changes from isotropic to
anisotropic during the cubic-tetragonal phase transition. This structural change means
that the optical second harmonic generation (SHG) is a good measurement tool for
monitoring the corresponding phase transition. As a result, an optical SHG experiment
6
Chapter 2:
Preliminary studies: barium titanate BaTiO
31. Perovskites:
Barium titanate is part of the perovskite family. Perovskites structures (XIIA2+VIB4+X2− 3)
have been studied theoretically as well as experimentally, and they occupy a quite
important class in material science. Each individual compound of this family has its own
interest. The structure of highest symmetry is cubic (fig. 2.1, retrieved from Wikipedia
common).
7
There are, however, many types of distortion that could occur in the bulk structure of this
family, such as:
distortion of the whole structure (for example, elongation in a particular
direction),
A displacement,
B displacement,
octahedron rotation,
octahedron distortion.
During the past 15 years, progress in nanotechnology and computation resulted in new
avenues of research for this material and, more recently, have revealed some interesting
mechanisms such as “oxygen breathing motion” resulting in magnetic properties for this
material[5]. For the purpose of this work, we will focus on barium titanate BaTiO3 as a
bulk material in the range tetragonal - cubic and will concentrate on ferroelectric and
non-linear optical properties.
2. Bulk material: different crystals, ferroelectricity, T dependance
The bulk material exists in five phases, with the following transition temperatures:
8
The cubic phase is paraelectric and the tetragonal is ferroelectric. The corresponding
transition is a first order phase transition (in agreement with latent heat measurements
and simulations[7]) but is close to a second order phase transition. Studies revealed a
mixed behavior displacive and order disorder (see glossary for detailed definitions)[7]
[8][9]. Simulation of the phase transitions using an effective Hamiltonian, including low
energy distortions only, have demonstrated a good agreement with experiments on bulk
materials [7]. The ferroelectricity appears with the tetragonality, below 120˚C. During the
phase transition between cubic and tetragonal, the atom displacements allow the
production of a dipole moment (fig. 2.3).
Cubic BaTiO3
Dipole moment
along the [100]
direction
Figure 2.3Cubic-tetragonal phase transition © DoITPoMS, University of Cambridge
It is important to note that the next orthorhombic and rhombohedral phases are
ferroelectric as well. These phases differ from the cubic phase by a displacement of the
9
Figure 2.4 Ti movement in the O octahedra © DoITPoMS, University of Cambridge
3. Size effect
The structural and physical properties of BatiO3 are dramatically size-dependent, even for
fine ceramics with grain size as large as 1 µm. Different studies have already been
conducted to determine how the size and shape of BaTiO3 could affect the phase
transition temperatures, the ratio of the lattice parameters c/a at a fixed temperature,
the ferroelectric properties, and even optical SHG. Even though the results also depend
on the various techniques used to prepare the material itself, they have a common trend.
They had been carefully analyzed and documented by Jian Yu and Junhao Chu for the ENN
10
a. Influence on the phase transition tetragonal - cubic temperature
The tetragonal-cubic phase transition temperature decreases significantly for small
particles. At room temperature, the tetragonality is affected for particle sizes ranging
from 120 nm to 300 nm. Results from Xray diffraction (XRD), transmission electron
microscopy (TEM) and specific surface area measurements on barium titanate powders
lead to a “critical size” of the cubic-tetragonal transition of about 120 nm (fig. 2.5).
Figure 2.5 Change in tetrogonality c/a with particle size at room temperature[10]
The critical size of the tetragonal cubic transition at room temperature for NPs was found
to be between 50 nm and 90 nm depending on different synthesis methods and different
measurement techniques[11][10][12][13]. Differential scanning calorimetry (DSC)
measurements had also been performed on polycrystals: the cubic-tetragonal phase
11
higher temperature. But below 100nm, DSC measurements do not reveal the phase
transition temperatures anymore (fig. 2.6).
Figure 2.6 DSC measurements for BaTiO3
polycrystals with different grain sizes[11]
To conclude this short analysis concerning size effects on phase transitions, we can say
that the discrepancies about the temperature of the cubic-tetragonal phase transition
depend on the synthesis techniques of NPs, the measurement methods (XRD, TEM,
scanning electron microscopy SEM, DSC), but also the strain or boundaries associated
with the type of material. For example, the strain induced my MgO on thin film increases
the tetragonality[14], but XRD measurements trend to prove that the core of nanocrystals
remains tetragonal while the surface relaxes to a cubic phase[15]: strain, surface effects
12
b. Influence on the dielectric constant temperature dependence
Due to the size dependence of the cubic-tetragonal phase transition, the ferroelectric
phase transition temperature Tc decreases with decreasing grain size similarly to the
cubic-tetragonal phase transition[10]. Below 1 μm, however, the permittivity decreases
with decreasing size. The P-E hysteresis cycle is still present for NPs ranging between
1.2μm and 0.3 μm, but the coercive field may vary (in the range of 0.22MV/m
to 0.11MV/m); the remanent and spontaneous polarizations both decrease with
the size [16]. Again, those results could vary with synthesis techniques and/or presence
of defects, but they emphasize the predominance of surface effects as well as the possible
presence of different phases. Also, below I μm, there is a loss of long range cooperative
interaction and twins effect, which usually participate in the domain formations for the
bulk material [11][17]. To conclude, XRD measurements even combined with TEM, SEM,
DSC, cannot give alone a deep understanding of the structure changes in barium titanate
at low scale, which conducted the scientific community to perform optics experiments.
4. Optical Second Harmonic Generation (SHG)
A good understanding of optical SHG should require a quantum mechanics description
especially for a nanomaterial; however, a classical approach gives a quite reliable
13
a. Optical SHG for the bulk crystal: classical description[18]
Optical SHG requires some nonlinear dielectric properties: the polarization P of a crystal
due to an external field E should have a component proportional to the square of the
field.
The polarization in a crystal comes from the displacement of electrons in an electric field:
𝑝(𝑡) = −𝑛𝑒𝑥(𝑡)
In this equation, 𝑛 is the electronic density, 𝑒 the charge of electron, and 𝑥(𝑡) is the
electrons displacement from their equilibrium position.
For a symmetric potential 𝑉(𝑥) , (cf. one direction of the cubic case):
𝑉(𝑥) = 𝑉(−𝑥) = 12 𝑚 𝜔02𝑥2+ 𝑜(𝑥3)
where 𝑚 is the electron mass and 𝜔0 is the resonance frequency of the electronic
oscillator.
The corresponding restoring force is:
𝐹 = − 𝑚 𝜔02 𝑥 + 𝑜(𝑥2)
For a field 𝐸(𝜔)(t), with 𝜔 small compare to 𝜔0,
𝐹 = −𝑒𝐸(𝑡) ⇒ 𝑥(𝑡) = − 𝑚 𝜔𝑒
0 2 𝐸(𝑡)
In this case, the polarization is directly proportional to the field: the signal generated by
14
For an asymmetric potential 𝑉(𝑥) , (cf. one direction of the tetragonal case), the
potential can be approximated as:
𝑉(𝑥) = 1
2 𝑚 𝜔02𝑥2+ 1
3𝑚 𝐷 𝑥3 + 𝑜(𝑥3)
The corresponding restoring force is:
𝐹 = − 𝑚 𝜔02 𝑥 + 𝑚 𝐷 𝑥2+ 𝑜(𝑥2)
In this case, for a driven field 𝐸(𝜔)(𝑡) = 𝐸(𝜔)cos 𝜔𝑡 , with 𝜔 small compare to 𝜔0,
taking into account the possible losses (absorption), x(t) is solution of the following
equation:
𝑑2𝑥
𝑑𝑡2 + 𝜎
𝑑𝑥
𝑑𝑡+ 𝜔02 𝑥 + 𝐷 𝑥2 = − 𝑒𝐸(𝜔)
2𝑚 (𝑒𝑖𝜔𝑡+ 𝑒−𝑖𝜔𝑡)
The solution is 𝑥(𝑡) = 12(𝑞1𝑒𝑖𝜔𝑡 + 𝑞2𝑒2𝑖𝜔𝑡+ 𝑞1∗𝑒−𝑖𝜔𝑡+ 𝑞2∗𝑒−2𝑖𝜔𝑡)
with 𝑞1 = − 𝑒𝐸
(𝜔)
2𝑚
1
(𝜔02 − 𝜔2)+𝑖𝜔𝜎 and 𝑞2 =
−𝐷𝑒2[𝐸(𝜔)]2
2𝑚2[(𝜔
02 − 𝜔2)+𝑖𝜔𝜎]2[𝜔02−4𝜔2+2𝑖𝜔𝜎]
The resulting polarizations are:
𝑝(𝜔) (𝑡) = − 𝑛𝑒
2 (𝑞1𝑒𝑖𝜔𝑡+ 𝑞1
∗𝑒−𝑖𝜔𝑡 ) and 𝑝(2𝜔) (𝑡) = − 𝑛𝑒
2 (𝑞2𝑒2𝑖𝜔𝑡+ 𝑞2
∗𝑒−2𝑖𝜔𝑡 )
It is normal to define the nonlinear optical coefficients d as:
𝑝(2𝜔) (𝑡) = − 1
2 (𝑑(2𝜔)𝑞2 [𝐸(𝜔)]
2
15 Using the full expression for q2 , we get:
𝑑(2𝜔) = −𝐷𝑛𝑒
3
2𝑚2[(𝜔
02 − 𝜔2) + 𝑖𝜔𝜎]2[𝜔02− 4𝜔2+ 2𝑖𝜔𝜎]
This coefficient can also be rewritten in term of the susceptibility as:
𝑑(2𝜔)= 𝑚𝐷[𝜒(𝜔)]2𝜒(2𝜔)𝜖03
2𝑛2𝑒3
A simple expression for the resulting amplitude polarization can be obtained:
𝑃(2𝜔) = 𝑑(2𝜔)𝐸(𝜔)𝐸(𝜔)
These last expressions have given good predictions of the polarization for different
ferroelectric materials.[19]
In three dimensions,
𝑃𝑖(2𝜔) = 𝑑𝑖𝑗𝑘(2𝜔) 𝐸𝑗(𝜔)𝐸𝑘(𝜔)
A good estimate of the nonlinear optical coefficients 𝑑𝑖𝑗𝑘(2𝜔)can be found from this
calculation for barium titanate.
b. Known nonlinear optical coefficients for BaTiO3
Since the development of this classical concept, different measurement techniques for
16
given in pm/V for a specific incident wavelength and are well known for the bulk BaTiO3
(cf. table 2.1) [14].
Table 2.1 Optical SHG coefficients for bulk barium titanate
Optical SHG coefficient (pm/V) at 1.064μm
𝑑15 ≡ 𝑑113 17.0
𝑑33 ≡ 𝑑333 6.8
𝑑31 ≡ 𝑑311 15.7
c. Size effects:
As the size decreases, the orbital hybridizations and the tetragonal distortions decrease,
leading to smaller optical SHG coefficients. The SHG signal becomes weaker but can still
be measured and may eventually be used to determine the phase transition temperature
or the critical size. Some experiments had already been conducted:
The SHG signal from small grains of about 35nm is 103 weaker than the ones
generated by grains of about 10 µm[11].
The SHG signal from barium titanate thin film grown by metal organic chemical
vapor deposition (MOCVD) on magnesium oxide gives lower values for the optical
coefficients, even though the deposition technique and the strain involved are
17
Table 2.2 Optical SHG coefficients for BaTiO3 on MgO[14]
d (pm/V) at 1.064 µm
c oriented film 2.13
a oriented film 1.5
SHG measurements with incoming signal polarization dependence reveal the
presence of tetragonality in BaTiO3 NPs with size ranging between 22nm and
55nm. Also, the direction of the a and c axis can be deduced from the
18
Chapter 3:
Experimental section
1. Experimental design and expectations
Following the previous study, an optical SHG experiment to characterize the multiferroic
nanofibers CFO/BTO had been prepared, with capabilities of:
temperature dependence,
excitation light polarization dependence,
possibilities to investigate the response of the multifferoic nanofibers to an
external electric field.
The main objective of the experiment is to observe the temperature dependence of the
signal to monitor the Curie temperature. The ferromagnetic phase of the fibers has been
used to magnetically align the fibers. Variations of SHG signal intensity with respect to the
temperature are expected to detect the Curie temperature, while changes of SHG signal
intensity versus incoming light polarization can confirm the presence of the tetragonal
phase and give the angle between the a and c axis of the ferroelectric phase. The magnetic
alignment gives the possibility to select one single fiber or a group of fibers close to each
19
Further work with the addition of an external electric field are planned: different
interdigital electrodes on glass had been prepared for that purpose. The magnetic
alignment of the fibers allows for the selection of an external electric field’s particular
direction with respect to the axis of the fibers. With this new ingredient, a change in
intensity of the SHG signal versus the polarization of light with the addition of the external
electric field may emphasize any privileged direction for the polarization dependent SHG
signal with respect to the fiber axis.
2. Sample preparation
The nanofibers were aligned on a transparent substrate in a magnetic field of about
2.36kG via the ferrimagnetic CFO phase (at room temperature). Two substrates were
used: mica, for X-ray diffraction measurement, and glass, for the transmission
experiment. The fibers seem to agglomerate differently depending on:
- the agitation of the solution before deposition,
- the time spent between the agitation and the deposition,
- the wetting between the solution and the substrate,
20
Different samples have been prepared for this project (cf. fig. 3.1, 3.2, 3.3, 3.4 and 3.5).
Cluster on sample Cluster on sample Overall sample
Figure 3.1 Sample I prepared by the Dr. Crawford’s Team on glass
Clusters on sample Fibers on sample Fibers on sample
Figure 3.2 Sample II prepared by Dr. Crawford’s Team on glass
It can been seen from the figures 3.1 and 3.2 that the alignment is well realized when the
fibers are far enough, but they could form clusters made of fibers with different directions
21
Some fibers have successfully been aligned in a direction parallel to interdigital
electrodes, allowing an experiment with an external electric field perpendicular to the
axis of the fibers (fig. 3.3). Additional samples have been prepared on glass (fig. 3.4) and
mica (fig. 3.5).
Image in bright field Image in dark filed Fibers on sample
Figure 3.3 Fibers in interdigital electrodes
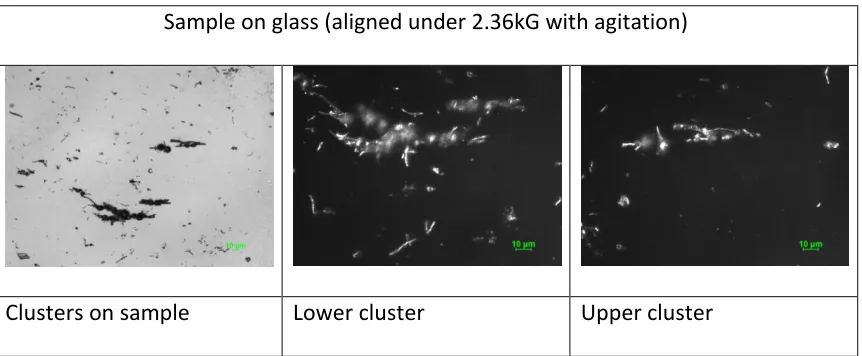
Sample on glass (aligned under 2.36kG with agitation)
Clusters on sample Lower cluster Upper cluster
22 Sample on mica
Cluster on sample Overall sample
Figure 3.5 Sample on mica
From this alignment, three transmission experiment possibilities have been considered:
- SHG on a single nanofiber,
- SHG on a cluster,
- SHG on a group of nanofibers aligned in the same direction.
In principle, the best alignment will allow us to excite a group of fibers similarly oriented
with the same incoming beam in order to increase the intensity of the generated SHG
signal. This might be necessary because the SHG signal, which is already weak for the bulk
barium titanate, is expected to be even weaker in our case, due to size effects (cf. analysis
in the second chapter): the fibers are 7μm long in average and their diameter is close to
1μm. In addition, the CFO phase may increase the skin depth of these fibers. On the other
hand, a cluster should also have a better response than a single fiber in term of intensity,
but the light polarization dependence of the SHG signal should be different for the cluster,
23
3. Sample holder and sample mount
The transmission sample holder has been prepared to fit the cryostation mount holder
for vacuum and low temperature applications. It is made of oxygen free copper with two
brass screws for the sample holder. It ensures a good thermal contact for round
microscope glass cover slides of about 18 mm and prevents gas entrapment (fig. 3.6). The
sample mount fits the sample holder: It is made of aluminum and can hold two different
rubber silicon heaters for temperature dependent experiments. The two heaters A and B
(fig 3.7) can be used together with the heater A in the center of the mount (fig. 3.10) or
separately (fig. 3.8 and fig. 3.9) for different temperature ranges.
24
Figure 3.7 Heaters A and B
Figure 3.8 Heater A configuration (back side)
Figure 3.9 Heater B configuration (front side)
Heater B
25
Figure 3.10 A + B configuration
Different calibrations have been done for the range of temperature of interest. The data
for those calibrations are reported in the tables 3.1 and 3.2.
Table 3.1 Calibration: mount used with one heater alone
Heater A configuration Heater B configuration
8.5 9 9.5 10 10.5 11 11.5 12 12.5 0 10 20 30 40 50 60
Temperature of the mount versus Voltage applied Heater A alone
Voltage applied (V)
T e m p e ra tu re (d e g C )
40 50 60 70 80 90 100 110 0 20 40 60 80 100 120
Temperature of the mount versus variable % Heater B alone (100% correspond to 120V)
Variable transformator %
26
Table 3.2 Calibration: mount used with the two heaters together (A and B)
Voltage applied to the heater A = 12V DC Voltage applied to the heater B = 120V AC Note: in this configuration, the voltage applied to the heater B exceed the maximum value suggested by the data sheet of the heater
4. Experiment alignment for SHG in transmission
As seen previously, the SHG signal is expected to be weak, especially due to size effects;
as a consequence, the experiment requires a high intensity laser. We are using a Mira
mode locked / pulsed with a frequency of 76 MHz at 840nm. The power is controlled by
an upstream neutral density filter and a Glan-Taylor polarizer; the polarization angle of
the incoming p-polarized light is controlled by a half-wave plate (cf. fig 3.11, where λ/2
stands for half wave plate, PBS is a polarizer beam splitter, ND is a neutral density filter).
55 60 65 70 75 80 85 90 95 100 105 0 20 40 60 80 100 120 140
Temperature of the mount versus variac %
Variable transformator %
T e m p e ra tu re (d e g C )
11.5 12 12.5 13 13.5 14 14.5
118 120 122 124 126 128 130 132
Temperature versus voltage applied to the heater A
27
The focusing lens and the objective are mounted on a Z-stage and the sample is on a XYZ-
stage. To clearly identify and pre-select the area of interest on the sample, a white source
of light can be placed between the collimation and the Glan-Taylor polarizer, associated
with a screen in front of the spectrometer. With a movable CCD camera located in the
spectrometer, the sample area of interest may be refined, and it is possible to select a
particular fiber or cluster. Again, the magnetic alignment of the fibers is convenient to
choose a particular direction of the fiber with respect to the entry slit of the spectrometer.
For now, only a short pass filter at 450 nm is used to block the excitation beam. It is epoxy Focusing
lens ND
filter
PB
Collimation
Glan Taylor
Polarizer
Polarizer λ/2
λ/2
Objectif
Filter
Mira pulsed
Spectro
Sample
28
laminated and, in term of power, its best performance is about 1-10 J/cm2. An additional
filter or a dichroic mirror may be used in the future.
5. Interdigital electrodes on glass
The electrodes have been prepared via photolithography (by projection) in the
perspective of investigating the behavior of the fibers in an electric field. The exposure
and development have been done following the procedure in Dr. Webb’s lab. The
projection of the interdigital electrodes pattern has been made using different line widths
(the size has been adjusted via the “number of points” under power point), and the lines
have been projected at the center of the image. We have measured the resulting lines
just after the developing with an optical microscope (fig. 3.12, 3.13 and 3.14): the
minimum width was found to be near the center of the pattern (probably due to
distortions occurring near the edge of the whole projected image). A calibration has be
29
Figure 3.12 Measurements made for a line width of 20 points
30
Figure 3.14 Measurements made for a line width of 100 points
Line size (pt.)
Minimum length (µm) 100 321
50 128 20 18 Slope: 3.8 μm / point
Figure 3.15 Calibration for the projection photolithography
In order to prepare fourteen samples during the same thermal evaporation, a sample
holder has been prepared (fig 3.16), and the chromium and gold deposition has been
made via thermal evaporation. We have prepared three types of electrodes (fig 3.17). 10 20 30 40 50 60 70 80 90 100 110 0 50 100 150 200 250 300 350
calibration for optical lithography
line size (number of points)
31 Figure 3.16 Sample holder
Fine electrodes Large electrodes Two sets of electrodes
Figure 3.17 Interdigital electrodes
In principle, the different sets of electrodes should allow for different external electric
field strengths.
6. Future plans: conduct of the experiment
We have discussed that the SHG signal is expected to monitor the Curie temperature of
the ferroelectric phase. Also, the polarization dependence of the input laser should
32
axis in the structure. We expect an eventual shift of the Curie temperature to a lower
value compared to that of the bulk. This shift might reveal the importance of strain due
to the CFO phase and other surface effects on the tetragonality. The alignment of the
fibers is convenient as it allows for the excitation of a large group of nanofibers in order
to increase the SHG signal, which might be weak for a single fiber due to possible
absorption process and size effects. However, if the SHG signal from a single fiber is
intense enough, we might consider investigating the influence of the fiber length on the
previously discussed results (Curie temperature, presence of the tetragonal structure,
polarization dependence). Finally, if the signal is too weak, it is still possible to prepare an
experiment in reflection that might lower some absorption process.
We have also planned further experiments in an external electric field. It should confirm
the presence of the tetragonal structure and emphasize any preferred direction for the
generation of the SHG signal with respect to the main axis of the fibers. The different sets
of electrodes allow for different maximum field strengths, depending on the distance
between the interdigital electrodes. However, it is important to note that previous
experiences conducted on barium titanate have required an electric field of about
2 MV/m in order to generate the hysteresis cycle for grain size ranging from 0.3 μm
to 1.2 μm[16]. If no influence can be seen from the external electric field produced by our
existing sets of electrodes, we plan to make electrodes with smaller separation distances
33
Glossary
Antiferroelectric: material that possesses ordered dipole moment that can cancel each
other in the unit cell.
Antiferromagnetic: material that possesses ordered magnetic moment that can cancel
each other in the unit cell (in the localized sense).
Diamagnetic: exhibits a magnetization in response to an applied magnetic field, in the
opposite direction than the applied field.
Displacive phase transition: transition with a single potential energy minimum whose
position shifts at the transition temperature.
Electrostriction: change in strain as a quadratic function of an applied electric field.
Ferrimagnetic: material that possesses ordered magnetic moments that do not cancel
each other completely, which results in a magnetization that can be switched in response
to an applied magnetic field.
Ferroelastic: displays a spontaneous and stable deformation (phase change) that can
been switched hysteretically by an applied stress.
Ferromagnetic: possesses a spontaneous magnetization that is stable and can be
34
Ferrotoroidic: possesses a spontaneous and stable order parameter which is the curl of a
polarization or magnetization.
First order phase transition: following the Ehrenfest classification, a first order transition
has its first derivative of the free energy with respect to the order parameter
discontinuous at the transition.(The order parameter associated with ferroelectricity is
the polarization).
Flexoelectric: exhibits a spontaneous electrical polarization in response to a strain
gradient.
Magnetostriction: change in strain as a quadratic function of an applied magnetic field.
Order disorder phase transition: transition with several minima among which a “choice”
is made.
Paramagnetic: exhibits a magnetization in response to an applied magnetic field, in the
same direction than the applied field (but does not have a spontaneous magnetization).
Piezoelectric: exhibits the generation of electrical charge in response to an applied
mechanical stress, and vice-versa. The response is linear.
Piezomagnetic: exhibits a change of magnetization in response to an applied mechanical
stress, and vice-versa. The response is linear.
Pyroelectric: has a spontaneous electric polarization that varies with the temperature.
Second order phase transition: following the Ehrenfest classification, a first order
35
continuous and its second derivative of the free energy with respect to the order
36
References
[1] W. Eerenstein, N. D. Mathur, and J. F. Scott, “Multiferroic and magnetoelectric materials.,” Nature, vol. 442, no. 7104, pp. 759–65, 2006.
[2] Z. Surowiak and D. Bochenek, “Multiferroic materials for sensors, transducers and memory devices,” Arch. Acoust., vol. 33, no. 2, pp. 243–260, 2008.
[3] A. Kargol, L. Malkinski, and G. Caruntu, “Biomedical Applications of Multiferroic Nanoparticles,” Adv. Magn. Mater., pp. 89–118, 2012.
[4] S. L. Hou and N. Bloembergen, “Paramagnetoelectric Effects in NiS O 4 ·6 H 2 O,”
Phys. Rev., vol. 138, no. 4A, pp. A1218–A1226, May 1965.
[5] J. Varignon, D. Fontaine, E. Bousquet, N. C. Bristowe, and P. Ghosez, “Ferromagnetism induced by entangled charge and orbital orderings in ferroelectric titanate perovskites,” Nat. Commun., vol. 6, pp. 1–6, 2015.
[6] P. Toladeno and V. Dmitriev, Reconstructive phase transition: in crystal and quasicrystal. 1996.
[7] W. Zhong, D. Vanderbilt, and K. Rabe, “Phase Transitions in BaTiO3 from First Principles,” Phys. Rev. B, vol. 73, no. 13, p. 1861, 1994.
[8] J. Yu and J. Chu, “Nanocrystalline Barium Titanate,” Encycl. Nanosci. Nanotechnol., vol. 6, pp. 389–416, 2004.
[9] T. P. Dougherty, G. P. Wiederrecht, K. a. Nelson, M. H. Garrett, H. P. Jenssen, and C. Warde, “Femtosecond time-resolved spectroscopy of soft modes in structural phase transitions of perovskites,” Phys. Rev. B, vol. 50, no. 13, pp. 8996–9019, 1994.
[10] K. Uchino, E. Sadanaga, and T. Hirose, “Dependence of the Crystal Structure on Particle Size in Barium Titanate,” J. Am. Ceram. Soc., vol. 72, no. 8, pp. 1555–1558, Aug. 1989.
37
[12] H.-I. Hsiang and F.-S. Yen, “Effect of Crystallite Size on the Ferroelectric Domain Growth of Ultrafine BaTiO3 Powders,” Journal of the American Ceramic Society, vol. 79. pp. 1053–1060, 1996.
[13] S. Schlag and H.-F. Eicke, “Size driven phase transition in nanocrystalline BaTiO3,”
Solid State Commun., vol. 91, no. 11, pp. 883–887, Sep. 1994.
[14] B. Bihari, J. Kumar, G. T. Stauf, P. C. Van Buskirk, and C. S. Hwang, “Investigation of barium titanate thin films on MgO substrates by second-harmonic generation,” J. Appl. Phys., vol. 76, no. 2, p. 1169, 1994.
[15] D. Szwarcman, D. Vestler, and G. Markovich, “The size-dependent ferroelectric phase transition in BaTiO₃ nanocrystals probed by surface plasmons.,” ACS Nano, vol. 5, no. 1, pp. 507–15, 2011.
[16] T. Takeuchi, C. Capiglia, N. Balakrishnan, Y. Takeda, and H. Kageyama, “Preparation of Fine-grained BaTiO3 Ceramics by Spark Plasma Sintering,” J. Mater. Res., vol. 17, no. 03, pp. 575–581, 2011.
[17] S. Nambu and D. A. Sagala, “Domain formation and elastic long-range interaction in ferroelectric perovskites,” Phys. Rev. B, vol. 50, no. 9, pp. 5838–5847, Sep. 1994.
[18] A. Yariv, Introduction to Optical electronics. 1976.
[19] R. C. Miller, “OPTICAL SECOND HARMONIC GENERATION IN PIEZOELECTRIC CRYSTALS,” Appl. Phys. Lett., vol. 5, no. 1, p. 17, 1964.
[20] R. C. Eckardt and R. L. Byer, “Measurement of nonlinear optical coefficients by phase-matched harmonic generation,” Spie, vol. 1561, pp. 119–127, 1991.
![Figure 2.2 Phase transitions for barium titanate[6]](https://thumb-us.123doks.com/thumbv2/123dok_us/8431564.1387912/17.612.107.519.615.664/figure-phase-transitions-for-barium-titanate.webp)

![Figure 2.5 Change in tetrogonality c/a with particle size at room temperature[10]](https://thumb-us.123doks.com/thumbv2/123dok_us/8431564.1387912/20.612.104.513.278.480/figure-change-tetrogonality-c-particle-size-room-temperature.webp)
![Figure 2.6 DSC measurements for BaTiO3 polycrystals with different grain sizes[11]](https://thumb-us.123doks.com/thumbv2/123dok_us/8431564.1387912/21.612.186.419.153.354/figure-dsc-measurements-batio-polycrystals-different-grain-sizes.webp)