R E S E A R C H
Open Access
PolSAR image classification based on
Laplacian Eigenmaps and superpixels
Haijiang Wang
1,2*, Jinghong Han
1and Yangyang Deng
1Abstract
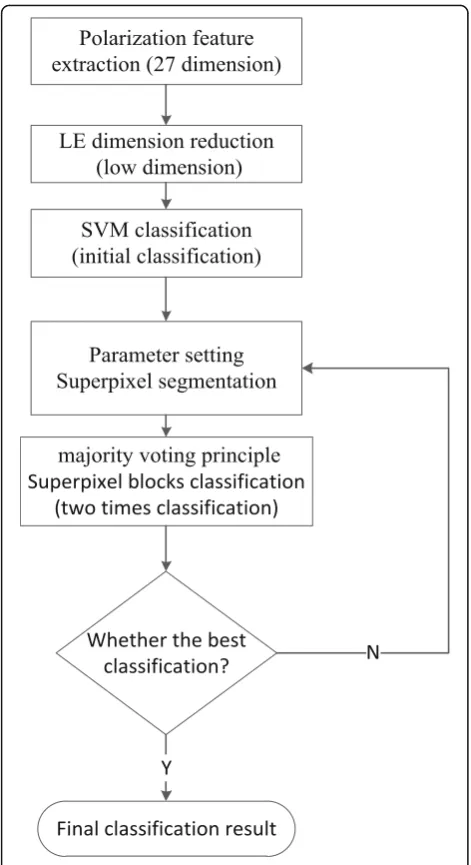
This paper proposes a method of polarimetric synthetic aperture radar (PolSAR) image classification using improved superpixel segmentation and manifold learning. Firstly, a 27-dimension polarimetric feature space is extracted by simple arithmetic operations of polarimetric parameters and polarimetric target decomposition. Secondly, Laplacian Eigenmap (LE) algorithm is used to reduce the dimension of the 27-dimension polarimetric features. This algorithm can reduce redundant information in feature space and extract the main information. Then, the paper uses SVM which has the best classification performance to classify the low-dimension PolSAR data for the first time. And then, the superpixel segmentation is obtained by improving SLIC algorithm. At last, the majority voting principle is used to classify the superpixel blocks, which is the second classification and final classification of PolSAR data.
Keywords:Dimension reduction, SVM, Superpixels, Majority voting principle
1 Introduction
Polarimetric synthetic aperture radar (PolSAR) is an active microwave remote sensing imaging radar, which emits electromagnetic pulses with different polarimet-ric states and then receives echoes reflected by ground objects, so as to obtain the scattering charac-teristics of the ground object target objects. PolSAR imaging principle and conventional optical remote sensing imaging principle is essentially different. PolSAR data is different from the common optical image in characteristic performance; moreover, it contains different information. The polarimetric syn-thetic aperture radar can be used to classify polari-metric SAR images based on the obtained scattering characteristics.
According to scatter characteristics, PolSAR image classification methods can be divided into two categor-ies: the classification method based on statistical model and the polarimetric target decomposition method. The mathematical methods based on the statistical method of statistical model are statistical modeling and Bayes theory [1]. Whether the statistical model is correctly established or not determines the accuracy of the
classification method. The polarimetric target decom-position method can classify the PolSAR image without the probability distribution of data [2], such as H/ɑ, H/A/ ɑdecomposition [3], Pauli decomposition [4], and Kroga-ger decomposition [5].
There are some other ways to classify PolSAR images from other perspectives.
According to whether or not selecting the training samples with class labels in advance, the PolSAR target classification method can be divided into super-vised classification [6–15] and unsupervised classifica-tion [16–23]. The supervised classification requires the selection of labeled training samples and the handling of unlabeled PolSAR image data based on the characteristics of the sample. For unsupervised classification, the required prior knowledge is our em-pirical information and model description of the backscatter characteristics of the feature.
The most common use of PolSAR in supervised classifi-cation is based on the statistical distribution of Bayes distri-bution and Wishart distridistri-bution. The maximum likelihood method based on the complex Gaussian distribution pro-posed by Kong and others is the embryonic form use of Bayes of the PolSAR classification. Due to the influence of speckle, Lee and others proposed a multi-look ML classifi-cation based on the Whishart distribution. Many subse-quent studies were based on the above classification model. * Correspondence:[email protected]
1College of Electronic Engineering, Chengdu University of Information
Technology, Chengdu, Sichuan 610225, China
2CMA Key Laboratory of Atmospheric Sounding, Chengdu, Sichuan 610225,
China
based on Support Vector Machine [26].
There are several problems in the above classification method: Firstly, in some methods, only a little polarimet-ric information has been used. Secondly, in some methods, much polarimetric information has been used to deal with the polarimetric data; however, the high-dimension data can only be reduced to the human-defined low dimension in these methods. Whether the polarimetric data will be lost or not during the dimen-sion reduction has not been considered. Thirdly, many classification methods are based on the pixels, but when the impact of noise is significant, it can easily lead to wrong classifications.
The method proposed in this paper can solve the above problems effectively. Firstly, 27-dimension polari-metric information has been used to classify, both the arithmetic parameters extracted by the polarimetric pa-rameters and the polarimetric papa-rameters after the po-larimetric target being decomposed. The 27-dimension polarimetric information basically includes all the infor-mation of PolSAR, and it overcomes the fact that some polarimetric features extracted in some methods are only a few. Secondly, the maximum likelihood estima-tion (MLE) method is used to estimate the intrinsic di-mension of the data. This method preserves the polarimetric information and reduces the data dimen-sion. Thirdly, the combination of superpixel classifica-tion and the use of the majority of voting principle can effectively inhibit the coherent noise on the classifica-tion. What is more, the classification result is more accurate.
The rest of this paper is organized as follows. The sec-ond part is mainly about the data preprocessing, and the third part is mainly about feature extraction and dimen-sion reduction. Moreover, the fourth part is mainly about classification based on SVM and superpixels, and the fifth part is mainly about the experimental result and analysis. At last, the sixth part is mainly about conclusion.
2 Preprocessing of polarimetric SAR data
According to the original data of PolSAR, the scattering matrix of each pixel point of PolSAR image can be obtained.
According to the upper expression, the polarimetric covariance matrix C and polarimetric coherence matrix Tcan be obtained.
The characteristic parameters needed in this paper can be obtained by using the above polarimetric covariance matrixCand the polarimetric coherence matrixT.
3 Polarimetric features and LE algorithm 3.1 Polarimetric features extraction
In this paper, according to [27], the 27 polarimetric param-eters are extracted for each pixel of the PolSAR image, as shown in Table 1. The first 11 polarimetric features are the polarimetric parameters extracted by performing simple arithmetic operations. Its advantage is that the calculation is simple, and it can reflect some polarimetric information. The latter 16 polarimetric parameters are the polarimetric parameters after polarimetric target decomposition, and
Table 1Twenty-seven feature parameters
Features Expression
Span |shh|2+ 2|shv|2+ |svv|2
Amplitude of HH-VV correlation coefficient
〈shhsvvi
Co-polarized HH backscattering coefficient shhshh
Co-polarized VV backscattering coefficient svvsvv
Co-polarized HV backscattering coefficient shvshv
Freeman-Durden decomposition Ps,Pd,Pv
these polarimetric parameters can describe the scattering information and geometrical structure information of the target [28].
Extracted features include scattering coefficient, polarization ratio, total power, phase, Pauli decompos-ition, Krogager decomposdecompos-ition, Cloud decomposdecompos-ition, Freeman decomposition, and Yamaguchi decompos-ition. Among them, the Pauli decomposition provides three scatter intensities, and the Krogager decompos-ition provides the three components of three scatter-ing. Cloud decomposition provides scattering entropy, scattering angle, and inverse entropy. Moreover, the Freeman decomposition provides three scattered pow-ers, and the Yamaguchi decomposition provides four scattering mechanisms.
3.2 LE algorithm
The dimension reduction methods can be divided into two categories: linear method and nonlinear method. In this paper, the MLE algorithm is used to compute the intrinsic dimension of the above 27-dimension polarimetric parameters in low dimensions. The MLE method means obtaining the maximum likelihood es-timation of the intrinsic dimension by establishing the likelihood function between the nearest neighbors. In some articles, the dimension after data reduction is
set arbitrarily, so it will inevitably cause the informa-tion loss. The MLE method can preserve the essential features of the original data in the maximum extent and can make the original data be expressed in low dimensions. LE algorithm is used to reduce the di-mensions, and this approach can make high-dimension polarimetric features to be represented in low dimensions while retaining the main polarimetric information. It can be seen that this method can make full use of the polarimetric information and re-duce the computational complexity of the subsequent processing. LE algorithm adopts local nonlinear method, and compared with the linear method, it can better express the real corresponding relation between the data. What is more, LE algorithm has low compu-tational complexity and is often used to deal with the data of PolSAR image.
Let X= {x1,x2⋯xN}∈R D×N
, where C represents the dimension of X and N represents the number of data in the X. Low dimension Y which is embedded in high-dimension X space can be found when using the LE algorithm, that is Y¼fy1;y2⋯yNg∈RDrN. Among the expressions, N represents the number of data in the X and Dr<D, where Dr represents the dimension of Y.
The objective function of the LE algorithm is to minimize the following cost function, and it can en-sure that the adjacent sample points are still neigh-bors after projection.
minX
ij yi−yj
Wij ð4Þ
where Wij¼e− xi−xj k k2
t , and it reflects the relationship between samples. In order to ensure that the above function have only one solution, the scaling Fig. 1LE dimension reduction.aThe manifold of source data in three dimensions.bNonlinear mapping in two-dimension space
normalization condition must be added. Then, the objective function changes into
arg minYLYT ð5Þ
whereLis Laplacian matrix, and L=D−W,Diiis the di-agonal matrix, and Dii¼
P
jWij. The above function can be transformed into a generalized eigenvalue problem, that is
LY¼λDY
The lower dimension embeddingYtakes the eigenvec-tors of the corresponding eigenvalues of the Laplacian matrix
The function of the support vector machine (SVM) is to use the hyperplane to separate each category. SVM the-ory is proposed by Vapnik and Cortes in 1995, and it is used to solve the problem of pattern recognition prob-lem. At that time, SVM belonged to a linear classifica-tion model, and then, Boser, Guyon, and Vapnik introduced the kernel function, and they proposed non-linear SVM. SVM is a new learning machine built on VC (Vapnik-Chervonenkis) dimension and structural risk minimum principle of SLT, and it is mainly used for classification and regression analysis. SVM has peculiar advantages in solving nonlinear and high-dimension pat-tern recognition, and it has better generalization ability than that of the general learning machine.
Suppose that (xi,yi), where i= 1,2...,n denote a linear separable sample set, and x∈Rd,y∈{+1,−1}. Linear dis-criminant function in D dimension space isg(x) =wx+b, and the classification surface function is wx+b= 0. Make all samples satisfy |g(x)|≥1 by sample normalization, that is, the nearest sample of distance classification surface satisfies that |g(x)| = 1. Thus, the classification interval is equal to 1
2k kw . Therefore, when
the‖w‖(or‖w‖2) minimum andyi(wxi+b)−1≥0, where i= 1,2...,n are satisfied, the classification surface is the optimal classification surface.
The optimal classification problem can be transformed into a constrained optimization problem as follows:
minseφðw;bÞ ¼1 2k kw
2 ð7Þ
st: yiðxi⋅wþbÞ−1≥0 i¼1;2;⋯l ð8Þ
Therefore, the optimal classification function can be obtained as follows:
f xð Þ ¼ sgnfw⋅xþbg
¼ sgn Xk
i¼1a
iyiðxi⋅xÞ þb
n o
ð9Þ
where a∗ and b∗ are the parameters that define the hyperplane.
When the data are linearly non-separable, a relaxation term ξi≥0 can be added to the constraint condition as follows:
st: yiðxi⋅wþbÞ−1þξi≥0 i¼1;2;⋯l ð10Þ
Change the target to solve the minimum value of 1 2
w k k2þ
C Pni¼1ξi
, whereCis a constant andC> 0. The nonlinear classification can be realized by using proper kernel function K(xi,xj) in the best classification plane, while its computational complexity will not in-crease [11]. The corresponding classification function will change as follows:
f xð Þ ¼ sgn Xk i¼1a
iyiK xð i⋅xÞ þb
n o
ð11Þ
And this is the SVM method.
The several frequently used kernel functions are linear kernel, polynomial kernel, RBF kernel, and Sigmoid ker-nel. The linear kernel is mainly used in linearly separable situation. The polynomial kernel can map low-dimension input space to high-low-dimension feature space. However, there are many parameters in polynomial ker-nel. When the order of polynomial is high, the element value of kernel matrix tends to be infinite or infinitesi-mal. The computational complexity will be too large to calculate. RBF kernel is a kind of kernel function with
strong locality, and it can map a sample into a more higher dimension space. It is the most widely used ker-nel. Whether or not the amount of the samples are large or small, it has great performance. And comparing with polynomial kernel, the parameter of RBF kernel is fewer. Therefore, SVM uses RBF kernel preferential in the ma-jority of cases. The non-positive semi-definiteness of Sig-moid kernel makes its application limited. So, SVM selects RBF kernel in this paper.
4.2 Improvement of SLIC algorithm
The original PolSAR image has huge amounts of data, but the subsequent computation of the data can be greatly reduced by using the superpixels method. At the same time, superpixels can provide adaptive neighbor-hood information and reduce the influence of speckle on PolSAR image. At present, various superpixel generation algorithms are widely used in dealing with optical image, such as watershed algorithm [29], mean shift algorithm [30], and K-mean algorithm [31].
With the technology development for obtaining re-mote sensing data, the resolution of rere-mote sensing image is increasing. While the resolution has improved,
oat winter wheat coniferous forests black wheat
a
c
b
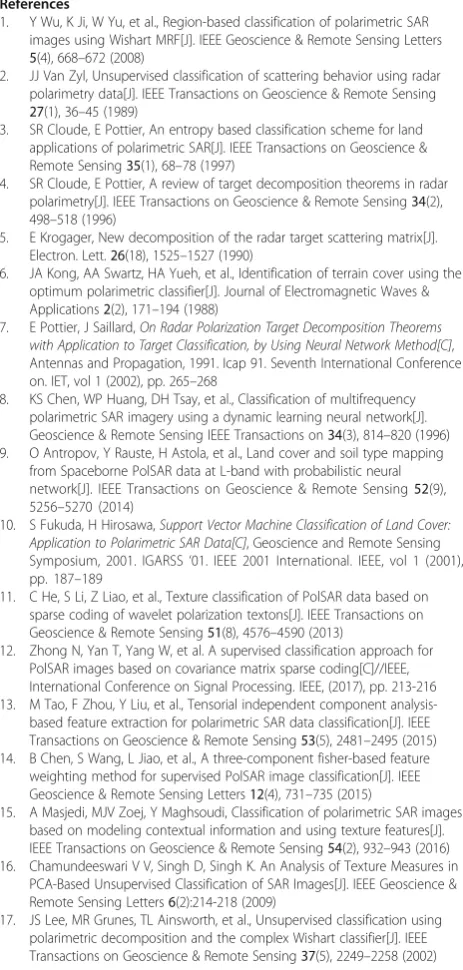
Fig. 4The PolSAR image and truths plots in Foulum.aThe color image of the Pauli decomposition of RGB.bThe ground reference map.cThe image of colored objects
the amount of remote sensing image data and the re-dundant information is also increasing, and it is not con-ducive to the processing of remote sensing image. However, the introduction of superpixels can solve those problems effectively, so the application of superpixels in remote sensing image is also increasing. The superpixel blocks generated by the SLIC method are more suitable for the boundary than other methods by comparing the effects of different superpixels. Therefore, the method based on SLIC superpixel generation has been chosen to improve the effect in this paper.
dcð Þ ¼i;j lj−li 2þ αj−αi
2
þ βj−βi
2
ð13Þ
DSLICð Þ ¼i;j d2cð Þ þi;j
dsð Þi;j Smax
η2
1
2
ð14Þ
where Ns is the maximum spatial distance within class, and theηis the weight.
Finally, update the center of the superpixels and itera-tive optimization.
Because the SLIC algorithm is used to deal with lαβ color spaces, it cannot deal with PolSAR image. The color distance of optical imagedcshould be transformed into gray scale as follows:
d0cð Þ ¼i;j gj−gi2
1
2
ð15Þ
DSLICð Þ ¼i;j d’c2ð Þ þi;j
dsð Þi;j Smax
η2
1
2
ð16Þ
wheregiis the grayscale value of theith pixels.
4.3 The majority voting principle
SVM classifies polarimetric information with the single pixel without considering properties of adjacent pixels. The way proposed in this paper makes the classification more accurate by making full use of superpixels and in-formation of the surrounding pixels [15]. The way to use the majority voting principle to classify superpixel blocks is as follows:
Firstly, each superpixel block is considered as a set, and the pixels in the set are classified by SVM to obtain the multiple labels.
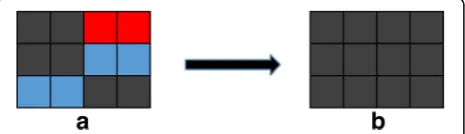
Secondly, count the number of different labels in the superpixel blocks. The label with the largest number is the label of this set. Finally, the purpose to classify the superpixel blocks is achieved. The diagram is shown in Fig. 2, and each small box represents a pixel, while the large box represents a superpixel block.
The basic flow chart of classification is shown in Fig. 3.
5 The result and analysis of the experiment The data used in the paper is the full PolSAR data in C band. The data was obtained from the EMISAR system Fig. 6The superpixels generated with different parameters.aa= 7,
p= 3.ba= 11,p= 5.ca= 14,p= 6.da= 16,p= 7
Fig. 7The result of classification by using the majority voting principle in the superpixel blocks.aa= 7,p= 3.ba= 11,p= 5.ca
in the area of Foulum in Denmark in April of 1988. In this paper, the size of experimental area is 211 × 244. The RGB reference map after Pauli decomposition and ground reference map are shown in Fig. 4a, b, respect-ively. The image contains four types of ground features: oats, winter wheat, coniferous forests, and black wheat.
5.1 The result of SVM classification
Ten percent of each class of data were selected as train-ing samples, and all data were used as test samples. SVM is used to classify the data with only three polari-metric parameters and the data with polaripolari-metric pa-rameters after reducing dimension, respectively. In this
paper, the MLE is used to estimate the intrinsic dimen-sion of the 27-dimendimen-sion polarimetric feature informa-tion. Finally, the intrinsic dimension of five dimensions has been obtained. In this paper, five cross-validation methods are used to obtain the optimal parameters of SVM, and the SVM uses RBF kernel function. The range of kernel parameter is [2−8, 28]. The range of penaliza-tion factor is [2−8, 28]. Figure 5a, b, represents the classi-fication by using the three polarimetric parameters and the polarimetric parameters after reducing dimension.
As is shown in Fig. 5, by using only a few polarimetric parameters may not obtain the correct classification re-sult. The effect of classification with polarimetric fea-tures after reducing dimension is better, and it can distinguish the categories. In Fig. 5a, black wheat and coniferous forests cannot be distinguished, and some oat are divided into coniferous forests. So, reducing the di-mension of multiple polarimetric data can improve the classification accuracy. The classification result of the SVM is not intuitive and affected greatly by noise. Therefore, it needs to be further processed.
5.2 The classification result of combining superpixels with majority voting principle
The result of the SVM classification is combined with superpixels to classify again. The parameter setting of superpixels affects the classification result directly. Only with optimal parameter can the optimal classification re-sult be gained. Superpixel segmentation is decided by the superpixel block’s side length a and the central point’s perturbation range p. Figure 6 shows the super-pixels generated with different parameters.
Figure 7 shows the result of classification by using the majority voting principle in the superpixel blocks, and the LE algorithm is used to reduce dimension.
Fig. 8The OA of classification corresponding to different superpixel generation parameters
Fig. 9The classification result of the PolSAR image by different dimension reduction methods.aPCA + SVM + superpixels.bLDA + SVM + superpixels.cLE + SVM + superpixels.
dMVU + SVM + superpixels
Figure 10 shows the OA of classification with different dimension reduction methods. It can be seen that with LE dimension reduction, the best classification result is obtained.
6 Summary and conclusions
This paper proposes a PolSAR image classification method by using the improved superpixel segmentation and manifold learning. The method combines pixel in-formation with spatial inin-formation for classification. The paper consists of four steps. Firstly, a 27-dimension po-larimetric parameter vector is obtained from the polari-metric SAR data. Secondly, dimension reduction with LE algorithm is carried out on the polarimetric param-eter vector. And then, pixels are classified by using the SVM method. At last, the superpixels are combined to classify the targets. This paper combines the LE method and MLE method to reduce dimension of data and the intrinsic structure in high-dimension data space can be found, and the dimension of feature parameter can be reduced. Moreover, the primary polarimetric information can be remained, and the polarimetric information can be utilized effectively. For the classification method, clas-sifying superpixel blocks with majority voting principle is simple and effective, and it can reduce redundant in-formation of high-resolution image and noise influence of SAR image. Moreover, it can save much computation for subsequent processing. On the whole, the classifica-tion method in this paper improves the visibility of clas-sification result and makes the boundaries of the classified image more obvious. The classification effect is more accurate, and an accuracy rate over 90% can be reached.
Acknowledgements
The authors are grateful for the helpful insights provided by Dr. Jilan Feng.
Availability of data and materials
The datasets supporting the conclusions of this article are available at the web address https://earth.esa.int/web/polsarpro/data-sources/sample-datasets. The data can be read by the software PolSARpro which can be downloaded at the web address https://www.ietr.fr/polsarpro/.
Authors’contributions
HJW carried out polarimetric feature extraction on the polarimetric SAR data and reduced the dimension of feature space with Laplacian Eigenmap (LE) algorithm. JHH conducted the classification of PolSAR feature data after dimension reduction with SVM and obtained the superpixel segmentation.
Springer Nature remains neutral with regard to jurisdictional claims in published maps and institutional affiliations.
Received: 21 September 2017 Accepted: 14 November 2017
References
1. Y Wu, K Ji, W Yu, et al., Region-based classification of polarimetric SAR images using Wishart MRF[J]. IEEE Geoscience & Remote Sensing Letters 5(4), 668–672 (2008)
2. JJ Van Zyl, Unsupervised classification of scattering behavior using radar polarimetry data[J]. IEEE Transactions on Geoscience & Remote Sensing 27(1), 36–45 (1989)
3. SR Cloude, E Pottier, An entropy based classification scheme for land applications of polarimetric SAR[J]. IEEE Transactions on Geoscience & Remote Sensing35(1), 68–78 (1997)
4. SR Cloude, E Pottier, A review of target decomposition theorems in radar polarimetry[J]. IEEE Transactions on Geoscience & Remote Sensing34(2), 498–518 (1996)
5. E Krogager, New decomposition of the radar target scattering matrix[J]. Electron. Lett.26(18), 1525–1527 (1990)
6. JA Kong, AA Swartz, HA Yueh, et al., Identification of terrain cover using the optimum polarimetric classifier[J]. Journal of Electromagnetic Waves & Applications2(2), 171–194 (1988)
7. E Pottier, J Saillard,On Radar Polarization Target Decomposition Theorems with Application to Target Classification, by Using Neural Network Method[C], Antennas and Propagation, 1991. Icap 91. Seventh International Conference on. IET, vol 1 (2002), pp. 265–268
8. KS Chen, WP Huang, DH Tsay, et al., Classification of multifrequency polarimetric SAR imagery using a dynamic learning neural network[J]. Geoscience & Remote Sensing IEEE Transactions on34(3), 814–820 (1996) 9. O Antropov, Y Rauste, H Astola, et al., Land cover and soil type mapping
from Spaceborne PolSAR data at L-band with probabilistic neural network[J]. IEEE Transactions on Geoscience & Remote Sensing52(9), 5256–5270 (2014)
10. S Fukuda, H Hirosawa,Support Vector Machine Classification of Land Cover: Application to Polarimetric SAR Data[C], Geoscience and Remote Sensing Symposium, 2001. IGARSS‘01. IEEE 2001 International. IEEE, vol 1 (2001), pp. 187–189
11. C He, S Li, Z Liao, et al., Texture classification of PolSAR data based on sparse coding of wavelet polarization textons[J]. IEEE Transactions on Geoscience & Remote Sensing51(8), 4576–4590 (2013)
12. Zhong N, Yan T, Yang W, et al. A supervised classification approach for PolSAR images based on covariance matrix sparse coding[C]//IEEE, International Conference on Signal Processing. IEEE, (2017), pp. 213-216 13. M Tao, F Zhou, Y Liu, et al., Tensorial independent component analysis-based feature extraction for polarimetric SAR data classification[J]. IEEE Transactions on Geoscience & Remote Sensing53(5), 2481–2495 (2015) 14. B Chen, S Wang, L Jiao, et al., A three-component fisher-based feature
weighting method for supervised PolSAR image classification[J]. IEEE Geoscience & Remote Sensing Letters12(4), 731–735 (2015)
15. A Masjedi, MJV Zoej, Y Maghsoudi, Classification of polarimetric SAR images based on modeling contextual information and using texture features[J]. IEEE Transactions on Geoscience & Remote Sensing54(2), 932–943 (2016) 16. Chamundeeswari V V, Singh D, Singh K. An Analysis of Texture Measures in
PCA-Based Unsupervised Classification of SAR Images[J]. IEEE Geoscience & Remote Sensing Letters6(2):214-218 (2009)
18. AP Doulgeris, SN Anfinsen, T Eltoft, Classification with a non-Gaussian model for PolSAR data[J]. IEEE Transactions on Geoscience & Remote Sensing46(10), 2999–3009 (2008)
19. LQ Lin, H Song, PP Huang, et al.,Unsupervised Classification of PolSAR Data Using Large Scale Spectral Clustering[C], Geoscience and remote sensing symposium. IEEE (2014), pp. 2814–2817
20. S Wang, K Liu, J Pei, et al., Unsupervised classification of fully polarimetric SAR images based on scattering power entropy and copolarized ratio[J]. IEEE Geoscience & Remote Sensing Letters10(3), 622–626 (2013) 21. G Liu, M Li, Y Wu, et al., PolSAR image classification based on Wishart TMF
with specific auxiliary field[J]. IEEE Geoscience & Remote Sensing Letters 11(7), 1230–1234 (2014)
22. AP Doulgeris, An automatic u-distribution and Markov random field segmentation algorithm for PolSAR images[J]. IEEE Transactions on Geoscience & Remote Sensing53(4), 1819–1827 (2014)
23. JS Lee, MR Grunes, E Pottier, et al., Unsupervised terrain classification preserving polarimetric scattering characteristics[J]. Geoscience & Remote Sensing IEEE Transactions on42(4), 722–731 (2004)
24. CT Chen, KS Chen, JS Lee, The use of fully polarimetric information for the fuzzy neural classification of SAR images[J]. IEEE Transactions on Geoscience & Remote Sensing41(9), 2089–2100 (2003)
25. KU Khan, J Yang,Novel Features for Polarimetric SAR Image Classification by Neural Network[C], International Conference on Neural Networks and Brain, 2005. Icnn&b. IEEE (2005), pp. 165–170
26. Yuan C, Casasent D. A new SVM for distorted SAR object classification[J]. In: Proceedings of SPIE - The International Society for Optical Engineering, (2005), 5816
27. H Cao, H Zhang, C Wang, et al.,Supervised Locally Linear Embedding for Polarimetric SAR Image Classification[C], Geoscience and Remote Sensing Symposium (IGARSS), 2016 IEEE International. IEEE (2016), pp. 7561–7564 28. Agrawal N, Kumar S, Tolpekin V. Polarimetric SAR interferometry-based
decomposition modelling for reliable scattering retrieval[C]// SPIE Asia-Pacific Remote Sensing, (2016), p. 987708
29. L Vincent, P Soille, Watersheds in digital spaces: an efficient algorithm based on immersion simulations[J]. IEEE Transactions on Pattern Analysis & Machine Intelligence13(6), 583–598 (1991)
30. Comaniciu D, Meer P. Mean Shift: A Robust Approach Toward Feature Space Analysis[M]. IEEE Computer Society, 2002.