Theses and Dissertations
2016
Influence Of Built Environment On Physical
Activity Outcomes Among African Americans In
Community-Based Obesity Intervention Studies
Amanda Sue ThomasUniversity of South Carolina
Follow this and additional works at:https://scholarcommons.sc.edu/etd Part of theEpidemiology Commons
This Open Access Thesis is brought to you by Scholar Commons. It has been accepted for inclusion in Theses and Dissertations by an authorized administrator of Scholar Commons. For more information, please [email protected].
Recommended Citation
INTERVENTION STUDIES
by
Amanda Sue Thomas
Bachelor of Science Hope College, 2013
Submitted in Partial Fulfillment of the Requirements
For the Degree of Master of Science in Public Health in
Epidemiology
The Norman J. Arnold School of Public Health
University of South Carolina
2016
Accepted by:
Swann A. Adams, Director of Thesis
Jan M. Eberth, Reader
Robert R. Moran, Reader
For Mark, Brad, Bryan, Brittani and the late Donna Thomas who continue
to support me in my academic endeavors wherever they lead me. Also, for my
friends near and far and classmates in the Epidemiology 2014 cohort who have
Special thanks to Dr. Swann A. Adams for her insight, direction, and
expertise in this work; additional thanks to Dr. Jan A. Eberth, Dr. Robert Moran,
and Amber Watson for consultation in this effort. Also, thank you to Dr. James
Hibbert and Dr. Kevin Remington for their imminent conference in the ArcGIS
More than sixty-five percent of people in the U.S. are considered overweight or
obese. African-Americans in the U.S. have a higher risk of obesity than any other
racial group. One way to reduce this statistic is physical activity. Recreational
green spaces (parks) can serve as an avenue to complete the 150 min/wk of
recommended physical activity for adults by the ACSM. Data from SISTAS and
HEALS interventions, that recruited overweight/obese African-Americans from
Columbia and Florence, SC, was used to assess the association of recreational
green space (parks) around a residence and physical activity. Physical activity
measures of RAPA questionnaire (self-report), SenseWear® armband data
(objective), and objective inflammatory biomarkers of interleukin-6 (IL-6) and
C-Reactive protein (CRP) were utilized. Few, statistically significant, inverse
associations were seen between amount of parks around a residence and
physical activity for both the RAPA questionnaire and energy expenditure,
evaluated by armband data. Positive associations were observed for
inflammatory biomarkers at 0.75 (CRP: OR= 2.72; IL-6: OR= 2.532) and 5.0
(CRP: OR=1.811; IL-6: OR= 1.913) mile buffer regions for participant
neighborhoods. No linear trends were observed with different buffer regions and
more/less physical activity in any measurement. More research is needed to
decipher the association that recreational green space (parks) have on physical
DEDICATION ... iii
ACKNOWLEDGEMENTS ... iv
ABSTRACT ... v
LIST OF TABLES ... viii
LIST OF FIGURES ... x
CHAPTER 1:INTRODUCTION ... 1
1.1STATEMENT OF THE PROBLEM ... 1
1.2SIGNIFICANCE ... 4
1.3SPECIFIC AIMS ... 6
CHAPTER 2:LITERATURE REVIEW ... 16
2.1OBESITY AND SOUTH CAROLINA ... 16
2.2PHYSICAL ACTIVITY ... 18
2.3BUILT ENVIRONMENT INFLUENCE ON PHYSICAL ACTIVITY ... 20
2.4DISTANCES TO PAOPPORTUNITIES;NEIGHBORHOODS ... 21
2.5SELF-REPORT VS.OBJECTIVE MEASURES ... 22
2.6BIOMARKERS ... 23
2.7ARMBAND DATA AND PA ... 24
2.8POTENTIAL CONFOUNDERS/EFFECT MODIFIERS ... 25
3.2STUDY DESIGN ... 34
3.3SAMPLE SIZE ... 35
3.4RAPAQUESTIONNAIRE ... 36
3.5SENSEWEAR®ARMBAND ... 36
3.6DATA ANALYSIS ... 37
3.7VARIABLES ... 39
3.8POTENTIAL CONFOUNDERS AND EFFECT MODIFIERS ... 42
CHAPTER 4:RESULTS ... 46
CHAPTER 5:CONCLUSION/DISCUSSION ... 69
5.1SUMMARY OF RESULTS ... 69
5.2SIGNIFICANCE OF FINDINGS ... 70
5.3STRENGTHS AND WEAKNESSES ... 73
5.4FUTURE RESEARCH ... 74
Table 1.1 Summary of Selected Studies Investigating the Built
Environment/Parks and Measures of Physical Activity in Adults ... 9
Table 2.1 American College of Sports Medicine Recommendations of Adult Physical Activity over Time, 1975-2000 ... 30
Table 3.1 Inflammation Biomarker Dichotomization ... 45
Table 3.2 Categorization of Buffer Region Counts ... 45
Table 3.3 Frequencies of Participants in Defined Buffer Region Categories ... 45
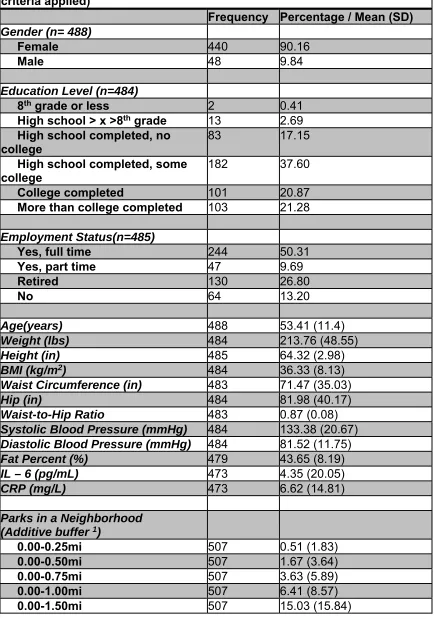
Table 4.1 Baseline Characteristics of Study Participants (before exclusion criteria applied) ... 55
Table 4.2 Baseline Characteristics of Study Participants (after exclusion criteria applied) ... 56
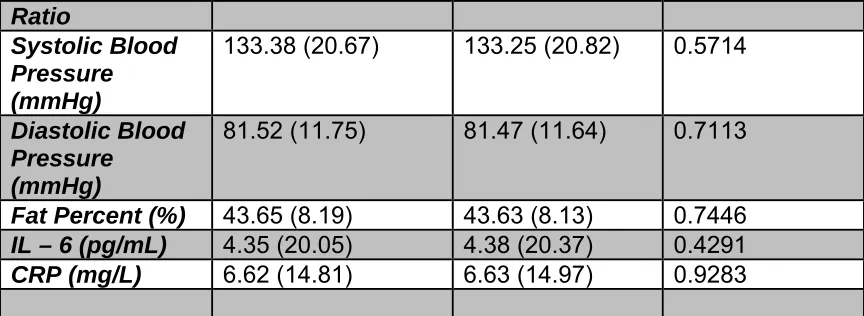
Table 4.3 Association of Descriptive Statistics Before and After Exclusion Criteria ... 58
Table 4.4 Univariable Analyses of Potential Confounders/ Effect Modifiers ... 59
Table 4.5 Association between Inflammation Biomarkers (continuous) and Recreational Green Space (park) Counts ... 60
Table 4.6 Association between Inflammation Biomarkers (dichotomized) and Recreational Green Space (park) Counts ... 60
Table 4.7 Association between Inflammation Biomarkers (continuous) and Recreational Green Space (park) Counts (categorical) ... 61
Table 4.8 Association between Inflammation Biomarkers (dichotomous) and Recreational Green Space (park) Counts (categorical) ... 62
Table 4.11 Adjusted Associations between RAPA scores and Recreational Green Space (park) Counts (continuous) ... 64
Table 4.12 Crude Associations between RAPA scores and Recreational Green Space (park) Counts (categorical) ... 65
Table 4.13 Adjusted Associations between RAPA scores and Recreational Green Space (park) Counts (categorical) ... 65
Table 4.14 Significant Covariate Adjusted Associations between RAPA scores and Recreational Green Space (park) Counts (categorical) ... 66
Table 4.15 Association between Energy Expenditure (kilocalories) and
Recreational Green Space (park) Counts (continuous) ... 67
Table 4.16 Association between Energy Expenditure (kilocalories) and
Recreational Green Space (park) Counts (categorical) ... 67
Table 4.17 Associations between Energy Expenditure (kilocalories) and
Figure 3.1 HEALS Study Protocol ... 43
INTRODUCTION
1.1 Statement of the problem
Obesity is a national epidemic that has plagued the U.S. for multiple
decades. Between 1976-1980 and 2007-2008, NHANES data has reported the
prevalence of obesity to have more than doubled for adults aged 20-74(Cynthia L
Ogden & Carroll, 2010). More than sixty-five percent of people in the U.S. are
considered overweight or obese (Flegal et al., 2012; Center for Disease Control
and Prevention, 2012). These individuals run a higher risk for diabetes, cancer,
and cardiovascular disease among other ailments (Font-Burgada, Sun, & Karin,
2016; N. I. o. Health, 2012; Lavie, Parto, & Archer, 2016). With our nation
growing heavier, the determinants of this weight crisis are important to consider
as well as the individuals it affects most.
According to data from the 2011 National Health and Nutrition
Examination Survey, African-Americans in the U.S. have a higher risk of obesity
than any other racial group(N. C. f. H. S. Centers for Disease Control and
Prevention, 2011-2012; Wang & Beydoun, 2007). Non-Hispanic blacks have the
highest age-adjusted rates of obesity at 47.8%(C. L. Ogden, Carroll, Kit, &
Flegal, 2014), making this group more susceptible to the long-term effects of
excessive weight. Time has also been an influential factor in survival of those
the importance paid to a person’s weight loss and/or gain is crucial. Some of the
leading risk factors for obesity are poor diet and insufficient physical activity(H. T.
H. C. S. o. P. Health), both modifiable aspects of lifestyle.
Physical inactivity has become an alarming problem in the United States.
As BMI increases so do the expenses of medical claims and healthcare costs
(The Robert Wood Johnson Foundation, 2005). Specifically, suffering from
obesity amounts to an estimated $147-210 billion per year of medical costs
(Finkelstein, Trogdon, Cohen, & Dietz, 2009). Since 2001 the American College
of Sports Medicine has recommended the amount of aerobic activity for an adult
as 150 min/week (Donnelly et al., 2009; Haskell et al., 2007; Jakicic et al.,
2001).In South Carolina, less than half of adults engage in the recommended
amounts of physical activity and over 25% admit to not exercising at all in the
past month, which sits below the national average (N. C. f. C. D. P. a. H. P.
Centers for Disease Control and Prevention, Division of Population Health, 2014;
Mokdad, Ford, Bowman, & et al., 2003; Centers for Disease Control and
Prevention, 2008, 2014b).
One of the Healthy People 2020 objectives emphasizes the importance of
the built environment and physical activity through legislation. Specifically, the
objective states, “developing community-scale policies for the enhancement of
access to the built environment and physical activity opportunities (Promotion,
2008)”. In order to develop these policies, research must be done into the built
neighborhood or regional measures. Dimensions of the built environment include
density and intensity, land use mix, street connectivity, street scale, aesthetic
qualities, and regional structures(Handy, Boarnet, Ewing, & Killingsworth).
Analyzing these different dimensions can shed light on the way neighborhoods
are set up for the people who live in them. Physical activity has been
hypothesized as a crucial mechanism in which built environments can affect
chronic diseases such as obesity (Frank, Engelke, & Schmid, 2003; Frumkin,
Frank, & Jackson, 2004; Papas et al., 2007). Improving access to and availability
of physical activity opportunities empowers individuals towards healthier lifestyles
when in growing communities. However, availability of recreational green space
without encouragement of exercise is insufficient to make an impact.
Local neighborhood initiatives specific to the populations they effect can
be critical to prolonged change. Interventions tailored to high-risk populations
have shown to reduce the amount of obesity and in turn adverse health
outcomes such as cardiovascular disease and type II diabetes (Crane, Lutes,
Ward, Bowling, & Tate, 2015; Douketis, Macie, Thabane, & Williamson, 2005;
"Multiple risk factor intervention trial: Risk factor changes and mortality results,"
1982). Built environments, if designed with evidence-based practices in mind,
can help to entice inhabitants towards lives of physical fitness (Handy et al.). It
has been shown that in most cases the availability and proximity to recreation
Ainsworth, & Addy, 2004).
1.2 Significance
The Centers for Disease and Control and Prevention specify that 1 in
every 4 deaths is from heart disease(N. C. f. H. S. Centers for Disease Control
and Prevention, 2015). One of the leading contributions to heart disease is
obesity, which can result from the lack of physical activity. It is recommended that
adults obtain 30 minutes of moderate-intensity aerobic activity five times per
week(Centers for Disease Control and Prevention). Despite this
recommendation, many Americans do not meet this standard. More alarming is
that under 20% of non-Hispanic blacks meet the U.S. Office of Disease
Prevention and Health Promotion’s 2008 Physical Activity guidelines (Centers for
Disease Control and Prevention, 2008).
The “stroke belt” or the Southern states of Alabama, Arkansas, Georgia,
Louisiana, Mississippi, North Carolina, South Carolina and Tennessee, have a
higher rate of physical inactivity more than any other location in the U.S.(Centers
for Disease Control and Prevention, 2008). Factors ranging from unique location
aesthetics to dietary norms can combine to produce this concerning observation.
Environmental factors including lack of parks, sidewalks and sports/recreation
facilities can be identified as potential causes for inactivity(Organization). Density
environment planning in the future.
Physical activity interventions can be an important avenue for
counteracting substantial weight gain. The American College of Sports Medicine
reports that numerous studies have validated that prolonged moderate-intensity
PA of ≥150 min/wk helps to prevent weight gain and can induce loss when
combined with energy intake moderation(Donnelly et al., 2009).Longitudinal
analysis of this component can add to the minimal breadth of knowledge about
the interaction of exercise interventions and built environment.
This study uniquely looks at individuals in a diet and lifestyle intervention,
which aims to help reduce the burden of their overweight or obese status, to
identify those characteristics in their built environment that influence their
exercise regimen. These specific cohorts (SISTAS and HEALS) of
African-Americans have not been specifically researched on their basis of recreational
green space (parks). Additionally, the assessment of physical activity via
inflammation biomarkers (IL-6 and CRP) in this population has not been done
and scarcely reported as a measurement of physical activity. Furthermore the
comprehensive mapping of Florence and Columbia, SC area parks and
recreational facilities has not been done for this population and area and may
give insight into city, state and county planning when designing living areas most
suitable for recreational opportunity. Through this work, the built environment of
parks around a person can be considered for influence on physical activity
have with their surrounding recreational opportunities at baseline.
Ensuring that ample opportunities for recreational physical activity in
neighborhoods exist in South Carolina is critical to reducing the burden of obesity
on its people. However, there has been inconsistent data on whether or not the
simple availability of recreational facilities or a specific component of the built
environment promotes more physical activity (Ding, Sallis, Kerr, Lee, &
Rosenberg, 2011; Feng, Glass, Curriero, Stewart, & Schwartz, 2010). Table 1.1
illustrates the inconsistent results that have been found between the built
environment (specifically parks and recreational facilities) and measures of
physical activity among adults.
This study implores similar study designs and techniques for analysis that
have been done previously in order to add to the breadth of knowledge on this
association. In addition, it explores this association with a specific population of
overweight/obese African-American individuals enrolled in a diet and physical
activity intervention program conducted in South Carolina.
1.3 Specific Aims
Physical activity is a recognized key component of health. Environments
that support physical activity provide opportunities for the people that live in them
to lead healthier lives. In the past there has been inconsistent data on defining
what an ideal environment for the promotion of physical activity. Very little
so for populations of African-Americans. A retrospective, cross-sectional
analysis, this thesis aims to decipher:
1. The makeup of African American participants in the SISTAS and HEALS
interventions based on their residential locations and landscape of recreational
opportunities available to them.
Hypothesis: The population of African-Americans that are being analyzed will
have poor health characteristics (weight, BMI, fat percent, IL-6, and CRP values)
and access to recreational facilities in their neighborhoods.
2. If the buffer region of recreational green spaces has an association with
physical activity outcomes in an overweight African American population based
on their self-report Rapid Assessment of Physical Activity [RAPA]
questionnaire(Topolski et al., 2006)).
Hypothesis: The lower the amount of recreational green space opportunities
available in an area, the less physically active the participants will be.
3. If buffer region of recreational green spaces has an association with
physical activity outcomes in an overweight African American population based
on their objective measures (inflammation biomarkers of CRP and IL-6 via blood
samples; concurrently armband PA data for a subset of HEALS participants via
energy expenditure)
Hypothesis: The lower the amount of recreational green space opportunities
9
Table 1.1 - Summary Table of Selected1 Studies Investigating the Built Environment/Parks and Measures of
Physical Activity in Adults
Study Design Lead Author Year of Published Location & Subjects Physical Activity Assessment Built Environment Measurement Results2
Cross-sectional Carlson et al. (Carlson et al., 2012) 2012 Baltimore and Seattle-Kings County ; Seniors, average age of 74.4
(n =719)
Average minutes of MVPA per week based on ActiGraph accelerometer recordings
Objective density (# of parks
within 500 m buffer of home)
dichotomized into none versus some.
Non-significant; interactions related to walking for leisure tended to involve walking
infrastructure (interactions involving access to parks and recreation facilities and neighborhood aesthetics displayed a trend for significance) Cross- sectional Cohen, DA. (Deborah A. Cohen et al.) 2016, in press United States cities; 174 parks SOPARC (System of Observing Play and Recreation in Communities) Validated
Observation Tool
List of public parks was retrieved, either supplied directly by the city’s Department of
Recreation and Parks or from
their website
Average neighborhood park of 8.8 acres averaged 20 users/hour or an estimated 1,533 person hours of weekly use. Walking loops and gymnasia each generated 221 hours/week of moderate to
vigorous physical activity
Cross-sectional Fisher KJ (Fisher, Li, Michael, & Clevelan d, 2004)
2004 Portland, OR;
582 survey respondents (182 men, 400 women) at random from 56 neighborhoods Survey question responses: three items assessed neighborhood walking activity, reflecting levels of physical activity predominantly involving walking ; mean
Facilities for walking (trails, paths,
parks) per neighborhood acre
Neighborhoods having greater proportions of low-income house-
holds (<$15,000), more senior residents, more facilities for walking (trails, paths,
10 neighborhood walking-activity score (consistency and reliability checked)
associated with higher levels of neighborhood walking activity.
Cross-sectional Hall and McAuley (Hall & McAuley, 2010) 2010 Convenience sample; Older women, average age of 69.9
(n = 128)
>10,000 steps/day vs. ≤10,000
steps/day based on Actigraph
accelerometer recordings
Density and proximity: Presence and number of parks
within 1 km of home (GIS)
Non-significant;
Number of parks within 1 km of residence was not significantly different for those who had >10,000 steps/day vs. ≤10,000 steps/day (p = 0.15)
Cross-
sectional Jilcott et al.(Jilcott, Evenson, Laraia, & Ammerm an, 2007)
2007 North Carolina;
Women, average age 53 years (n = 199)
Average MVPA minutes per day based on Actigraph accelerometer recordings
Proximity: Both objective (GIS
-1 and 2 miles from home) and
perceived distance to closest
park
Non-significant;
In all models, the number of resources in the buffer was inversely related to MVPA, against the expectation that a greater number of
facilities would be associated with more activity;
There was no association between distance to
resources identified through qualitative interviews and MVPA minutes, adjusting for age and BMI
(standardized parameter estimate for GIS network distance = 0.06, P = .45)
Ecological Kim, J. (Kim, Lee, & Lee,
2016 Korea; 204,324 adults from the 2012 Korean MVPA from International Physical Activity Questionnaire Community built environment, including areas of open space for PA, number of PA
11
2016) Community
Health Survey (KCHS)
(IPAQ) facilities and amount of PA equipment, was linked with information from the 2012 KCHS based on residential location: counties, cities or districts. Areas of open space for PA included sports grounds, waterfront parks, village vacant lots, trails and parks.
95% CI 0.52-0.94) were less likely to engage in MVPA than residents in counties. While residents in communities with the least amount of physical equipment were less likely to participate in MVPA (OR = 0.72, 95% CI 0.57-0.90), residents in communities with the second smallest area of open space for PA were more likely to be active (OR = 1.37, 95% CI 1.07-1.77). The effect of built environment on MVPA was significant but relatively weak in
comparison to the influence of individual correlates.
Cross-sectional (baseline data used from WOMAN) King et al.(W. C. King et al., 2005) 2005 Pennsylvania; Overweight Caucasian and African -American postmenopaus al women, average age 57 years (n = 158)
Average number of steps per day based on Yamax DigiWalker pedometer
Proximity: A park within “walking distance of home”
(measured by GIS)
“Walking distance” = 1500m
Non-significant; d living within walking distance (1500 m) of specific types of businesses and facilities were positively associated with individuals’ physical activity level measured by pedometer (p < 0.05), parks was not specifically associated with mean steps per day (p = 0.9200)
Cross-sectional Mc Conville, Master’s
2009 Montgomery County;
Adults, average
Walking for transport for less than 150 min/week
Density: number of parks
within¼mile and½mile
12
paper age 50
years (n = 251) or 150 min/week versus not walking for
transport, based on Actigraph
accelerometer recordings
buffer;
Proximity: miles to nearest park Cohort Michael YL(Micha el, Perdue, Orwoll, Stefanick , & Marshall, 2010)
2010 Portland, OR;
5995 community-dwelling men ≥
65 years from the Osteoporotic Fractures in Men Study (MrOS) Participants reported time walked per day at baseline (2000– 2002) and follow-up.
Distance to a walking or hiking trail that was not part of a park was quantified in Cartesian measurements (straight-line), and distance to a park was quantified in network distance (distance needed to travel to reach the park destination); grouped park and trail distances into one eighth, one quarter, and one half mile categories; only one eighth and one quarter mile distances were used for parks
Proximity to parks and proximity to trails, respectively, were associated with a 22% (95% confidence interval [CI] = 1.01, 1.47) and 34% (95% CI = 1.16, 1.55) higher likelihood of maintaining or
increasing walking time in high-SES neighborhoods, but there was no
association in low-SES neighborhoods.
Cross-sectional Saelens, BE. (Saelens et al., 2012)
2012 Seattle and
Baltimore;
Adults age 20-64 (n=2121)
Average minutes of MVPA
(accelerometer recordings)
Self-report perception of neighborhood environment from Neighborhood Environment Walkability Survey (NEWS) Non-significant ;
Higher residential density, retail FAR, land use mix, and number of proximal private recreation facilities and parks
were significantly related to MVPA, with higher
intersection
13
MVPA ; park proximity metrics were unrelated to overall physical activity and walking
Cross-
sectional Sallis, J.(J. F. Sallis et al., 1990)
1990 San Diego, CA;
(n=2,053) 7-page questionnaire ; Classified into ‘sedentary’ and ‘exercisers’
Proximity of facilities to subjects by calculating the actual
density of facilities within varying distances(1km and 2km) of subjects' homes
Positive association; Density of total facilities within 1km between sedentary and exerciser groups (P <0.05). At all distances (1-5km), density of pay exercise facilities significantly associated with exercise habits (P < 0.05 to P < 0.01).
Cohort Salvo, D.(Salvo et al., 2014)
2014 Cuernavaca, Mexico; 677 adults Participants wore Actigraph GT3X accelerometers for 7 days Geographic information systems
(GIS) to generate 500-m- and 1-k500-m-buffer– based measures of net residential density, proportion of commercial land use, land-use mix, connectivity, walkability, and number of parks and transit routes ; obtained data on distance to the nearest park with GIS
Non-significant;
participants who had 1 park intersecting the 500-m buffer engaged in 27.9 (14.9) fewer minutes per week of total MVPA (p= .05) and 16.8 (8.2) fewer minutes of MVPA within bouts ( p = .03)
than participants with no parks intersecting the 500-m buffer; no significant association for participants with 2 or more intersecting parks for total MVPA or MVPA within bouts (using 0 parks as reference), and no significant linear trends were found for this relationship.
14
sectional al.(Strath et al., 2012)
Older adults, mean age 64.3 (n = 148)
MVPA, based on Actigraph accelerometer recordings
Number of
parks within 200 m of home,
based on audit Objective proximity: at least 1
park within 200 m of home
Perceived environment also
recorded
Overall, recreational facilities (parks) were not significantly associated with total volume of PA (p = 0.114), light intensity PA (p =0.174), or moderate to vigorous PA (p = 0.925); count of facilities within 200m of home were not significantly associated with overall, light, and moderate to vigorous PA (p-values > 0.05) Cohort Van Cauwenb erg, J.(Van Cauwenb erg et al., 2015) 2015 Australia; 2700 Adults ranging from 57-67 years Self-reported data on demographics, functional limitations, recreational walking and other recreational moderate- to vigorous-intensity physical activity (MVPA)
Self-reported on park proximity and park quality; objective information on area of residence was collected
15 Cross-sectional , ecological Ying, Z.(Ying, Ning, & Xin, 2015) 2015 Shanghai, China; Residents aged 46 to 80 (n= 1100)
Total steps of walking were measured as a physical activity level ,total physical activity level in April–October 2010 was measured objectively with the Omron HJ-720ITC Pedometer (OMRON Inc., China)
Land-use mix, net residential density, street connectivity,
environment variables such as proximity of river, parkland, and square ; utilized a 500m network buffer size around a household
Parkland and square proximity have a significant relationship with physical activity (P = .0270, .0010), BMI (P = .0260, .0130), and overweight/obesity (P = .0020, .0470). Land-use mix was positively associated with physical activity (P < .01) and inversely associated with BMI (P = .0240) and
overweight/obesity (P = .0440). Green and open spaces were positively related with BMI (P < .01) and health status (P < .01).
CHAPTER 2
LITERATURE REVIEW
2.1 Obesity and South Carolina
South Carolina has the 10th highest adult obesity rate in the United States
(Foundation, 2015a). Adults aged 26-64 have over a one-third chance of being
obese (Foundation, 2015a). Physical inactivity is the not the only determinant of
obesity, but does contribute to it. Low levels of physical activity are a determinant
for various ailments other than obesity such as cancer and heart disease. It’s
projected that both cancer and heart disease cases will increase two and
three-fold respectively by 2030 (Foundation, 2015a).
Disparities in health mediated by race and socioeconomic status exist.
The highest obesity rates in South Carolina are seen among the black
population, who compose 27.8% of the total population in South Carolina
(Bureau, 2014; Foundation, 2015a). In comparison to the adult average in the
nation, individuals identifying as ‘Black’ have a 7% higher rate of being
overweight or obese(Centers for Disease Control and Prevention, 2014a).
Societal status also plays a role in disease risk factors. It has also been shown
that the individuals with lower income and educational status are associated with
increased likelihood of obesity (Foundation, 2011).
Obesity itself is manifested in the fundamental mechanism of energy
role in this process(Trayhurn, 2005). From when food, the energy source, enters
the body the manipulation and breakdown differs intrinsically by individual. When
excessive energy intake occurs the white adipose tissue can accumulate as fatty
stores and put extra stress on functioning organs.
When an individual is obese they are at an increased risk of heart disease,
stroke diabetes, cancer, and a number of other life-altering ailments(National
Heart, 2013; Panel, 1998). A number of long-term longitudinal studies have
shown obesity to independently predict coronary atherosclerosis (Garrison &
Castelli, 1985; J. E. Manson et al., 1995; Rabkin, Mathewson, & Hsu, 1977).
Changes that occur in lipid profiles from weight gain influence the functionality of
organs, specifically the heart. Overweight and obese individuals have a much
higher risk of morbidity and mortality from cardiovascular disease and a reduced
life expectancy (JoAnn E Manson et al., 1990; Poirier et al., 2006). Therefore, it
is crucial that measures are taken to reduce obesity in the U.S in order to
alleviate burden on the heart and its function.
The biologic mechanism by which obesity works has been shown to
increase the risk of cancer in individuals. With a variety of cancers, it’s
unfathomable that one pathway would exist for excessive weight to work through.
Three developed hypotheses link obesity and cancer; insulin and insulin-like
growth factors, sex hormones, and adipokines (Roberts, Dive, & Renehan,
2010). In one example, insulin production and utilization can be at the forefront in
causing cancer. Insulin and insulin-like growth factors (IGFs) can be indicative of
breakdown and promoting IGFs to inhibit binding, creating more opportunity for
tumor development (Roberts et al., 2010).Obesity is tightly linked to increased
risk of cancer in the esophagus, pancreas, colon and rectum, breast (after
menopause), endometrium (lining of uterus), kidney, thyroid, and
gallbladder(Institute, 2012). These cancer diagnoses can inhibit the already
deteriorating quality of life that an overweight or obese individual experiences.
Emerging literature has shown that psychological illnesses are influenced
by obesity. Excessive amounts of weight gain have shown to have effects on
clinical depression, anxiety and other mental illnesses (Kasen, Cohen, Chen, &
Must, 2007; Luppino, de Wit, Bouvy, & et al., 2010). Despite all the negative
consequences of obesity, the NIH reported in 1998 it was the second leading
cause of preventable death in the U.S.(Panel, 1998). However, the gap is closing
and may have surpassed the number one spot of tobacco use(Hennekens &
Andreotti, 2013).
2.2 Physical Activity
Physical activity (PA) is any body movement that works your muscles and
requires more energy than rest (National Institutes of Health : National Heart,
2012).There are four main types of PA including; aerobic, muscle-strengthening,
bone-strengthening, and stretching (National Institutes of Health : National Heart,
2012). Adding these types of activities through sport, leisure, and training can
Current CDC recommendations stipulate that 150 minutes of aerobic
activity and muscle-strengthening activities on two days of the week are sufficient
for important health benefits in adults(Centers for Disease Control and
Prevention). However, this has not always been the standard for PA
recommendations for adults. The American College of Sports Medicine (ACSM)
has long been the front-runner in producing reports to the public on health
exercising recommendations. Evolution of the PA recommendations from the
ACSM has been previously summarized from a paper by Blair et. Al. in 2004 and
displayed as Table 2.1 below (Blair, LaMonte, & Nichaman, 2004). This
recommendation has not significantly wavered since 2004 by ACSM. Increasing
the physical activity duration has been shown to have favorable health effects.
Considering this, it has been shown in several studies that including consistent
PA in lifestyle can reduce your risk of coronary heart disease (CHD), diabetes
and cancer (S. S. Cohen et al., 2013; Eheman et al., 2012; Geffken et al., 2001;
Gill & Cooper, 2012; National Institutes of Health : National Heart, 2012; Nocon
et al., 2008; Warburton, Nicol, & Bredin, 2006; Winzer, Whiteman, Reeves, &
Paratz, 2011).
Overall there is much knowledge to surround the claim that physical
activity has a linear relationship with improvements in health status(Warburton et
al., 2006). Improved physical activity can therefore be a driving force in healthy
2.3 Built Environment Influence on Physical Activity
The area surrounding a person can have an altered effect on the way in
which a person lives. Neighborhoods can provide an avenue for activity to take
place such as walking, hiking, running or biking.
The built environment can be divided into five interrelated dimensions;
density and intensity of development, mix of land uses, connectivity of street
network, scale of streets, and aesthetic qualities of a place (Handy et al.). Much
of this information comes from varying entities at the county and city level.
Not only is the physical existence of these entities important, but the
access to physical activity locations is also important. Numerous studies have
showed that access to physical activity locations can have an influence on
patterns and frequency of physical activity in adults (Brownson RC, 1998; Hovell
MF, 1992; H. M. Sallis JF, Hofstetter CR, 1992; H. M. Sallis JF, Hofstetter CR,
Faucher P, Elder JP, Blanchard J, Caspersen CJ, Powell KE, Christenson GM,
1989). More specifically, thedensity of facilities around the home has been
associated with an increase/decrease of physical activity(J. F. Sallis et al.,
1990). The importance of defining what a facility of exercise looks like and the
perceived impression it gives to physical activity opportunities still needs to be
further studied.
However, many studies have failed to identify the direct correlation
Campo, Michael, & Mahmood, 2016; J. F. Sallis et al., 1990). These null findings
could be due to any number of issues surrounding study design, sample size, or
measurement biases. Study designs such as the case-control study are unable
to assess built environment influence prior to physical activity outcomes. Sample
sizes in these studies may also be a problem to finding a significant result. If not
enough participants are analyzed then the study can be underpowered. Certain
biases can also be apparent in studies that show no correlation. Respondent bias
of a subjective measure of physical activity being used causes influence of social
desirability. Responses can differ by age, gender, SES, and numerous other
factors. Understanding the association between the built environment and human
behavior can help to encourage models in which people will be physically
active(Handy et al.). In this way, acceptable models can be factored into
urban/rural planning for the future. Table 1.1 provides the inconclusive nature of
the literature that exists and the need for further research.
2.4 Distances to PA Opportunities; Neighborhoods
Neighborhood analyses of the built environment have become
increasingly important in city/town planning in recent years. Access to and
available opportunities of physical activity contribute to these various
environments. In the past, frequency and density of certain attributes in an
environment have been useful tools in capturing the accessibility of the indicated
attribute(Van Meter et al., 2011). Nevertheless, the computation of what
One study of adolescents has identified that an easy walking distance is
15 minutes at about 3 miles per hour. This walking pace correlates to about 0.75
miles which has been used to measure a feasible distance to constitute a
neighborhood in multiple investigations (Colabianchi et al., 2014; Colabianchi et
al., 2007). Defining of neighborhoods and what constitutes proximal influence on
physical activity behavioral patterns needs more research. No known “gold”
standard for neighborhood influence has been validated and used regularly in
these types of studies.
2.5 Self-report vs. Objective Measures
Self-report measures have been an easy avenue to acquire data in
epidemiologic studies. The problem that arises is the validity of the self-report
and whether more objective measurements are available. A review of
internationally-conducted studies of adults found no clear trend in the association
between these two ways to assess physical activity. Self-report was
overestimated and underestimated in comparison with its objective
measurement, yielding discrepancy of using self-report as a good measure of
actual PA in a number of analyses (Celis-Morales et al., 2012; Prince et al.,
2008; James F Sallis & Saelens, 2000). Some causes of this could be the types
of self-report and objective measures used for the study and study design.
Retrospective methods may be more difficult to ascertain an accurate account of
PA as well as self-report may not be able to indicate smaller amounts of physical
exercises or leisure activities have shown to be more difficult to account for in
comparison to high-intensity PA for adults, resulting in misreport (James F Sallis
& Saelens, 2000). This could be because of the tendency to misclassify intensity
when self-reporting, often times overestimating the effort going into the physical
activity (Duncan, Sydeman, Perri, Limacher, & Martin, 2001; Fan, Wen, &
Kowaleski-Jones, 2014). The balance between ease of use and accuracy can be
the central dilemma when deciding which type of measure to utilize. Both
subjective and objective measures can be information but to what extent
depends on context.
2.6 Biomarkers
Objective measures of physical activity are abundant with accelerometers,
activity trackers, gym logs and many others. Unfortunately these objective
measurement devices are not necessarily feasible for many studies and/or create
an added burden to the participant. Although, clinics can take anthropometric
measurements, this has no bearing on the measure capturing infrequent or
consistent physical fitness. Blood samples that are analyzed via biomarkers are a
way in which to assess the implications of inflammation and ultimately risk for
CVD and other diseases(Ridker, 2007).
C-Reactive protein (CRP) is a widely accepted biomarker for the presence
of chronic inflammation. Inflammation can be an indication of lower levels of
physical activity and its related health outcomes. Chronic low-grade inflammation
diabetes(Trayhurn, 2005). Normal ranges for CRP in adults are between 5 and
10 mg/L Studies analyzing physical activity and body weight have shown
significant associations with CRP (mg/dL) (Abramson & Vaccarino, 2002;
Geffken et al., 2001; Mora, Lee, Buring, & Ridker, 2006; Visser, Bouter,
McQuillan, Wener, & Harris, 1999). It has been seen that as physical activity
increases in a person’s physical fitness, thereby inducing weight loss and
reducing CRP and IL-6 levels(Adams et al., 2015; Trayhurn, 2005).
Interleukin-6 (IL-6) also works with CRP in the inflammation mechanism.
Interleukins such as IL-6 stimulate the production of CRP (Erlinger, Platz, Rifai, &
Helzlsouer, 2004). Because of this joint effect in the pathology of inflammation,
the most complete information on chronic conditions can be echoed by analysis
of each biomarker.
2.7 Armband Data and PA
As previously discussed, objective measures can provide unbiased results
from participants in a study. One form of objective measurement, physical activity
trackers that track participant physical activity behavior can provide insight into
their energy expenditure, amount of light/moderate activity among other related
factors.
It is well documented that Sensewear® armbands are validated for
measuring physical activity in the form of energy expenditure (Reece, Barry,
Fuller, & Caputo, 2015; Welk, McClain, Eisenmann, & Wickel, 2007).
non-compliance with wear of this device is minimal(McNamara et al., 2016). In order
for this device to provide reliable measures it has been recommended that at
least 3 weekdays be utilized to provide reliable measures of energy expenditure,
inactivity, light, moderate and total physical activity(Scheers, Philippaerts, &
Lefevre, 2012). Previous studies have found the armbands to be useful in
accurately and easily assessing movement for intervention studies (Almeida,
Wasko, Jeong, Moore, & Piva, 2011; Barone Gibbs et al., 2016). The continuous
wear of this device has also been shown to encourage and weight loss through
increased activity and lifestyle change (Shuger et al., 2011).
2.8 Potential Confounders/Effect Modifiers Education Level
Education and affluence have shown to have influence on physical activity
behaviors. A number of studies have seen that with lower educational attainment
there is an association with lower physical activity and higher incidence of obesity
thereafter (Foundation, 2011; A. C. King et al., 2000). Additionally, of those in the
lowest education and income categories only 10-14% met the PA guidelines,
whereas the highest educated were 21-28% (S. S. Cohen et al., 2013). In
contrast, one study observed that those with higher affluence and education were
also among those who were living sedentary lifestyles active, potentially due to
the specific population of Czech adults (Sigmundova et al., 2015). Conversely,
the same study just described and another from an American population found
physically active over time (Shaw & Spokane, 2008; Sigmundova et al., 2015).
Seemingly, education plays a role on physical activity; however the exact
relationship seems to be uncertain from the literature and could be differentiated
by additional population characteristics.
Socioeconomic Status (SES)
Socioeconomic status plays a crucial role in physical activity behaviors
and associated health outcomes. It is already well established that health is
affected by both socioeconomic status and physical activity(Mackenbach et al.,
2008). SES is highly is highly associated with one’s residential choices, which
correlates with neighborhood crime levels, availability of recreational facilities,
and other features of the built environment. In fact, one such study found that
low-socioeconomic individuals were less likely to meet the CDC-ACSM
recommendations for PA and were less satisfied with neighborhoods, crime,
untrustworthy neighbors, among other reported factors(Wilson DK, 2004).
Additionally, Wilson et al. measured availability of resources for exercise
objectively in a rural, largely African American, Southeastern US population, and
found it was the same across socioeconomic levels; conversely, perceptions of
these available opportunities differed (Wilson DK, 2004). However,
measurements and perceptions of PA opportunities may not be the same in other
populations.
Another barrier to physical activity can be job status (a component of
leisure-time physical activity. As job responsibility increases leisure-time physical
activity declines (Fransson et al., 2012). Even among those who had
physically-demanding jobs, a dose-response association could be seen when high-intensity
PA in leisure-time reported indicated better working ability. Low and
moderate-intensity PA during leisure-time failed to show this benefit among workers
(Calatayud, Jakobsen, Sundstrup, Casaña, & Andersen, 2015). Among low-wage
workers, the importance of PA promotion in the work environment encouraged
healthy exercise habits (Nobrega et al., 2016; Strickland et al., 2015). Although
the availability of resources for physical activity is numerous, time to be able to
devote to outside activities or work environment might detract from being able to
utilize those resources. For men it was found that high SES men did more
leisure-time PA and low SES men completed more job-related and household
PA; contrary women of high SES were more active in all PA activities
(leisure-time, job-related, and household) than low SES women (Ford et al., 1991).
Availability of physical activity opportunities may not be the only barrier to
exercise. Varying cultures within social classes may influence perception of
opportunities. One study in Australia aimed to analyze the psychosocial aspect of
cultures with PA choices and found the gradient it follows can be key to
understanding the barriers of social class(Ball, Carver, Downing, Jackson, &
O'Rourke, 2015). Directing policies to make neighborhoods with more ‘walkable’,
increase available recreational facilities and improved crime rates could be
crime rates and available recreational facilities were identified as part of key
values of PA perceived culturally by each group of individuals (Ball et al., 2015).
Age
As a person ages, the possibility of negative health outcomes also
increases. Physical activity can help reverse this trend, which is inversely related
to age(James F Sallis, 2000; U.S. Department of Health and Human Services,
1996).Despite the health benefits of physical activity, about two thirds of adults
still remain underactive(Stewart et al., 2001). Also, it has been reported by the
CDC from BRFSS data that only between 28-34% of adults ages 65-74 are
physically active(U. D. o. Health & Services, 2004). Some evidence has shown
trends of declining vigorous physical activity as a person ages and an inclining
slope of moderate intensity PA (James F Sallis, 2000). Increasing age has shown
to correlate with the decline in strengthening and stretching(Caspersen, Pereira,
& Curran, 2000). In this way, physical activity can be a burden to sustain as
functionality decreases. Also, physical inactivity can exacerbate the already
known decline in physical function due to age (Villareal, Apovian, Kushner, &
Klein, 2005). The U.S. reported in 2012 having more than doubled the
percentage of children as overweight or obese, which translated into the
Gender
Despite physical activity recommendations for men and women being the
same, the ways and barriers to obtaining these goals are quite different. A study
utilizing the 1992 National Health Interview Survey found that adult females were
more physically inactive than their male counterparts(Azevedo et al.; Caspersen
et al., 2000). Often women play a different role in the structure of a family which
could contribute to time available to exercise freely. However, the role of the
woman in the household could keep the decline of physical activity at a slower
rate as seen in a review of human and animal aging(James F Sallis, 2000). Men
have been found to participate in more moderate-intensity, vigorous-intensity and
total leisure-time physical activity practice(Azevedo et al.). In this way gender
norms could compromise the true effects of built environment (e.g., availability of
Table 2.1 – American College of Sports Medicine Recommendations of Adult Physical Activity over Time, 1975-2000.
CHAPTER 3
RESEARCH METHODS
3.1 Participants and Setting
Study Population
Data was pulled from both the HEALS and SISTAS study interventions.
Both HEALS and SISTAS are comprised of overweight/obese (as classified by
the BMI scale) African-Americans who resided in the state of South Carolina,
primarily in but not exclusive of Lexington, Richland, Darlington, and Florence
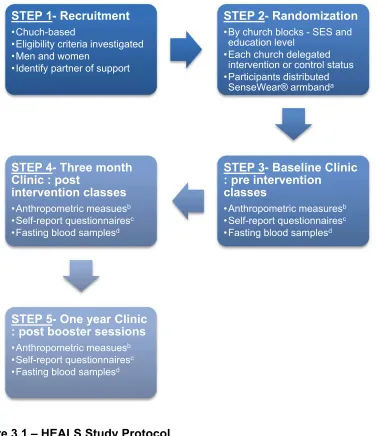
counties. Figure 3.1 below depicts the study protocol for the HEALS study.
Additionally, Figure 3.2 depicts the study protocol for the SISTAS study. For
analysis purposes, only ‘Step 3’ was utilized in this study analysis before
interventions began.
The SISTAS and HEALS studies obtained BMI calculations from the
baseline, first clinic visit after randomization, in which no intervention had been
administered. Participant demographics and subjective physical activity levels will
be obtained via the validated Rapid Assessment of Physical Activity(RAPA)
questionnaire(Topolski et al., 2006) at baseline. The questionnaire was originally
developed by Dillman(Dillman, 2000; Jenkins & Dillman, 1995) and has been
determined to be a validated measure of physical activity in clinical practice for
(PACE) (Topolski et al., 2006). Blood samples and anthropometric measures
were also taken on the date of the baseline clinic.
Clinics (baseline, 3- , and 12-months) were the contacts of study
participants for each clinical trial. The baseline clinic was conducted before
randomization into intervention or control groups in both studies. Phone calls to
study participants were made to schedule time slots for attendance at clinics.
Each clinic was inclusive of questionnaire data (self-report mailed before
attendance) and anthropometric measures (e.g., height, weight, BMI, blood
samples, etc.). Specifically in HEALS, objective physical activity and energy
expenditure monitoring ( via SenseWear® armband) were collected. For the
SISTAS study, instruction for after clinic recall (24 hour recall for diet and
physical activity) was also received at clinic visits. Trained professionals in
phlebotomy conducted blood draws and trained study assistants measured
waist-to-hip and height dimensions to the nearest centimeter.
The HEALS and SISTAS studies obtained BMI calculations from clinic
visits via the bioelectrical impedance assessment using the Tanita TBF-300WA
Body Composition Analyzer (Adams et al., 2015; Hébert et al., 2013). This
BMI calculation was an inclusion criteria for both studies as only those with a BMI
of ≥25 kg/m2 (the cut point for overweight/obese classification outlines by the
World Health Organization) were allowed to participate. Blood samples were
taken to analyze for inflammatory or glycemic control markers. Plasma was
aliquot from blood samples and stored until analyzation. C-reactive protein (CRP)
immunosorbent assay kit was used to measure plasma cytokine levels
(Quantikine kits) for CRP and IL-6 (Hébert et al., 2013). Specific details for this
are outlined in a previous paper by Hebert et al in 2013. Since multiple timepoints
were collected, a study ID was assigned and utilized for identification for all
samples collected. Those running the blood samples were blinded to which study
IDs indicated intervention or delay intervention participants.
Armband data for HEALS participants was collected via Sensewear®
software. Calibrations for each participant was done by age, date of birth, height
and weight, current smoking habits, and dominant hand (Hébert et al., 2013).
Only those who had ≥4 days of the possible 7-day request of usage were
included in analysis.
Recreational green spaces were assessed from a comprehensive map
collected from contributions of county, state, and city parks in the Columbia, SC
and Florence, SC areas, in which participants resided. Park data was obtained
from separate entities and merged together in one data layer. openstreetmap.org
(the ‘leisure and sport’ layer), ArcGIS online (National forests, state parks,
national parks), Columbia parks from City of Columbia GIS division, Florence
parks from the City of Florence GIS division, SC Forestry Commission and SC
Department of Parks, Recreation, and Tourism. Those green spaces that are
identified as points will be transformed into polygons for analysis utilizing their
given acreage in a calculation of a radii for their area (Columbia parks) or
assigning an average land coverage for all parks without acreage given
miles in radius) surrounding participant geocoded addresses indicated the
accessible environment for physical activity.
3.2 Study Design
This thesis project will utilize a retrospective, cross-sectional analysis from
two community-based interventions. The diet and physical activity interventions
of HEALS (Health Eating and Active Living in the Spirit) and SISTAS (Sistas
Inspiring Sistas Through Activity and Support) was combined to create a group of
participants with similar baseline characteristics (race, BMI, age range, etc.) and
analogous intervention components (i.e., culturally-tailored classes). The details
of the HEALS study have been previously outlined (Hébert et al., 2013). The
SISTAS study, adapted from the same methodology as HEALS differs only in
gender composition of participants and recruitment locations. SISTAS
incorporates only women and did not rely upon churches as an avenue for
obtaining potential participants or disseminating the intervention protocol.
The lifestyle intervention studies were comprised of 12-week classes
tailored to overweight/obese African-American participants and their concerning
barriers to lifestyle change within this demographic. Obese individuals were
sought to be recruited in light of the potential implications in behavioral
modification of this population for improved health.
Simple means and frequency procedures were run in order to describe the
characteristics of the study population via gender distribution, BMI, employment
defined by available designated parks and recreational opportunities (those
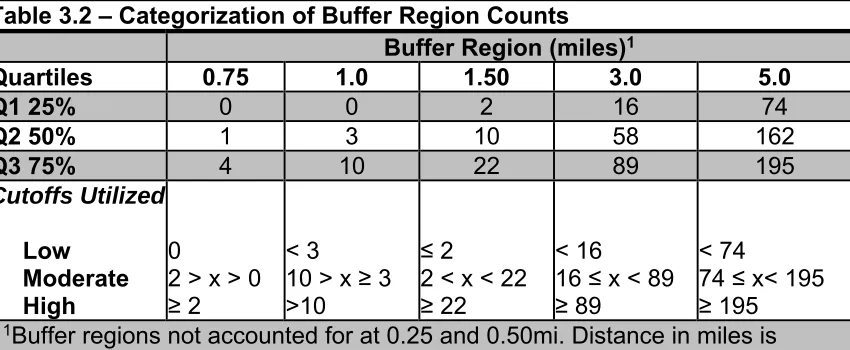
within their buffer region), were analyzed through ArcGIS. Buffer regions of 0.25,
0.50, 0.75, 1.0, 1.5, 3.0, and 5.0 mile radii around participant’s addresses were
utilized for analysis. Multivariate regressions will be run with counts of
recreational green spaces (among all buffer regions specified above) being the
dependent variable in correlation to their subjective self-report physical activity
and objective physical activity taken from IL-6 and CRP values indicating
inflammation. An additional objective physical activity assessment for select
HEALS participants was derived from armband data via energy expenditure
extracted.
Original study protocols (SISTAS and HEALS) both received USC
Institutional Review Board (IRB) approval. Current study analysis of these
combined datasets is covered under original review.
3.3 Sample Size
Overweight/obese individuals will be utilized from the HEALS and SISTAS
intervention studies and their addresses will be geocoded. Only those
participants who completed the baseline clinic will be utilized as well as having all
values completed for the identified confounding variables. For the full study
analysis, SISTAS contributed 250 persons, while HEALS contributed 208, for a
combined total of 458 persons included for Aims 1-3 after exclusionary criteria
are met.
3.4 RAPA Questionnaire
The Rapid Assessment of Physical Activity instrument was developed
from the Centers for Disease Control and Prevention guidelines for physical
activity (i.e., 30 minutes or more of moderate physical activity on every day or
most days of the week). It is a nine-item questionnaire based on yes or no
questions to levels of physical activity ranging from sedentary to regularly
vigorous. Strength training and flexibility is also assessed within this tool and
given a score (Topolski et al., 2006).
3.5 Sensewear® Armband
Sensewear® armbands were provided to the participants in the HEALS
intervention study. Energy expenditure, intensity of physical activity, and bouts of
physical activity were monitored with this device. Measures of participant age,
date of birth, height and weight, current smoking habits, and dominant hand were
utilized for calibration via software provided by Sensewear®. Participants were
asked to wear the armbands for 7 days while they were awake as well as report
their hours of sleeping separately for calculation. Only those with ≥ 4 days of data
were included. A day of use was determined by wearing the device and
3.6 Data Analysis
Baseline characteristic analyses were completed by means and frequency
procedures to understand the make-up of the study population. Assessment
between the excluded participants and those in the full study were done with
paired t-tests and chi-squared analysis to determine if statistical difference
occurred (p < 0.05).
To assess if the amount of physical activity reported is related to the
availability of parks in the neighborhood of the participants, a full model utilized a
multinomial regression analysis when the outcome variable was continuous.
Continuous outcomes assessed were inflammatory biomarkers and energy
expenditure. Logistic regressions were used when the outcome variable was
categorized or dichotomized. Individual univariable analyses were run for each
independent variable and outcome. Independent variables assessed as
continuous were age, BMI, and counts of recreational green spaces (parks) at
0.25, 0.50, 0.75, 1.0, 1.5, 3.0, and 5.0 mile from the participant’s home.
Categorical independent variables consisted of education, SES status
(determined by employment status), gender, ‘High’/’Low’ CRP, ‘High’/ ‘Low’ IL-6,
and ‘High’/’Moderate’/’Low’ counts of parks. Buffer regions were defined with
0.25, 0.50, 0.75, 1.0, 1.50, 3.0 and 5.0 mile radius around each participant
geocoded address based on self-reported data. The initial 0.75mi radius was
determined from previous research on this topic, assessing a 15-minute walk
around a residence which can be defined as a neighborhood (Pate et al., 2008).
the study population may utilize for physical activity as well as conversely the
places in which someone might drive. The addresses of the participants were
obtained from self-report measures and geocoded in ArcGIS. Recreational space
(parks) locations were acquired via government and publicly available entities in
both point addresses and polygon data. Park addresses given as points were
converted to polygons for analysis by 1) using acreage to construct a proper
radius around the specified location or 2) utilizing ArcGIS to estimate average
radii for all parks in that layer.
Self-reported RAPA scores assessed activity level for HEALS participants
only as data was not available for the combined SISTAS and HEALS cohort.
Comparisons of engaging in recommended amounts of physical activity and
participating in more than the recommended amount of physical activity in
reference to sedentary behavior was determined. The third aim addresses the
amount of parks around a participants’ residency to objective measures of
physical activity. Clinical biomarkers for inflammation, IL-6 and CRP, are
analyzed separately among all participants of SISTAS and HEALS combined.
Another objectively measured physical activity outcome for HEALS participants
(only) was 7-day, Sensewear® armband data. Overall energy expenditure was
utilized from calculated values of awake and reported sleep activity.
In all circumstances an alpha level of 0.05 was utilized. Exclusion criteria
for ArcGIS included residences that were reported invalid or as PO Boxes. The
full amount of geocoded addresses of participants utilizing ArcGIS was n = 507.
the anthropometric and self-report measurements from the baseline clinic and
included in the multivariate analysis excluded an additional 49 participants. Each
intervention study contributed 250 and 208 participants from SISTAS and HEALS
respectively, for a final study population of 458 participants. All data analyses
were run on SAS 9.4 and/or with ArcGIS 10.2.2.
3.7 Variables
Aim 1 Outcome of Interest: Study population unique characteristics of combined
cohort and distribution of population into relevant study measures
Frequency and means were calculated to explore the relationships
between the built environment and the study participant characteristics (e.g., age,
gender, height, weight, employment status, etc.). Frequency distributions for
gender, education level, employment status, IL-6, and CRP were calculated and
displayed. Means and standard deviations for continuous variables such as BMI,
weight, height, age, fat percent, IL-6, CRP, parks in each buffer region (additive),
and parks in each buffer region (non-additive) are also presented.
Aim 2 Outcome of Interest: PA of intervention participants
PA will be measured subjectively via self-report questionnaire (RAPA) for
HEALS participants only. Pre-defined categories for the RAPA self-report
questionnaire were analyzed on a scale of 0=’sedentary’ to 2=’over
‘Sedentary’, ‘Meeting Recommended Physical Activity’, and ‘Over
Recommended Physical Activity’. (Topolski et al., 2006).
Aim 2 Main Exposure: Amount of recreational green space
Counts of this exposure will be determined from the geocoded addresses
of participants and the recreational green space coordinates (parks & designated
areas of recreational opportunity). Buffer regions will be analyzed on a 0.25,
0.50, 0.75, 1.0, 1.5 mile radii around the participant address. Defined categorical
counts of low, moderate, and high will be based on amount of recreational
opportunity (counts of defined parks) within the defined radius. Methodology for
categorical counts was determined separately for each buffer region. Interquartile
ranges were utilized to define cutoff points for ‘Low’, ‘Moderate’, and ‘High’
definition (see Table 3.1). Table 3.2 designates the distribution of counts for each
categorized region.
Aim 3 Outcome of Interest: PA of intervention participants
PA will be measured objectively. It will be measured via biomarkers of
CRP and IL-6 from blood samples. This measurement will be a continuous
variable with units of mg/L for CRP and pg/mL for IL-6. Analysis will further be
run treating CRP and IL-6 as dichotomous outcomes. CRP will be dichotomized
as high ( ≥3.0mg/L) and low (<3.0 mg/L) based on the risk assessment of
cardiovascular disease by the CDC and AHA(Pearson, Mensah, Hong, & Smith,
pg/mL) that utilizes the CRP distribution of the participants, as has been done in
previous methodology(Cho, Kivimaki, Bower, & Irwin, 2013). Table 3.1 illustrates
the dichotomized cutoff points. The median values of IL-6 in the ‘high’ and ‘low’
defined groups of CRP was used to find the appropriate IL-6 cutoff. An
approximate of the average of the two medians was used as the cutoff point for
IL-6 values.
An additional analysis of objective measurement of PA will be 7-day
armband data done for HEALS participants only. Armband data, providing energy
expenditure in kilocalories, will be run as a continuous variable in comparison to
park counts (continuous and categorical).
Aim 3 Main Exposure: Amount of recreational green space
Counts of this exposure will be determined from the geocoded addresses
of participants and the recreational green space coordinates (parks & designated
areas of recreational opportunity). Buffer regions will be analyzed on a 0.25,
0.50, 0.75, 1.0, 1.5 mile radii around the participant address. Defined categorical
counts of low, moderate, and high will be based on amount of recreational
opportunity (counts of defined parks) within the defined radius. Methodology for
categorical counts was determined separately for each buffer region. Interquartile
ranges were utilized to help define cutoff points for ‘Low’, ‘Moderate’, and ‘High’
definition (see Table 3.2). Table 3.3 designates the distribution of counts for each
categorized region.
3.8 Potential Confounders and Effect Modifiers
Confounders and effect modifiers, because of the imperfect design of this
analysis may exist and have influence on the results. In an effort to reduce the
manipulation of these variables the incorporation of their effect will be taken into
account but is not exhaustive of all the possible influences. These are the
potential confounders and effect modifiers used in this thesis:
Age: This will be analyzed as a continuous variable with participants
ranging from 29-87 years.
Education level: Education will be a categorical variable divided into the
following categories: ‘8th grade or less’, ‘more than 8th grade and less than
high school’, ‘high school completed, no college’, ‘high school completed,
some college’, ‘college completed’, and ‘more than college completed’.
The highest education level of the participant will be used. The reference
level that will be utilized for analysis is ‘more than college completed’.
Socioeconomic Status (SES): Socioeconomic status will be based on
self-report at baseline. Those with ‘full-time’, ‘part-time’, ‘retired’, and
‘unemployed’ job status will make up the categorical variable of SES. The
reference level that will be utilized for analysis is ‘unemployed’.
Gender: Males and females will be indicated and factored into multivariate