A Fast Deterministic Kmeans Initialization
Omar Kettani
Scientific Institute, Physics of the Earth Laboratory Mohamed V- University
Rabat, Morocco
Faical Ramdani
Scientific Institute, Physics of the Earth Laboratory Mohamed V- University
Rabat, Morocco
ABSTRACT
The k-means algorithm remains one of the most widely used clustering methods, in spite of its sensitivity to the initial settings. This paper explores a simple, computationally low, deterministic method which provides k-means with initial seeds to cluster a given data set. It is simply based on computing the means of k samples with equal parts taken from the given data set. We test and compare this method to the related well know kkz initialization algorithm for k-means, using both simulated and real data, and find it to be more efficient in many cases.
General Terms
Data Mining,Clustering.
Keywords
k-means initialization, kkz.
1.
INTRODUCTION
Clustering is a basic task in many fields, such as artificial intelligence, machine learning and data mining. Clustering consists of grouping a given dataset into a predefined number of disjoint sets, called clusters, so that the elements in the same cluster are more similar to each other and more different from the elements in the other cluster. This optimization problem is known to be NP-hard, even when the clustering process deals with only two clusters [1]. Therefore, many heuristics and approximation algorithms have been proposed, in order to find near optimal clustering solution in reasonable computational time. The most prominent clustering algorithm k-means is a greedy algorithm which has two stages: Initialization, in which we set the seed set of centroids, and an iterative stage, called Lloyd’s algorithm [2]. It is widely reported in the literature that the performance of the Lloyd’s algorithm highly depends upon the initialization stage [3].
In the next section, some related work are briefly discussed. Then the proposed method and its computational complexity are described in Section 3. Section 4 applies this clustering approach to some standard data sets and reports its performance. Finally, conclusion of the paper is summarized in Section 5.
2.
RELATED WORK
There exist several approaches to initialize k-means. One of the earliest,, was proposed by Forgy in 1965 [4]. It consists of setting the initial centroids set as k randomly selected instances from the
dataset. Another initialization procedure that is based on simple probabilistic seeding procedures. In particular, the k-means++ method, proposed by Arthur and Vassilvitskii in
probabilistically selects log(K) centers in each round and then greedily selects the center that most reduces the SSE. It chooses the first center randomly and the i-th (I ∈ {2, 3, . . . , k}) center is chosen to be x′ ∈X with a probability of n
md(x′ )2
/ md(xj)2 j=1
where md(x) denotes the minimum-distance from a point x to the previously selected centers. The drawback of this approach is referred to its sequential nature, as well as to the fact that it requires k scans of the entire dataset, therefore it has a complexity of O(nkd). Moreover, the sequential nature of this initialization technique hinders its parallelization. Bahmani et al [6] proposed a parallel version of the k-means++, called k-means|| . The idea behind this method is to sample O(k) points per iteration, instead of one single instance, as proposed in the k-means++. This approach outperforms k-means++ in both sequential and parallel settings.
Among the deterministic initialization methods, KKZ was proposed by [7] which consists to find the
data points that are most far apart from each other, since those data points are more likely to belong to
different clusters. The pseudo-code for KKZ is as follows: 1. Choose the point with the maximum L2-norm as the
first centroid.
2. For j = 2, . . . , k, each centroid mj is set in the following way: For any remaining data xi , its distance di to the
existing centroids is computed. di is calculated as the
distance between xi to its closest existing centroid. Then,
the point with the largest d i is selected as mj.
In this work, we propose an approach (called ss_kmeans, for sequential sampling) based on a simple deterministic sampling of the input dataset.
3.
PROPOSED APPROACH
The main idea of the proposed method, is to sample the given data set into equal parts, and to compute the means of these initial clusters as the seeds of the method. More details are presented in the following pseudo-code:
Input: A data set X whose cardinality is n and an integer k Output: k seeds cj
c(j,:)=mean(X(1+(j-1)*p:j*p,:)) end For
[I,C]=kmeans(X,k,'start',c)
Like kkz, this method has a complexity of O(nkd), but practically our experimental results showed that it is often faster than kkz.
4.
EXPERIMENTAL RESULTS
Algorithm validation is conducted using different data sets from the UCI Machine Learning Repository[8]. We evaluated its performance by applying on several benchmark datasets and compare with KKZ_ k-means.
Silhouette index [9] which measures the cohesion based on the distance between all the points in the same cluster and the separation based on the nearest neighbor distance, was used in these experiments in order to evaluate clustering accuracy. ( bigger average silhouette value indicates a higher clustering accuracy ).
Experimental results are reported in table 1, figure 1 and figure 2, and some clustering results are depicted in figure 3 to 6.
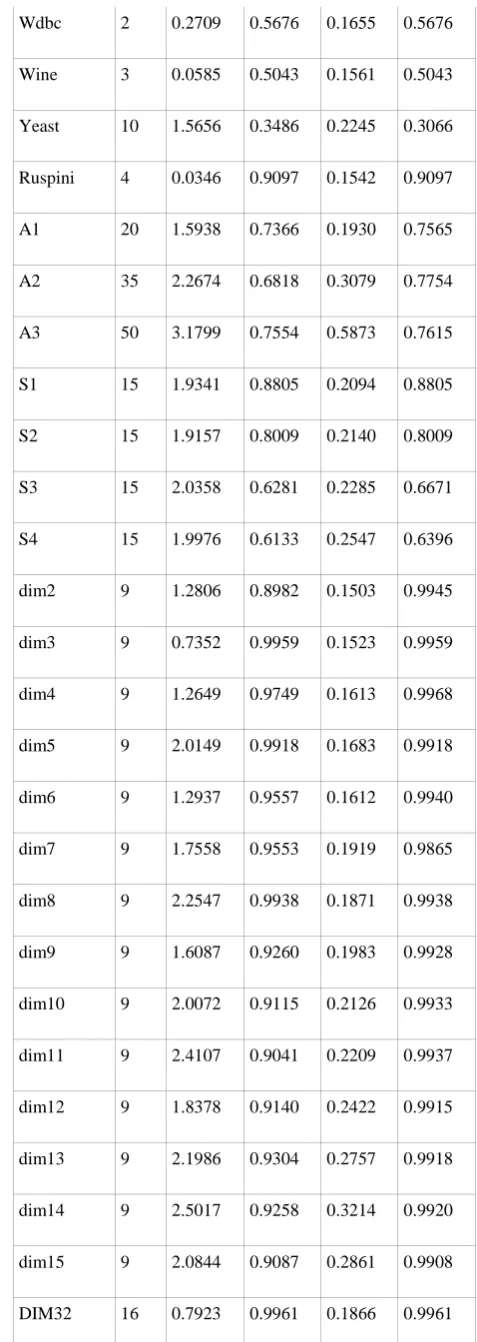
Table 1. Experimental results of ss_kmeans and
kkz_kmeans application on different datasets in term of elapsed time (s) before convergence and mean Silhouette
value
kkz_kmeans ss_kmeans
Dataset k Elapsed
time Average Sil. Elapsed time Average Sil.
Iris 3 0.0760 0.8152 0.1463 0.8152
Breast 2 0.3557 0.7542 0.1644 0.7542
Flame 2 0.0711 0.8760 0.1424 0.8760
Glass 7 0.0840 0.4732 0.1514 0.4484
Jain 2 0.1327 0.9078 0.1581 0.9078
PathBased 3 0.1059 0.7253 0.1393 0.6332
R15 15 0.2808 0.9356 0.1639 0.9356
Aggregation 7 0.4604 0.7366 0.1566 0.7366
Compound 6 0.1424 0.7684 0.1624 0.6445
D31 31 1.7261 0.9037 0.2182 0.9182
Spiral 3 0.1085 0.5234 0.1335 0.5234
Thyroid 2 0.0654 0.7701 0.1568 0.7701
Wdbc 2 0.2709 0.5676 0.1655 0.5676
Wine 3 0.0585 0.5043 0.1561 0.5043
Yeast 10 1.5656 0.3486 0.2245 0.3066
Ruspini 4 0.0346 0.9097 0.1542 0.9097
A1 20 1.5938 0.7366 0.1930 0.7565
A2 35 2.2674 0.6818 0.3079 0.7754
A3 50 3.1799 0.7554 0.5873 0.7615
S1 15 1.9341 0.8805 0.2094 0.8805
S2 15 1.9157 0.8009 0.2140 0.8009
S3 15 2.0358 0.6281 0.2285 0.6671
S4 15 1.9976 0.6133 0.2547 0.6396
dim2 9 1.2806 0.8982 0.1503 0.9945
dim3 9 0.7352 0.9959 0.1523 0.9959
dim4 9 1.2649 0.9749 0.1613 0.9968
dim5 9 2.0149 0.9918 0.1683 0.9918
dim6 9 1.2937 0.9557 0.1612 0.9940
dim7 9 1.7558 0.9553 0.1919 0.9865
dim8 9 2.2547 0.9938 0.1871 0.9938
dim9 9 1.6087 0.9260 0.1983 0.9928
dim10 9 2.0072 0.9115 0.2126 0.9933
dim11 9 2.4107 0.9041 0.2209 0.9937
dim12 9 1.8378 0.9140 0.2422 0.9915
dim13 9 2.1986 0.9304 0.2757 0.9918
dim14 9 2.5017 0.9258 0.3214 0.9920
dim15 9 2.0844 0.9087 0.2861 0.9908
DIM64 16 0.8591 0.9984 0.2462 0.9984
DIM128 16 1.0009 0.9991 0.3790 0.9991
DIM256 16 1.2668 0.9996 0.6059 0.9996
DIM512 16 1.8907 0.9998 1.0992 0.9998
DIM1024 16 3.7001 0.9999 3.2046 0.9999
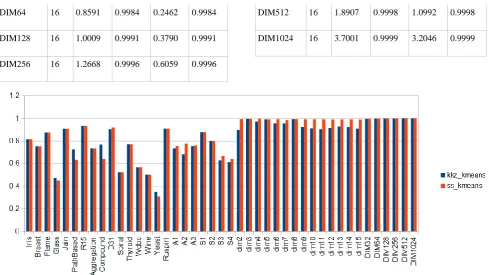
Fig 1: Chart of ss_kmeans and kkz_kmeans application on different datasets in term of average Silhouette value
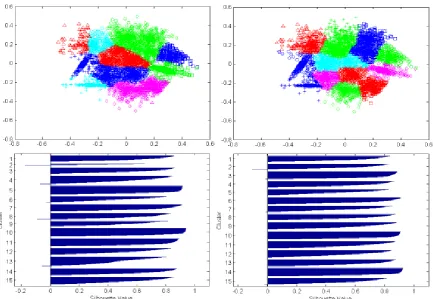
Fig 3: Clustering results of a2 dataset using kkz_kmeans (on left) and ss_kmeans (on right)
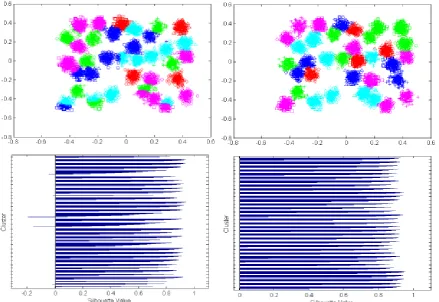
Fig 5: Clustering results of s3 dataset using kkz_kmeans (on left) and ss_kmeans (on right)
5.
CONCLUSION
In this paper, a simple deterministic k-means initialization algorithm was suggested. Performance evaluation was done by applying on several standard datasets and comparing with kkz, a well know related approach. Experimental results have demonstrated that this approach is effective in producing consistent clustering results faster than kkz.
In future work, a parallel version of this method could be considered. Another possible enhancement will consist to find a way such that this approach will become independent to data ordering.
6.
ACKNOWLEDGMENTS
Our thanks to the anonymous reviewers for their helpful comments.
7.
REFERENCES
[1] Aloise D., Deshpande A., Hansen P., Popat P.: NP-hardness of Euclidean sum-of- squares clustering. Machine Learning, 75, 245 − 249 (2009).
[2] Lloyd., S. P. (1982). "Least squares quantization in PCM". IEEE Transactions on Information Theory 28 (2): 129–137. doi:10.1109/TIT.1982.1056489.
[3] Peña J.M., Lozano J.A., Larrañaga P.: An empirical
comparison of four initialization methods for the k-means algorithm. Pattern Recognition Letters, 20(10), 1027 − 1040 (1999).
[4] 4.. Forgy E., "Cluster analysis of multivariate data: Efficiency vs. interpretability of classifications". Biometrics, 21, 768 − 769 (1965).
[5] Arthur D., Vassilvitskii S.: k-means++: the advantages of careful seeding. In: Proceedings of the 18th annual ACM-SIAM Symp. on Disc. Alg, pp. 1027 − 1035 (2007).
[6] Bahmani B., Moseley B., Vattani A., Kumar R., Vassilvitskii S.:Scalable K-means++. In: Proceedings of the VLDB Endowment (2012).
[7] I. Katsavounidis, C.-C. J. Kuo, Z. Zhang, A New Initialization Technique for Generalized Lloyd Iteration, IEEE Signal Processing Letters 1 (10) (1994) 144–146. [8] 8.Asuncion, A. and Newman, D.J. (2007). UCI Machine
LearningRepository[http://www.ics.uci.edu/~mlearn/ML Repository.html]. Irvine, CA: University of California, School of Information and Computer Science.