109
Design And Construction Of Digital Multi-Meter
Using PIC Microcontroller
Khawn Nue, Dr. KyawSoe Lwin, Hla Myo Tun
Abstract: This thesis describes the design and construction of digital multi-meter using PIC microcontroller. In this system, a typical multi-meter may
include features such as the ability to measure AC/DC voltage, DC current, resistance, temperature, diodes, frequency and connectivity. This design uses of the PIC microcontroller, voltage rectifiers, voltage divide, potentiometer, LCD and other instruments to complete the measure. When we used what we have learned of microprocessors and adjust the program to calculate and show the measures in the LCD, keypad selected the modes. The software programming has been incorporated using MPLAB and PROTEUS. In this system, the analogue input is taken directly to the analogue input pin of the microcontroller without any other processing. So the input range is from 0V to 5V the maximum source impedance is 2k5 (for testing use a 1k pot). To improve the circuit adds an op-amp in front to present greater impedance to the circuit under test. The output impedance of the op-amp will be low which a requirement of the PIC analogue input is.
Keyword: PIC 16F887 Microcontroller, LCD display, MPLAB, PROTEUS.
————————————————————
I. I
NTRODUCTIONNowadays many measurement instruments have been used in all laboratories throughout the world. Unfortunately, their accuracies are mostly proportional to the time period. As time passes, they may function incorrectly and generate some errors. The mistaken results from such instruments can cause serious problems in economic system and life safety since they will be used for validating product standards in the importing and exporting industries. In order to ensure that they work perfectly, the calibration process is required. In the past, the calibration has to be performed manually and this process usually takes long time. Presently, fully automatic calibration systems have been used worldwide and they play an important role in the calibration of measurement instruments. They can improve measurement accuracy, repeatability and minimize routine jobs. This system is to measure AC/DC voltage, current, diodes, temperature, connectivity, frequency and resistance using PIC microcontroller. To carry out the design consideration and production of a useful consumer product of PIC microcontroller. The whole process of the digital multi-meter is controlled by PIC 16F887 microcontroller.
II. DIGITAL MULTI-METER SYSTEM
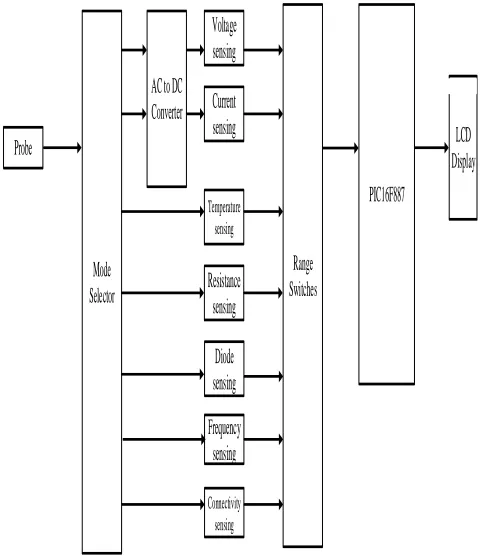
A multi-meter or a multi-tester, also known as a volt/ohm meter or VOM, is an electronic measuring instrument that combines several measurement functions in one unit. A typical multi-meter may include features such as the ability to measure voltage, current and resistance. Modern multi-meters are often digital due to their accuracy, durability and extra features. In a Digital Multi-meter the signal under test is converted to a voltage and an amplifier with an electronically controlled gain preconditions the signal. A Digital Multi-meter displays the quantity measured as a number, which prevents parallax errors. The inclusion of
solid state electronics, from a control circuit to small embedded computers, has provided a wealth of convenience features in modern digital meters.
PIC16F887
LCD
Display
Mode
Selector
Voltage
sensing
Current
sensing
Temperature sensing
AC to DC
Converter
Range
Switches
Probe
Resistance
sensing
Diode
sensing
Frequency
sensing
Connectivity sensing
Fig. 1 Block Diagram of Digital Multi-meter
V. Software Implementation
Software Implementation can be divided into sixparts:
measuring voltage, measuring current, measuring
resistance, measuring frequency, measuring continuity and measuring diode. Program for this system is composed of
main Processing (sensing/ assigning/
displaying).Microcontroller is main processing unit in remote control system. PIC16F887is chosen to perform the functions needed for digital multi-meter system.
_____________________
Khawn Nue, Dr. KyawSoe Lwin and Hla Myo Tun
Department of Electronic Engineering, Mandalay Technological University
START
Assign I/O Port LCD-Init();
DC-1V mode
Read – Adc (0)
Adc = adc*0.049
Display on LCD (1,1)
Yes
adc > 1023
Ful l Range
Yes
DC-50V mode
Read – Adc (0)
Adc = adc*0.049
Display on LCD (1,1)
Yes
adc > 1023
Ful l Range
Yes No No
No No
DC-500V mode
Read – Adc (0)
Adc = adc*0.049
Display on LCD (1,1)
Yes
adc > 1023
Ful l Range
Yes No No
AC-500V mode
Read – Adc (0)
Adc = adc*0.049
Display on LCD (1,1)
Yes
adc > 1023
Ful l Range
Yes No No
St op ?
Yes
End
No
Fig.2 Flow Chart of voltage measurement
The flow chart of the voltage measurement system is shown in figure 2. At the start of the program, PIC needed to be initialized the I/O pins assigned and clock frequency. After that, the PIC receives the corresponding code from the specified pin.Firstly selection dc mode for 0-1V, 0-50V, 0-500V.For 0-1V, it will read between 0 to 1V. For more than 1V, it will be display full range.For 0-50V, it will read between 0 to 50V. For more than 50V, it will be display full range.For 0-500V, it will read between 0 to 500V. For more than 500V, it will be display full range.Similarly for selection ac mode.
DC-1mA mode
Read – Adc (1)
Adc = adc*0.977
Display on LCD (1,10)
Yes
adc > 1023
Ful l Range
Yes
DC-1A mode
Read – Adc (1)
Adc = adc*0.977
Display on LCD (1,10)
Yes
adc > 1023
Ful l Range
Yes No No
No No
DC-10A mode
Read – Adc (1)
Adc = adc*0.977
Display on LCD (1,10)
Yes
adc > 1023
Ful l Range
Yes No No
No
St op ?
Full Range
Full Range
Full Range
End Star
Temperature adc > 1023
Adc = adc*0.977
Adc = adc*0.977
Display on LCD (1,10)
Full Range
Yes
Fig.3 Flow Chart of current measurement
111
The flow chart of the current and temperature measurement system is shown in figure 3. At the start of the program, PIC needed to be initialized the I/O pins assigned and clock frequency. After that, the PIC receives the corresponding code from the specified pin.To test for current, first determine testing DC current. Then set the switch to the appropriate function DC current. To test for temperature, it is related for full -55 C to 150 C range and then an output voltage linearly proportional to the temperature in degree centigrade.
Fig.4 Flow Chart of resistance measurement
Resistance opposes the flow of current. The higher the resistance, the lower the current flow. Insulation used for cables has a very high resistance, impeding current flow. Conversely, the cable’s copper conductor has low resistance, facilitating current flow. Proper resistance is critical. Too much resistance in electric wires and connections can result in overheating and possible fire hazards, while too little resistance may result in a short or performance problems. Components called resistors help maintain proper resistance in equipment.The flow chart of the resistance measurement system is shown in figure 4. At the start of the program, PIC needed to be initialized the I/O pins assigned and clock frequency. After that, the PIC receives the corresponding code from the specified pin. To test for resistance, first turn the power off in the circuit or component for testing.
St art
Frequency
Read – RC 0
Interrupt Read
Display on LCD (2,10)
Yes
St op ?
No
Yes
End
No
Fig.5 Flow Chart of frequency measurement
These digital multi-meters is measured in Hertz (Hz) the number of times per second a wave form repeats.The flow chart of the resistance measurement system is shown in figure5.
St art
Cont inuity
Read – RC 1
Display on LCD (2,10) Yes
St op ? No
Yes
End No
Fig.6 Flow Chart of connectivity measurement
Testing for continuity is used to test to verify if a circuit, wire or fuse is complete with no open connect test probe across two points of the circuit under testing. If continuity exists
St art
Resist ance 1k Ohm
Read – Adc (2)
Adc = adc*9.76
Display on LCD (2,1)
Yes
adc > 1023
Ful l Range
Yes
Resist ance 10k Ohm
Read – Adc (2)
Adc = adc*9.76
Display on LCD (2,1)
Yes
adc > 1023
Ful l Range
Yes
No No
No No
Resist ance 100k Ohm
Read – Adc (2)
Adc = adc*9.76
Display on LCD (2,1)
Yes
adc > 1023
Ful l Range
Yes
No No
No
St op ?
End
built-in buzzer will sound and display on LCD “connect”. If continuity does not exists display “opened” on LCD.
Start
Diode
Read – Adc (2)
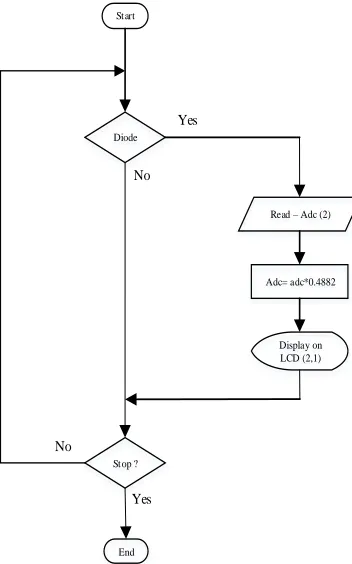
Adc= adc*0.4882 Display on LCD (2,1) Yes Stop ? No Yes End No
Fig.7 Flowchart of diode measurement
If the probe connection is forward the LCD will show the approximate forward voltage drop of the diode. If the probe connection is reversed, only LCD “open” will be displayed.
VI.
T
EST ANDR
ESULTP
HOTOS OF THES
YSTEMIn this system, the digital multi-meter can be measured voltage, current, temperature,resistance, diode, frequency and connectivity. The operation of the digital multi-meter condition and result will display on LCD screen as shown in Fig. 8.
Fig.8 Simulation diagram of digital multi-meter
Fig. 9 Prototype design of Digital Multi-meter
Fig.10 Simulation result of voltage sensing
Fig.11 Test and result of voltage sensing
RE3/MCLR/VPP 1 RA1/AN1/C12IN1-3 RA2/AN2/VREF-/CVREF/C2IN+ 4 RA4/T0CKI/C1OUT 6 RA5/AN4/SS/C2OUT 7 RB0/AN12/INT 33 RB1/AN10/C12IN3-34 RB2/AN8 35 RA7/OSC1/CLKIN 13RA6/OSC2/CLKOUT 14 RD5/P1B28 RD6/P1C29 RD7/P1D30 RC4/SDI/SDA 23 RC5/SDO24 RC3/SCK/SCL18 RC2/P1A/CCP117 RC1/T1OSI/CCP2 16 RC0/T1OSO/T1CKI 15 RB7/ICSPDAT 40RB6/ICSPCLK 39RB5/AN13/T1G 38RB4/AN11 37 RD322 RD221 RD120 RD019 RC7/RX/DT26 RC6/TX/CK25 RE2/AN710 RE1/AN69 RE0/AN58 RA3/AN3/VREF+/C1IN+ 5 RD427 RB3/AN9/PGM/C12IN2-36 RA0/AN0/ULPWU/C12IN0-2 U1 PIC16F887 D 7 14 D 6 13 D 5 12 D 4 11 D 3 10 D 2 9 D 1 8 D 0 7 E 6 RW 5 R S 4 V SS 1 V D D 2 V E E 3 LCD1 LM016L SW1 SW-ROT-4 AN0 AN0 SW2 SW-ROT-4 R1 10k R2 10k R3 10k R4 90k R5 1k R6 99k SW3 SW-ROT-4 R9 10k R10 10k R11 10k R12 10k D1 1N4733A C4 C5 C6 C7 C4 C5 C6 C7 B1 49 RS EN LD4 LD5 LD6 LD7 L D 4 L D 5 L D 6 L D 7 E N R S D0 D1 D2 D3 D4 D5 D6 D7 SW4 SW-ROT-4 AN1 SW5 SW-ROT-4 R15 5 R17 0.5 SW6 SW-ROT-4 R21 10k R22 10k R23 10k R24 10k D2 1N4733A D0 D1 D2 D3 B2 100V SW7 SW-ROT-4 AN2 SW8 SW-ROT-4 R27 9k R29 90k R32 10k SW9 SW-ROT-4 R33 10k R34 10k R35 10k R36 10k D3 1N4733A D4 D5 D6 D7 AN1 AN2 R37 10 D4 DIODE C1 22uF R7 660k R8 6.8k Temp DC 1A DC 1mA DC 1V DC 50V dc 500V ac 500V DC 10A 1k Ohm 10k Ohm 100k Ohm R42 10k R43 10k B6 B7 C0 C0 C1 C0 C1 B6 B7 R18 10k R20 10k Diode Test D5 DIODE Frequency Connectivity V1 VSINE 41 .0 3 1 V O U T 2 U2 LM35 R13 5k R19 900 R25 9k R26 90k R28 900k BUZ1 BUZZER R3(2) SW10 SW-SPDT-MOM AN0 D 7 1 4 D 6 1 3 D 5 1 2 D 4 1 1 D 3 1 0 D 2 9 D 1 8 D 0 7 E 6 R W 5 R S 4 V S S 1 V D D 2 V E E 3 LCD1 LM016L L D 4 L D 5 L D 6 L D 7 E N R S RE3/MCLR/VPP 1 RA1/AN1/C12IN1-3 RA2/AN2/VREF-/CVREF/C2IN+ 4 RA4/T0CKI/C1OUT 6 RA5/AN4/SS/C2OUT 7 RB0/AN12/INT 33 RB1/AN10/C12IN3-34 RB2/AN8 35 RA7/OSC1/CLKIN 13 RA6/OSC2/CLKOUT 14 RD5/P1B 28 RD6/P1C 29 RD7/P1D 30 RC4/SDI/SDA 23 RC5/SDO 24 RC3/SCK/SCL 18 RC2/P1A/CCP1 17 RC1/T1OSI/CCP2 16 RC0/T1OSO/T1CKI 15 RB7/ICSPDAT 40 RB6/ICSPCLK 39 RB5/AN13/T1G 38 RB4/AN11 37 RD3 22 RD2 21 RD1 20 RD0 19 RC7/RX/DT 26 RC6/TX/CK 25 RE2/AN7 10 RE1/AN6 9 RE0/AN5 8 RA3/AN3/VREF+/C1IN+ 5 RD4 27 RB3/AN9/PGM/C12IN2-36 RA0/AN0/ULPWU/C12IN0-2 U1 PIC16F887 AN0 C4 C5 C6 C7 RS EN LD4 LD5 LD6 LD7 D0 D1 D2 D3 D4 D5 D6 D7 AN1 AN2 DC 1mA C0 C1 B6 B7 SW1 SW-ROT-4 AN0 SW2 SW-ROT-4 R1 10k R2 10k R3 10k R4 90k R5 1k R6 99k SW3 SW-ROT-4 R9 10k R10 10k R11 10k R12 10k D1 1N4733A C4 C5 C6 C7 B1 50 D4 DIODE C1 22uF R7 660k R8 6.8k DC 1V DC 50V dc 500V
ac 500V V1
VSINE
113 Fig.12 Simulation result of current sensing
Fig.13 Test and result of current sensing
Fig.14 Simulation result of resistance sensing
Fig.15 Test and result of resistance sensing
Fig.16 Simulation result of frequency sensing
D 7 1 4 D 6 1 3 D 5 1 2 D 4 1 1 D 3 1 0 D 2 9 D 1 8 D 0 7 E 6 R W 5 R S 4 V S S 1 V D D 2 V E E 3 LCD1 LM016L L D 4 L D 5 L D 6 L D 7 E N R S RE3/MCLR/VPP 1 RA1/AN1/C12IN1-3 RA2/AN2/VREF-/CVREF/C2IN+ 4 RA4/T0CKI/C1OUT 6 RA5/AN4/SS/C2OUT 7 RB0/AN12/INT 33 RB1/AN10/C12IN3-34 RB2/AN8 35 RA7/OSC1/CLKIN 13 RA6/OSC2/CLKOUT 14 RD5/P1B 28 RD6/P1C 29 RD7/P1D 30 RC4/SDI/SDA 23 RC5/SDO 24 RC3/SCK/SCL 18 RC2/P1A/CCP1 17 RC1/T1OSI/CCP2 16 RC0/T1OSO/T1CKI 15 RB7/ICSPDAT 40 RB6/ICSPCLK 39 RB5/AN13/T1G 38 RB4/AN11 37 RD3 22 RD2 21 RD1 20 RD0 19 RC7/RX/DT 26 RC6/TX/CK 25 RE2/AN7 10 RE1/AN6 9 RE0/AN5 8 RA3/AN3/VREF+/C1IN+ 5 RD4 27 RB3/AN9/PGM/C12IN2-36 RA0/AN0/ULPWU/C12IN0-2 U1 PIC16F887 AN0 C4 C5 C6 C7 RS EN LD4 LD5 LD6 LD7 D0 D1 D2 D3 D4 D5 D6 D7 AN1 AN2 DC 1mA C0 C1 B6 B7 SW4 SW-ROT-4 AN1 SW5 SW-ROT-4 R15 5 R17 0.5 SW6 SW-ROT-4 R21 10k R22 10k R23 10k R24 10k D2 1N4733A D0 D1 D2 D3 B2 100V R37 10 Temp DC 1A DC 1mA DC 10A 4 1 .0 3 1 V O U T 2 U2 LM35 R13 5k D 7 1 4 D 6 1 3 D 5 1 2 D 4 1 1 D 3 1 0 D 2 9 D 1 8 D 0 7 E 6 R W 5 R S 4 V S S 1 V D D 2 V E E 3 LCD1 LM016L L D 4 L D 5 L D 6 L D 7 E N R S RE3/MCLR/VPP 1 RA1/AN1/C12IN1-3 RA2/AN2/VREF-/CVREF/C2IN+ 4 RA4/T0CKI/C1OUT 6 RA5/AN4/SS/C2OUT 7 RB0/AN12/INT 33 RB1/AN10/C12IN3-34 RB2/AN8 35 RA7/OSC1/CLKIN 13 RA6/OSC2/CLKOUT 14 RD5/P1B 28 RD6/P1C 29 RD7/P1D 30 RC4/SDI/SDA 23 RC5/SDO 24 RC3/SCK/SCL 18 RC2/P1A/CCP1 17 RC1/T1OSI/CCP2 16 RC0/T1OSO/T1CKI 15 RB7/ICSPDAT 40 RB6/ICSPCLK 39 RB5/AN13/T1G 38 RB4/AN11 37 RD3 22 RD2 21 RD1 20 RD0 19 RC7/RX/DT 26 RC6/TX/CK 25 RE2/AN7 10 RE1/AN6 9 RE0/AN5 8 RA3/AN3/VREF+/C1IN+ 5 RD4 27 RB3/AN9/PGM/C12IN2-36 RA0/AN0/ULPWU/C12IN0-2 U1 PIC16F887 AN0 C4 C5 C6 C7 RS EN LD4 LD5 LD6 LD7 D0 D1 D2 D3 D4 D5 D6 D7 AN1 AN2 DC 1mA C0 C1 B6 B7 SW7 SW-ROT-4 AN2 SW8 SW-ROT-4 R27 9k R29 90k R32 10k SW9 SW-ROT-4 R33 10k R34 10k R35 10k R36 10k D3 1N4733A D4 D5 D6 D7 1k Ohm 10k Ohm 100k Ohm Diode Test D5 DIODE R19 900 R25 9k R26 90k R28 900k RE3/MCLR/VPP 1 RA1/AN1/C12IN1-3 RA2/AN2/VREF-/CVREF/C2IN+ 4 RA4/T0CKI/C1OUT 6 RA5/AN4/SS/C2OUT 7 RB0/AN12/INT 33 RB1/AN10/C12IN3-34 RB2/AN8 35 RA7/OSC1/CLKIN 13 RA6/OSC2/CLKOUT 14 RD5/P1B 28 RD6/P1C 29 RD7/P1D 30 RC4/SDI/SDA 23 RC5/SDO 24 RC3/SCK/SCL 18 RC2/P1A/CCP1 17 RC1/T1OSI/CCP2 16 RC0/T1OSO/T1CKI 15 RB7/ICSPDAT 40 RB6/ICSPCLK 39 RB5/AN13/T1G 38 RB4/AN11 37 RD3 22 RD2 21 RD1 20 RD0 19 RC7/RX/DT 26 RC6/TX/CK 25 RE2/AN7 10 RE1/AN6 9 RE0/AN5 8 RA3/AN3/VREF+/C1IN+ 5 RD4 27 RB3/AN9/PGM/C12IN2-36 RA0/AN0/ULPWU/C12IN0-2 U1 PIC16F887 AN0 C4 C5 C6 C7 RS EN LD4 LD5 LD6 LD7 D0 D1 D2 D3 D4 D5 D6 D7 AN1 AN2 DC 1mA C0 C1 B6 B7 D 7 1 4 D 6 1 3 D 5 1 2 D 4 1 1 D 3 1 0 D 2 9 D 1 8 D 0 7 E 6 R W 5 R S 4 V S S 1 V D D 2 V E E 3 LCD1 LM016L L D 4 L D 5 L D 6 L D 7 E N R S R42 10k R43 10k
B6 freq B7 connect
Fig.17 Test and result of frequency sensing
VII. C
ONCLUSIONA microcontroller is essential if an automated system is to be achieved. A PIC microcontroller (PIC16F887), together with some auxiliary components were chosen and implemented in the design for the reasons that have been addressed in the previous chapter and sections. This design had to establish physically how the circuit to work and by other hand we were programming and programming until the measure was desired. Nowadays, many measurement instruments have been used in all laboratories through the world. Unfortunately, their accuracies are mostly proportional to the time period. At time passes, they may function incorrectly and generate some errors. In this digital multi-meter can be easily to use the user and safety. The system is flexible and safer to use. Smart feature can be added or withdrawn as per requirement and hence design is fully cost effective. By modifying this system, it is more useful and real apply the world.
Fig.18 Simulation result of frequency sensing
Fig.19 Test and result of connectivity sensing
A
CKNOWLEDGMENTThe author would like to thank to Dr. HlaMyoTun, Associate Professor and Head of the Department of Electronic Engineering, Mandalay Technological University for his help. And thanks to the supervisor, Dr. KyawSoeLwin, Lecturers, Department of Electronic Engineering, Mandalay Technological University for his guidance, support and encouragement.
R
EFERENCES[1] “LM 78XX/ LM 78XXA Positive Voltage Regulator Data
Sheet”, Available from. http://www.fairchildsemi.com/
[2] John Iovine, “PIC Microcontroller Project Book”(2000).
[3] Gothmann W. H., “Digital Electronics - An introduction
to Theory and Practice.” Prentice-Hall, Englewood
Cliffs, NJ, USA, 1977.
[4] Hd44780U (LCD-II), 2006
http://www.chipdocs.com/pndecoder/ HIT/HD47780U.html
[5] Sedra Adel, S. and Smitch Ken, C: Microelectronic
Circuits, Oxford University Press, New York (1998).
[6] Anonymous: Microchip Co,Ltd. “PIC16F8X Datasheet”,
August (2006).
RE3/MCLR/VPP 1
RA1/AN1/C12IN1-3
RA2/AN2/VREF-/CVREF/C2IN+ 4
RA4/T0CKI/C1OUT 6
RA5/AN4/SS/C2OUT 7
RB0/AN12/INT 33
RB1/AN10/C12IN3-34
RB2/AN8 35
RA7/OSC1/CLKIN 13 RA6/OSC2/CLKOUT 14
RD5/P1B 28 RD6/P1C 29 RD7/P1D 30 RC4/SDI/SDA 23 RC5/SDO 24 RC3/SCK/SCL 18 RC2/P1A/CCP1 17 RC1/T1OSI/CCP2 16 RC0/T1OSO/T1CKI 15
RB7/ICSPDAT 40 RB6/ICSPCLK 39 RB5/AN13/T1G 38 RB4/AN11 37
RD3 22 RD2 21 RD1 20 RD0 19 RC7/RX/DT 26 RC6/TX/CK 25
RE2/AN7 10 RE1/AN6 9 RE0/AN5 8 RA3/AN3/VREF+/C1IN+
5
RD4 27
RB3/AN9/PGM/C12IN2-36
RA0/AN0/ULPWU/C12IN0-2
U1
PIC16F887 AN0
C4 C5 C6 C7
RS EN LD4 LD5 LD6 LD7
D0 D1 D2 D3 D4 D5 D6 D7 AN1
AN2
DC 1mA
C0 C1
B6 B7
D
7
1
4
D
6
1
3
D
5
1
2
D
4
1
1
D
3
1
0
D
2
9
D
1
8
D
0
7
E
6
R
W
5
R
S
4
V
S
S
1
V
D
D
2
V
E
E
3
LCD1
LM016L
L
D
4
L
D
5
L
D
6
L
D
7
E
N
R
S
R42
10k
R43
10k
B6 freq B7 connect
C0
C0 C1
R18
10k
R20
10k
Frequency Connectivity
BUZ1
BUZZER
SW10