Empirical Analysis of Construction Safety
Climate – A Study
S.V.S.RAJA PRASAD1* and K.P.REGHUNATH2*
Construction Industry Staff College, National Institute of Construction Management and Research, Hyderabad, India Abstract
Safety in the construction industry has always been a major issue. Though much improvement in construction safety has been achieved, the industry still continues to lag behind most other industries with regard to safety. The safety climate of any organization consists of employee’s attitudes towards and perceptions of, health and safety behavior. Construction workers attitudes towards safety are influenced by their perceptions of risk, management, safety rules and procedures. A measure of safety climate could be used to identify those areas of safety that need more attention and improvement. The dynamic nature of safety climate, which has the ability to change on daily basis, means there is a great need for reliable tools that can measure safety climate. Safety climate is a leading performance indicator that can provide insight into safety performance before accidents have occurred. In the present study a questionnaire was framed to ascertain safety climate in major construction organizations across India involved in construction of Thermal power plants, Hydro power plants, Highway projects, Bridge works, Refinery works, High rise works, Pipe line works and Dam woks and its content validity was verified. The internal consistency of the questionnaire was tested by using Cronbachs alpha coefficient. Data was collected based on questionnaire from employees working in various construction firms in India. The results of questionnaires survey was tested statistically by using the Kruskal – Wallis test to ascertain the attitudes of different categories of employees towards safety climate.
Key words: Safety climate, Management Commitment, Content validity ratio, Internal consistency, Subject-matter experts (SMEs)
1.0 Introduction
(Disclaimer: The mentioned study do not establish cause and effect relationship between the used variables. This paper makes an attempt to relate the variables. This paper does not include geographic, demographic and social profile of the respondents.)
Safety climate is a ‘snapshot’ of workforce perceptions about safety [Mearns et al., 1997]1. The concept of safety
climate emphasizes the importance of how organizations manage health and safety in the workplace. It is important that managers consider that any changes made to the operations of a business, will have an impact on workers perceptions. These perceptions have a psychological utility in serving as a frame of reference for guiding appropriate and adaptive task behaviour. As the workers environment changes around them, they adapt their perceptions and ultimately their behaviours. Measuring safety climate is still relatively new when compared with the concepts of social and work climate. Previous to Zohar’s [2002]2 study of the Israeli manufacturing sector, the assessment of an
2.0 Critical Factors of Safety Climate
The assessment of safety climate is facilitated by using well developed methods for assessing attitudes and work practices. In general terms, the attitude measures, or dimensions, fit into the following broad areas:
Organizational Context;
Social Environment;
Individual Appreciation and
Work Environment. 2.1 Organizational Context
Management Commitment - Perceptions of management’s Commitment towards health and safety issues. Communication - The nature and efficiency of health and safety Communications within the organization.
Priority of Safety - The relative status of health and safety issues within the organization. Safety Rules and Procedures - Views on the efficacy and necessity of rules and procedures. 2.2 Social Environment
Supportive Environment - The nature of the social environment at work, and the support derived from it. Involvement - The extent to which safety is a focus for everyone and all are involved
2.3 Individual Appreciation
Personal Priorities and Need for Safety - The individual’s view of their own health and safety management and need to feel safe.
Personal Appreciation of Risk - How individuals view the risk associated with work. 2.4 Work Environment
Physical Work Environment - Perceptions of the nature of the physical environment. 2.5 Organization Specific Factors
Attitudes to specific safety related systems and procedures (for example, permit to work systems) may be included as necessary.
The relationships between the various system interfaces (that is, the target of the assessment process), the methods used, and the resulting measures (or climate indicators) can be plotted on a climate matrix. It should be noted that several complementary measures can be incorporated in each cell of the matrix, those shown in Table 1 are only examples of what might appear there. The climate indicators shown in Table 1 have been derived, for example ‘Management Commitment’ has been measured using a sub-set of items in the attitude questionnaire.
Table 1: Safety Climate Matrix Systems
Interface
Methods
Organization/
Environment Work Group/ Organization Systems
Individual/Group/ Organization Systems
Attitude Questionnaires
Management Commitment, Work Environment
Supportive Environment, Involvement
Appreciation of Risk,
Personal Priorities Focus Group/
Interviews Management Style Co-operation Shared values Direct / Indirect
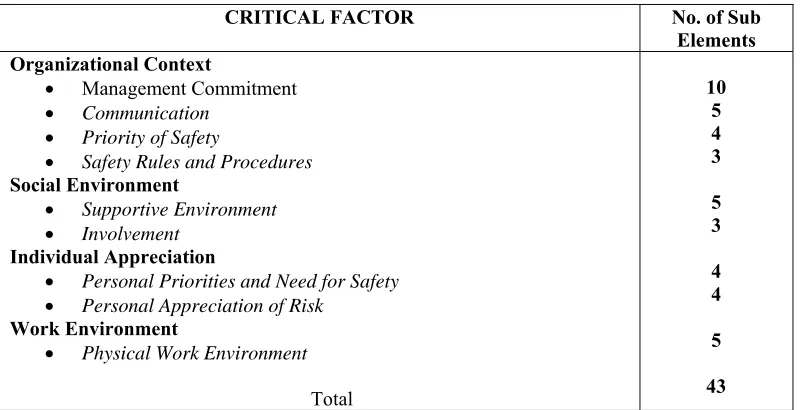
Table 2: Safety Climate Factors
CRITICAL FACTOR No. of Sub
Elements Organizational Context
Management Commitment
Communication
Priority of Safety
Safety Rules and Procedures Social Environment
Supportive Environment
Involvement Individual Appreciation
Personal Priorities and Need for Safety
Personal Appreciation of Risk Work Environment
Physical Work Environment
Total
10 5 4 3
5 3
4 4
5
43
3.0 Research Methodology
3.1. Validity and Reliability Testing for a Questionnaire
From an extensive literature review, a total of 43 success variables were identified. Before including them in the final draft of questionnaire, they were statistically validated using Content Validity Ratio (CVR). This internal validation was carried out by asking 52 experts (i.e. corporate safety heads, safety managers, safety engineers and senior safety officers who have been involved in managing safety in Construction projects for at least 10 years) whether or not the defined 43 variables were "1 = essential", "2 = useful but not essential" or "3 = not necessary". Degrees of necessity were used as success variables for safety program implementation. The data gathered were then calculated to obtain the CVR based on Lawshe's formula (Lawshe, 1975)3.
3.1.1 Lawshe’s Content Validity Ratio
In this approach, a panel of subject-matter experts (SMEs) is asked to indicate whether or not a measurement item in a set of other than a measurement item is “essential” to the operationalization of a theoretical construct. The SME input is then used to compute the CVR for each ith item in a measurement instrument (CVRi) as follows, where CVRi = [ne –( N/2)] / (N/2)
CVRi = CVR value for the ith measurement item, ne = number of SMEs indicating a measurement item is “essential,” and N =Total number of SMEs in the panel. We can infer from the CVR equation +1.00, where a CVR = 0.00 means that 50% of the SMEs in the panel of size N believe that a measurement item is “essential.” A CVR > 0.00 would, therefore, indicate that more than half of the SMEs believe that a particular measurement item is “essential,” and, thereby, face valid. Lawshe (1975, p. 568)3 has further established minimum CVR’s for different
panel sizes based on a one-tailed test at the a = 0.05 significance the panel, then measurement items for a specific construct, whose CVR values are less than 0.37, would be deemed as not “essential” and would be deleted from subsequent consideration.
3.2. Cronbach's alpha coefficient (α)
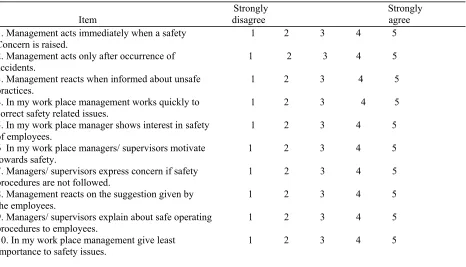
their attitude towards the management commitment. The multi-item scale is presented in Table 3 to measure employee’s attitude on “Managements commitment towards health and safety.”
Table 3: Multi – item Scale for Management’s Commitment
Strongly Strongly Item disagree agree 1. Management acts immediately when a safety 1 2 3 4 5 Concern is raised.
2. Management acts only after occurrence of 1 2 3 4 5 accidents.
3. Management reacts when informed about unsafe 1 2 3 4 5 practices.
4. In my work place management works quickly to 1 2 3 4 5 correct safety related issues.
5. In my work place manager shows interest in safety 1 2 3 4 5 of employees.
6 In my work place managers/ supervisors motivate 1 2 3 4 5 towards safety.
7. Managers/ supervisors express concern if safety 1 2 3 4 5 procedures are not followed.
8. Management reacts on the suggestion given by 1 2 3 4 5 the employees.
9. Managers/ supervisors explain about safe operating 1 2 3 4 5 procedures to employees.
10. In my work place management give least 1 2 3 4 5 importance to safety issues.
A description of the sections and related terms are as follows:
Item means - These are summary statistics for the individual item means. Item Variances - These are summary statistics for the individual item variances.
Inter-Item Correlations - This is descriptive information about the correlation of each item with the sum of all remaining items. In the example in Table 3, the correlation between the first item and the sum of the other items, the correlation between the second item and the sum of the other items, and so forth. The first number listed is the mean of these eight correlations (in our example .3824), the second number is the lowest of the eight (.0415), and so forth. Cronbach’s alpha reliability coefficient normally ranges between 0 and 1. However, there is actually no lower limit to the coefficient. The closer Cronbach’s alpha coefficient is to 1.0 the greater the internal consistency of the items in the scale. Based upon the formula, ALPHA = rk / [1 + (k -1) r] where k is the number of items considered and r is the mean of the inter-item correlations. The size of alpha is determined by both the number of items in the scale and the mean inter-item correlations.
Item-total Statistics - This is the section where one needs to direct primary attention. The items in this section are as follows:
a. Scale Mean if Item Deleted- Excluding the individual item listed, all other Scale items are summed for all individuals and the mean of the summated items is given.
b. Scale Variance if Item Deleted - Excluding the individual item listed, all other Scale items are summed for all individuals and the variance of the summated items is given.
c. Corrected Item-Total Correlation - This is the correlation of the item designated with the summated score for all other items.
e. Alpha if Item deleted - This is probably the most important column in the table. This represents the scale’s Cronbach’s alpha reliability coefficient for internal consistency if the individual item is removed from the scale.
3.3 Questionnaire Survey
A questionnaire survey was designed by incorporating the applicable 43 variables and the questions asking respondents to rate the level of influence of each variable. It aimed at obtaining the importance of each factor in ascertaining safety climate as perceived by the respondents. To extract the degree of influence, the respondents were asked to rate each factor on the five-point Likert scale, varying from "not important" (1) to "extremely important" (5). In addition, the respondents were asked to evaluate the actual status of each factor based on the amount of care currently given to it. The survey was carried out on large-scale construction projects in India, across eight states. Each organization is employing more than 800 workers. Several manners were used to distribute the questionnaires to the respondents. Nevertheless, to motivate the respondents to participate in the survey, face-to-face or direct delivery was preferred.
3.3.1 Characteristics of Respondents
The respondents are classified into three groups, namely project engineers, supervisors and workers. The responses from these three groups are shown in Table 4, which shows a total of 106 responses. The responses from three different groups are tested statistically by using the Kruskal-Wallis Test.
Table 4: Response Details
Socio economic
factors Engineers Project Supervisors Workers Overall Percentage
Less than 10 Between 10-15 Between 16-20 More than 20 Responded Selected for survey Percentage responded 14 9 10 7 40 71 38 9 19 8 2 38 59 36 8 11 4 5 28 70 26 31 39 22 14 106 200 100 29 37 21 13 100 -- -- 3.3.2 Kruskal- Wallis H –Test
The Kruskal Wallis test, also known as H - test is used to test the null hypothesis that several independent samples drawn from the same population or identical populations. All observations of all samples are pooled together and recorded in ascending order. The observations are ranked from low to high, so that lowest value will get a rank of 1 and so on. Based upon these ranks, the relative ranks are assigned to each observation in each sample. The sum of ranks in each sample is taken and the value of this sum is recorded.
The null hypothesis is that the attitude towards safety climate of three different groups is same. To extract the degree of influence, the respondents were asked to rate each factor on the five-point Likert scale, varying from "not important" (1) to "extremely important" (5) and the total scores for 43 variables from different categories of employees are tabulated (refer to Appendix - 1). The Kruskal Wallis H – test is applied for the scores obtained. The value of H is calculated by using the formula,
3
H = 12 / N (N +1) Σ {Ri2/ni } – 3 (N + 1)
Where N = n1+ n2 +n3 = 106,
R1, R2, R3 are the sum of ranks of engineers, supervisors and workers.
4.0 Results and Discussions 4.1 Content validity ratio
According to Lawshe, with a panel of 52 respondents, the minimum value of CVR needs to be at least 0.37 in order for it to be acceptable. As a result, variables which have CVR values less than 0.37 were not included in final questionnaire. This preliminary study showed that all 43variables had CVR value greater than 0.37, varying from 0.80 – 0.95. Thus, it was inferred that all 43 variables were strongly valid for this research and they could be included in the final form of a questionnaire.
4.2 Internal Consistency
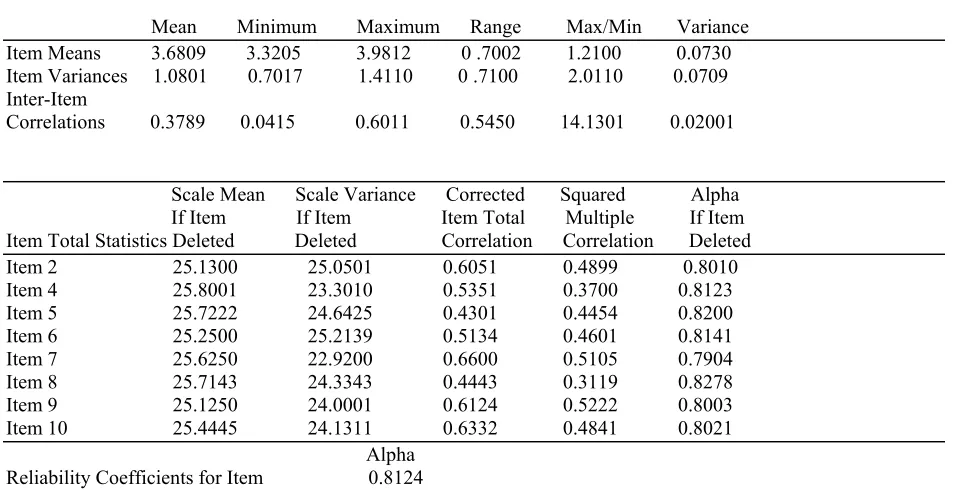
To know the internal consistency of the items of the questionnaire, reliability test was conducted on a small group of respondents who were requested to complete a final questionnaire. A total of 40 respondents were involved in the reliability test. To obtain α, the Statistical Package for Social Sciences (SPSS) software program was used to analyze raw data. The results of these analyses implied that the actual data collection could be performed by using this questionnaire. Table 5 shows the item-analysis output from SPSS for the multi-item scale of employee’s attitude towards “Management’s commitment” towards health and safety.
Table 5: Item Analysis Output
Mean Minimum Maximum Range Max/Min Variance Item Means 3.6809 3.3205 3.9812 0 .7002 1.2100 0.0730 Item Variances 1.0801 0.7017 1.4110 0 .7100 2.0110 0.0709 Inter-Item
Correlations 0.3789 0.0415 0.6011 0.5450 14.1301 0.02001
Scale Mean Scale Variance Corrected Squared Alpha If Item If Item Item Total Multiple If Item Item Total Statistics Deleted Deleted Correlation Correlation Deleted Item 2 25.1300 25.0501 0.6051 0.4899 0.8010 Item 4 25.8001 23.3010 0.5351 0.3700 0.8123 Item 5 25.7222 24.6425 0.4301 0.4454 0.8200 Item 6 25.2500 25.2139 0.5134 0.4601 0.8141 Item 7 25.6250 22.9200 0.6600 0.5105 0.7904 Item 8 25.7143 24.3343 0.4443 0.3119 0.8278 Item 9 25.1250 24.0001 0.6124 0.5222 0.8003 Item 10 25.4445 24.1311 0.6332 0.4841 0.8021 Alpha
Reliability Coefficients for Item 0.8124
The value of the alpha coefficient for the data obtained from the respondents was 0.798 demonstrating acceptable reliability of the questionnaire. George and Mallery (2003) provide the following rules of thumb: “_ > .9 – Excellent, _ > .8 – Good, _ > .7 – Acceptable, _ > .6 – Questionable, _ > .5 – Poor, and _ < .5 – Unacceptable” (p. 231). While increasing the value of alpha is partially dependent upon the number of items in the scale, it should be noted that this has diminishing returns. It should also be noted that an alpha of 0.798 is reasonably good.
4.3 Level of safety climate
Table 6: Sum of Ranks
S.No Sum of ranks of Engineers Sum of ranks of Supervisors Sum of ranks of Workers
1. 1869 2060.5 1741.5
The calculated value of H is 4.204. Since the distribution of H statistic is approximated by Chi square distribution. Comparing the computed value of H with the critical value of Chi square at 0.05 level of significance and at degrees of freedom 2, the critical value as 5.991. Since the computed value of H is less than the critical value of Chi square, the null hypothesis is accepted, which states that there is significant difference in the level of safety climate among three groups under consideration.
5.0 Conclusions
This study has established how complex the overall relationship of safety climate among three different groups. This degree of complexity requires that much more research is undertaken on the relationship between actual safety performance and safety climate. Although a large amount of research has focused on what safety measures should be included in the make-up of a questionnaire, there is still confusion over the number and type of safety climate measures that should be included. A Questionnaire with no content validity will not operationalize a theoretical construct of interest, and quantifying the content validity of questionnaire is used in the research. The significant difference in the level of safety climate among three groups under consideration is mainly due to organizational Context consists of Management Commitment, Communication, Priority of Safety and Safety Rules and Procedures. The supervisors who act as bridge between management and workers are strongly of the opinion that management commitment is crucial variable to improve safety climate in construction industry. The role of government to enforce regulatory requirements is also affecting safety climate and some state governments are not implementing the requirements particularly for construction industry. Firstly, Safety training to all employees, involving all categories of employees in decision making relating to safety issues and secondly, managers can encourage supervisors to be more involved in safety activities. Suggested behaviors for supervisors include being receptive about workforce ideas about ways to improve health and safety, will definitely improve safety climate in construction industry.
References
[1] Mearns, K., Whitaker, S.M. and Flin, R. (2001) ‘Benchmarking safety climate in hazardous environments: a longitudinal, interorganisational approach’, Risk Analysis, Vol. 21, No. 4, pp.771–786.
[2] Lawshe, C. H. (1975). A quantitative approach to content validity. Personnel Psychology, 28(4), 563-575.
[3] Zohar, D. (2002). Safety Climate: Conceptual and measurement Issues. In James C. Quick, Lois E. Tetrick, & Lennart Levi (Eds.), Handbook of Occupational Health Psychology. American Psychological Association (APA).
[4] Byrom. N. & Corbridge. J. (1997, 22–24 Sept.). A tool to assess aspects of an organizations health & safety climate. Proceedings of International Conference on Safety Culture in the Energy Industries. University of Aberdeen.
[5] Cabrera. D. D., & Isla. R. (1998). The role of safety climate in a safety management system. In A. Hale, & M. Baram (Eds.), Safety Management: The challenge of change. Oxford7 Elsevier.
[6] Diaz, R. I., & Cabrera, D. D. (1997). Safety climate and attitude as evaluation measures of organizational safety. Accident Analysis and Prevention, 29(5), 643– 650.Donald, I., & Canter, D. (1994).
[7] Norusis, M. J. (1985). SPSSx: Advanced Statistic Guide. New York7 McGraw-Hill.
[8] Zohar, D., & Luria, G. (2003). The use of supervisory practices as leverage to improve safety behavior: A cross-level intervention model. Journal of Safety Research, 34, 567– 577.
[9] Carmines, E. G., & Zeller, R. A. (1979). Reliability and validity assessment. Newbury Park, CA: Sage Publications.
[10] Cronbach, L. J. (1951). Coefficient alpha and the internal structure of tests. Psychometrika, 16(4), 297-334.
[11] Flin, R., Mearns, K., O’Connor, P. & Bryden, R. (2000). Measuring safety climate: Identifying the common features. Safety Science, 34, 177-192.
[12] Cheyne, A., Cox, S., Oliver, A., & Tomas, J. M. (1998). Modelling safety climate in the prediction of level of safety activity. Work & Stress, 12, 255-271.
[13] Human Engineering Shore House. 2005. A review of safety culture and safety climate literature for the development of the safety culture inspection toolkit. Health and Safety Executive. Research report 367.
[14] Wiegmann, D.A., Zhang, H., Thaden, T.L.V., Sharma, G. & Mitchell, A.A. 2002. A synthesis of safety culture and safety climate research. Technical Report, University of Illinois ARL-02-3/FAA-02-2.
[15] Glendon, A.I., Litherland, D.K., 2001. Safety climate factors, group differences and safety behaviour in road construction. Safety Science 39, 157–188.
[17] Health and Safety Executive. (2002) Evaluating the Effectiveness of the Health and Safety Executive’s Health and Safety Climate Tool (No.
042). Norwich: Health and Safety Executive.
[18] Williamson, A., Feyer, A., Cairns, D. and Biancotti, D. (1997) ‘The development of a measure of safety climate: the role of safety perceptions and attitudes’, Safety Science, Vol. 25, No. 1, pp.15–27.
[19] Coyle, I., Sleeman, S. and Adams, D. (1995) ‘Safety climate’, Journal of Safety research, Vol. 22,No. 4, pp.247–254.
[20] Cheyne, A., Cox, S., Oliver, A. and Tomas, J.M. (1998) ‘Modelling safety climate in the prediction of levels of safety activity’, Work and Stress, Vol. 12, No. 3, pp.255–271.
[21] 21) Dingsdag, D., Biggs, H., Sheahan, V.L. & Cipolla, D.J. 2006. A construction safety competency framework: improving OH&S performance by creating and maintaining a safety culture. Cooperative Research Centre for Construction Innovation. Research report. pp 1-53.
[22] Fuller, C.W. & Vassie, F.H. 2001. Benchmarking the safety climates of employees and contractors working within a partnership arrangement a case study in the offshore oil industry. Benchmarking: An International Journal 8 (5): 413-430.
Appendix – 1
S.No Engineers Supervisors Workers
1 189 178 188
2 178 192 179
3 180 169 190
4 190 178 191
5 169 189 199
6 181 190 189
7 189 165 182
8 190 178 185
9 195 187 175
10 196 190 196
11 188 198 177
12 188 177 200
13 186 178 201
14 190 188 199
15 191 185 193
16 191 198 177
17 187 197 178
18 199 179 192
19 198 180 193
20 197 180 193
21 196 193 184
22 190 195 183
23 171 196 189
24 181 169 190
25 161 166 191
26 178 174 179
27 160 188 191
28 169 195 197
29 171 192 -
30 180 193 -
31 165 194 -
32 167 168 -
33 175 190 -
34 189 199 -
35 190 200 -
36 199 201 -
37 168 166 -
38 173 190 -
39 179 - -
40 183 - -