Peter M. Zasowski. Putting Museums on the Map: A Digital Humanities Project. A Master’s Paper for the M.S. in I.S. degree. March, 2012. 38 pages. Advisor: Ryan Shaw.
The Orange County Historical Museum, located in Hillsborough, North Carolina, sought to find a method of digitizing selected maps from its collection in a format that could also be used to display the maps for exhibition purposes. The purpose of this Master’s Project was to acquire digital surrogates of a small group of historical maps, geo-reference copies of these map images, and develop a digital humanities project that could be used as a research tool and augment the museum’s online presence. This process created files associated with each map that can be used to digitally layer the maps in software based on Geographic Information System (GIS) principles, such as Google Maps and the ArcGIS suite. This paper discusses relevant digital humanities theories and documents the design strategies and processes of the project.
Headings:
Digitization
Cultural property
Collection management (Museums)
Geographic information systems
by
Peter M. Zasowski
A Master’s paper submitted to the faculty of the School of Information and Library Science of the University of North Carolina at Chapel Hill
in partial fulfillment of the requirements for the degree of Master of Science in
Information Science.
Chapel Hill, North Carolina
March 2012
Approved by
_______________________________________
Table of Contents
Introduction...2
A Working Definition of Digital Humanities...4
Project Review and Comparison...8
Purposes of Digital Humanities Projects...8
Hypercities...9
Driving Through Time...10
Methodology...14
Identifying the Outcomes...14
Strategizing...15
Rationalizing the Design...17
Geo-referencing and Image Editing...26
Recommendations and Reflections...33
Introduction
The phrase "digital humanities" has been used to describe a wide range of
concepts, fields, and approaches in academic scholarship. As such, there is no singular
comprehensive or concise definition. It is generally thought of as a combination of
humanistic scholarship and digital technologies, which can help develop a variety of
incarnations of so-called "digital humanities projects." These projects can take many
different shapes and formats in order to fulfill their specific functions, from databases of
audio content to multimedia presentations of famous works of art. When using a
geographic information system (usually abbreviated as GIS) with a digital humanities
project, the result of that work may be categorized as “historical GIS.” This label is
appropriate for the project described in this paper because it required spatial manipulation
of historical maps with GIS software, with a goal of developing a webpage or exhibition
display that juxtaposes historical information with modern GIS data.
I first got involved with the Orange County Historical Museum on a volunteer
basis, assisting with collections management. Through the course of various discussions
with the executive director, Brandie Fields, I discovered the museum’s map collection
and the fact that only one of the maps had been previously digitized. Ms. Fields and I
determined that it would be in the museum’s interests to undertake a project with the end
goals of digitizing maps for both the museum’s in-house use and website. The primary
historical maps in the museum’s map collection. My actions will allow the museum to
better utilize its holdings while considering the possibilities and issues of physical
preservation for the maps in the future. The secondary goal of this project was the
creation of a “combination of geospatial referencing and digitization of historic
documents [which] creates a visual database for study and research.”1
While the
museum’s administration intends primarily to use the results of this project for its own
purposes initially, it hopes that adding geo-referenced digital copies of historic maps to
its website would increase interest in the collections and provide additional value for
local researchers.2
1
Carolina Digital Library and Archives, “Introduction to Digital Humanities,” The University of North Carolina at Chapel Hill, http://docsouth.unc.edu/blueridgeparkway/education/intro_digital_humanities/ (accessed 29 March 2012).
A Working Definition of Digital Humanities
The idea of humanistic scholarship frequently struggles with determining what,
exactly, its subject matter is. In a 1967 address, Ronald Crane provides a list of topics
that are “ordinarily called humanistic—the languages, the literatures, music, the graphic
arts, philosophy, history.”3
In Crane’s view, humanities disciplines are those that study
humanity and its achievements. The field of history is concerned with the records and
artifacts of the past, maintaining evidence and documentation in order to study the actions
of humanity. In this respect, it is natural that history and geography can be tied together,
even without the use of technology. Historical maps reveal the contemporary social and
political situations of their time, and a solid understanding of geography is crucial for
historians as they examine the connections among places, people, and events. The study
of history requires the ability to make those connections across different times and
between different locations. By utilizing technology, this practice can take on new visual
formats in addition to representing a much larger amount of historical data.
For historical GIS projects, the scientific geography features of computer software
allow historical projects to realize “visualization functions of geospatial information”
within a particular historical context.4 As Martyn Jessop explains, geographic information
systems provide researchers with “the ability to analyse [sic] and display data . . . as well
3 Ronald Crane, “The Idea of the Humanities,” in The Idea of the Humanities, and Other Essays Critical
and Historical (Chicago: University of Chicago Press, 1967), 15.
4 The Arts and Humanities e-Science Support Centre, “‘Beyond GIS’: Geospatial resources and services for
as extending database functionality to the investigation of spatial relationships.”5
Jessop
also notes that GIS principles and technology require great amounts of interdisciplinary
and collaborative work, which may create difficulties in humanities research. However,
as the core concepts and methods of humanities and GIS-related fields continue to mesh
together, it is entirely possible that humanities scholarship will develop “a view of the
past that is highly experiential, providing a fusion of qualitative and quantitative
information” that is accessible to an audience wider and deeper than ever.6
Geographic
information sciences are capable of “integrating data and services from heterogeneous
sources into a uniform architecture, using new concepts and methods,” and such an
accomplishment would benefit both the GIS and the fields contributing the content.7
Considering the wide range of possibilities for the concept of digital humanities, it
is difficult to synthesize all of the available literature into one single definition. However,
for the purposes of this project, it is useful to lean on the work of Fred Gibbs, who
published a blog post of a collection of approximately 170 user-submitted definitions in
September 2011. Rather than providing his own definition, he instead asks his readers a
few questions that he suggests would help develop a better understanding of the field:
Are all of the definitions and their crucial qualities (community, communication, methodology, digitization, etc) worth equal emphasis? Are some more representative of “the field” as it is or as it should be? Perhaps the DH label has gotten enough traction within the broader community that the more pressing question is: what should NOT be included within the big tent of the digital
humanities?8
Gibbs analyzes the submissions, separates them into categories, and notes that a common
theme emerges: the description of digital humanities as an “application of technology to
5
Martyn Jessop, “The Inhibition of Geographical Information in Digital Humanities Scholarship,” Literary and Linguistic Computing 23, no. 1 (2008): 39.
6ibid., 48. 7
John P. Wilson and A. Stewart Fotheringham, eds., The Handbook of Geographic Information Science
(Malden, MA: Blackwell Publishing, 2008): 611.
8 Fred Gibbs, “Digital humanities definitions by type,” Historyproef, entry posted 5 September 2011,
humanities work.”9
While it should be noted that simply using technology to carry out
humanistic study does not necessarily qualify as digital humanities work, Gibbs also
suggests that scholars should be “technologically innovative [with respect to] the analog
humanities.”10
This is a crucial factor in the overall scope of historical GIS, and the
specific context of this project. Simply digitizing a map and displaying it on a website
does not qualify as digital humanities work; after adding the processes of geo-referencing
and designing a historical background and display for the maps, this task can more fully
be called a digital humanities project.
While the true meaning of digital humanities may be impossible to succinctly
determine, the purpose and implementation of the digital history project examined in this
paper fall in line with a description offered by William G. Thomas II. Thomas argues that
historical geographic information systems are central to an “emergent interdisciplinary
field in which computer-aided spatial analysis is applied to archaeology, history, law,
demographics, geography, environmental science, and other areas.”11
In the context of
digitizing and geo-referencing historical maps for the Orange County Historical Museum,
this definition highlights a number of important factors. First, the project itself is
interdisciplinary, drawing key concepts from geography, history, and computer science.
Additionally, while this project involves little “spatial analysis” in the sense of organizing
or visualizing large data sets, it would allow users to study and draw their own
conclusions from changes and shifts to the spatial landscape of the subject area. It also
9 Fred Gibbs, “Digital humanities definitions by type,” Historyproef, entry posted 5 September 2011,
http://historyproef.org/blog/teaching/digital-humanities-definitions-by-type/ (accessed 29 March 2012).
10
ibid.
11 William G. Thomas II, “Computing and the Historical Imagination,” in A Companion to the Digital
involves converting historical materials into digital formats that are more accessible for
future historical analysis. By applying computer-based geo-referencing processes to
historical maps, this project developed a functional and attractive digital humanities tool
Project Review and Comparison
Before I began to plan my project, it was helpful for me to explore the
possibilities (and realities) of historical GIS developments by reviewing similar projects.
Examining the methodologies and products of other digital geo-spatial websites allowed
me to start visualizing the eventual outcome of my work with the museum’s map
collections. Because of the nature of this project, I selected two websites in particular to
study. Hypercities, a collaborative effort from academic and public organizations,
provides its users with a “digital research and educational platform for exploring,
learning about, and interacting with the layered histories of city and global spaces.”12 The
second project, titled “Driving Through Time: The Digital Blue Ridge Parkway in North
Carolina,” presents blueprints and other maps used in the construction of the Blue Ridge
Parkway “by placing historical materials in their geographic context—placing time and
stories in space.”13
These two websites both use geo-referencing techniques to create
“layers” of maps in order to display historical maps and geo-spatial data. The final
products allow users to interact directly with historical maps in a setting that connects
history with modern-day geography.
12
“About,” Hypercities, http://hypercities.com/about/ (accessed 29 March 2012).
13 Carolina Digital Library and Archives, “Driving Through Time: The Digital Blue Ridge Parkway in
Hypercities
The Hypercities project (http://hypercities.com/) is fundamentally built on the
concept that “every past is a place.”14
In addition to the geo-spatial function itself, the
website also contains information about the project, contributing team institutions and
members, funding sponsors, and academic research information. The project is a
collaboration of effort from multiple universities and community organizations, primarily
based in Los Angeles and southern California. It is intended primarily to be an
educational tool for use in classrooms and the public sphere; the target audience is any
user who is “interested in exploring, creating, interpreting, and sharing the history of city
spaces.”15
In many cases, the maps and information are displayed simply in their
geo-referenced forms, with no interpretations or background information attached. Users can
choose to view data layers in two separate categories: layers relating to particular cities,
and layers relating to collections of events. The interface is well-polished, with an
adjustable timeline above the map frame and the full function range of the Google Maps
system. The “cities” option provides a lengthy list of cities with geo-referenced maps
dating back multiple centuries for each city. By choosing “collections,” users are able to
interact with a number of different features, ranging from featured collections to
information gathered for specific classes that used the site. Hypercities also includes the
option for users to upload their own geo-referenced maps and spatial data through a
somewhat complicated process that requires the user to follow very specific instructions
in order to ensure compatibility with the system. The public part of the project, though,
presents users with a highly-interactive method of learning about places and events
through historical geography and geographic information science.
As it relates to the map collection at the Orange County Historical Museum, the
Hypercities website represents a much wider scope and higher level of technology than
the museum hopes to achieve. The museum’s objective is simply to display the maps
with a brief historical description to assist visitors who may be unfamiliar with the map’s
content. In contrast, Hypercities’ interface seems to assume that the user already knows
what he or she is looking for – the search function is small and almost hidden away from
the focal point of the website, and the “Getting Started” page only contains an
eight-minute-long walkthrough video. Additionally, the individual city map collections are
presented as they are, with no historical interpretation. Overall, the Hypercities project
relies on strong technology and a deep pool of user submissions to present a
comprehensive platform for digital spatial history. In comparison, the project described in
this report focuses on a small collection of historical maps. However, examining and
exploring Hypercities helped me develop a better understanding of potential future
developments for the map collection of the Orange County Historical Museum – in time,
it may be possible to submit the entire series of Orange County maps to Hypercities itself.
Driving Through Time
For the second digital spatial history project under review, I chose Driving
Through Time: The Digital Blue Ridge Parkway in North Carolina (http://docsouth.unc.
In my position as a Research Assistant with The University of North Carolina at Chapel
Hill, I started working with this project in January 2011. Since then, my duties have
ranged from metadata and content description to geo-referencing and digital image
manipulation. Working with Driving Through Time introduced me to geo-referencing
and digital spatial history, as well as the requirements of maintaining such a project over
an extended period of time.
The purpose of the Driving Through Time website, as explained on its homepage,
is to allow visitors to “really understand the road’s history [and] see the situation on the
ground.”16
The website includes thousands of historical materials that were gathered with
the intent of “bring[ing] together for the first time a vast array of primary source
materials” including photographs, newspaper articles, maps, blueprint drawings, letters,
and oral histories.17 Additionally, in order to provide a more comprehensive view of the
Blue Ridge Parkway, the project focused on two other features. The geo-referenced maps
and blueprint drawings demonstrate alternate plans and changes made to the roadway
during the planning and building stages, and a collection of essays and digital exhibits
called “overlooks” delivers historical context and background information. An emphasis
was placed on geo-referencing for this project because one of the main goals was to allow
users to “gain insights about how plans for the Parkway evolved . . . and how the
Parkway landscape has changed over time.”18
16
Carolina Digital Library and Archives, “Driving Through Time: The Digital Blue Ridge Parkway in North Carolina,” The University of North Carolina at Chapel Hill, http://docsouth.unc.edu/blueridge parkway/ (accessed 29 March 2012).
17
Carolina Digital Library and Archives, “What’s Included,” The University of North Carolina at Chapel Hill, http://docsouth.unc.edu/blueridgeparkway/about/about_project/materials/ (accessed 29 March 2012).
18 Carolina Digital Library and Archives, “Interactive Maps,” The University of North Carolina at Chapel
Users to the website for this project may feel overwhelmed by the amount of
information that is available for them to browse and search. The majority of the historical
content lies in the photograph collection; nearly four thousand photographs have been
described and tagged with a wide range of subject, name, and geographic headings. For a
user seeking academic information about the history of the Parkway, the overlooks are
likely to provide the best results. With full citations and links to external sources and
images, the overlook materials represent a very strict definition of digital humanities –
the application and use of technology to display humanistic scholarship. Non-academic
visitors (for example, recent travelers on the Parkway itself) may struggle when searching
through the large photograph collection and academic narrative essays. For these users,
the interactive maps provide an attractive and interesting way to get involved with the
history of the Parkway. Some of the maps show small areas of land, while others
comprise entire sections of the road that may be several miles long.User satisfaction with
the Driving Through Time website depends on the purposes of the user’s visit, but
overall, the project presents a comprehensive historical picture supplemented by a vast
supply of source materials intended to describe the history of the Blue Ridge Parkway.
Working with this project provided me with a unique insight into the processes
and requirements of developing and maintaining a digital humanities project. Similar to
Hypercities, the Driving Through Time venture works on a large scale with thousands of
items and source materials. From examining the construction of these projects, I learned
some crucial lessons for the process of designing a digital humanities space. First and
foremost, the design process should constantly require the designer to visit and re-visit
interesting idea, it would have faltered without the contributions and continued attention
of users who want to geo-reference and publish their own content. Another important step
is the development of interpretive history content for the maps. As demonstrated by
Driving Through Time, simply displaying a historical blueprint or map over a current
map may look appealing, but the user needs the appropriately-named “overlooks” to truly
learn and understand the significance and context of the map. Overall, studying these two
projects greatly helped me understand the processes and purposes of designing and
creating a digital humanities project. By seeing other implementations of layered
historical maps and digital spatial history, I was able to develop my own interpretations
of the design process and figure out the strategies for planning and implementing my
Methodology
As the main contributor to this project, I was responsible for designing and
implementing the project in accordance with the goals agreed upon between Brandie
Fields, the executive director of the Orange County Historical Museum, and myself.
After determining the intended outcomes of the project, I began the phase of strategic
planning and exploring the ways in which this project would achieve the identified goals.
The next step was visualizing and imagining the final product and its potential uses, both
by the museum and by visitors. Finally, I obtained the necessary materials and created the
basic content for the project. The resulting files, designs, and documentation will be
provided to the museum for final approval by administrative officers.
Identifying the Outcomes
For this project, I intended to design a solution for a technical problem at the
Orange County Historical Museum that would involve an innovative but effective
representation of the theories and practices of information management and digital
humanities. Ms. Fields and the rest of the museum’s administrators identified two
particular problems that could be solved with one project: they sought to digitize specific
historical maps in order to improve the content of the museum’s digital collections and
research files, and they recognized that the museum’s website would benefit from
case; the museum’s only consistent access to flatbed scanning equipment involves a
device with maximum scanning dimensions of 8.5 by 11 inches, and the historical maps
used in this project all greatly exceeded those dimensions. After discussing possible
general strategies and ideas, Ms. Fields and I decided on two main outcomes. First,
specific maps in the museum’s collection would be scanned in multiple pieces and
digitally stitched together to the best of my ability. Following that, the resulting “whole”
map images would be geo-referenced using GIS software. The resulting GIS files would
be sent to the museum with my design plans for display as a digital humanities project.
Priority was placed on these goals in the order they were listed. Ms. Fields’
primary wish was to obtain high-quality digital surrogates of the maps for the museum’s
own collections. Along with these digital versions, she hoped to include the associated
geographic data files. Because these steps were necessary for the development of the
digital spatial history display, they were conducted simultaneously with the design
sketches.
Strategizing
As previously mentioned, the final outcome of this project is the creation of a
number of digital files containing historical maps and geographic referencing
information. These files will be used as tools for historical research and exhibit displays
at the museum’s physical location and eventually on the museum’s website. Historical
research will initially be limited to museum staff only; once the files are made available
display the geo-referenced files along with current maps as an exhibit for the museum’s
visitors as well.
The Orange County Historical Museum currently has three part-time employees.
In addition to Ms. Fields, two historical interpreters assist with managing the front desk,
following up on research requests, and general collections work. Each employee of the
museum is at least moderately technologically literate; the everyday tasks of working at
the museum require a certain level of technology use and familiarity. They are dedicated
to maintaining items and collections that provide information about the history and
background of Orange County, North Carolina. They expect that this project will provide
digital surrogates for some of the historical maps, in addition to the geographic
information that will allow them to utilize the digital maps when working on tasks
involving local research. The museum’s employees hope that, with an established system
for digitizing and geo-referencing, more maps from the museum’s collection can be
added in order to develop a comprehensive spatial-temporal view of Orange County.
The museum is located in Hillsborough, North Carolina, equidistant in the
eighty-mile distance between Greensboro and the state’s capital of Raleigh. Due to the populated
nature of the area, many of the museum’s visitors are local residents. A former director of
the museum, Darcie Martin, explained that the museum has struggled at times to connect
with certain local populations because of historical context – the museum’s current
building was originally constructed as the Confederate Memorial Library with financial
support from the Daughters of the Confederacy, and the building’s original name is still
engraved in the stone over the entryway. This reminder of the influence of the
attempts to reach out to local African-American communities.19 In this respect,
developing the museum’s website with interactive online exhibits would benefit many
users who may be subconsciously uncomfortable with the physical structure of the
building.
In response to the stated problems involving the physical vulnerability of
historical maps and the need to develop an online presence, my designed project solves
the latter by way of undertaking the former. In conjunction with Ms. Fields, it was
determined that I would assist with digitizing specific historical maps and then use the
resulting files to contribute digital history content to the website. This project will be
considered successful if the museum’s staff and visitors are able to interact with the final
product and use it to better understand the spatial history of Orange County, North
Carolina.
Rationalizing the Design
In the early stages of designing this project, I wanted to focus on as many
historical maps as possible, in order to create a large collection of geo-referenced images
for the museum. With more time and resources, I hoped to develop a more sophisticated
interface for the display of the geo-referenced maps on the museum’s website and in any
potential exhibits. Over the course of the design process, however, the realities of
working in a small institution began to affect the possible outcomes. In order to make the
geo-referenced collection both usable and appealing, I was forced to limit the scope of
the project to a smaller number of maps, which in turn affected the plans of the digital
history webpage I designed to accompany the geo-referenced files. This webpage is only
my recommendation for the display of these materials, and the final decision rests with
the administration of the Orange County Historical Museum.
One of the key concepts that guided my design process was usability and
functionality. In order for this project to provide any lasting value – not to mention the
prospect of expansion – the files and designs needed to be accessible in a variety of
different ways. To this end, I used a free digital image editor to manage the scanned map
images, working solely with common image formats. The formats themselves were
chosen to ensure high-quality images that could also be quickly processed during
geo-referencing. Due to the highly specialized nature of GIS software, I was unable to use a
free geo-referencing tool; however, those interested in developing similar projects may
well consider the importance of utilizing a well-known and respected software suite to
perform such an intricate task. While the “workspace” file for this program is proprietary,
I maintained my original file-format scheme for the final geo-referenced maps for the
sake of continuity.
The specific design of the digital history webpage was created with the intent of
providing information to its viewers, while also being easily scalable in case of future
additions. The initial design plan, shown as Figure 1 below, involved one single image
viewer with a list of available maps that could be chosen as layers over a current map or
satellite imagery. This plan reflected the influence of the Hypercities project, showing a
series of maps together on one screen so that users can view the changes and shifts to
cities and landscapes over time – effectively creating interactive spatial history. Below
background, which would be provided by the combined research efforts of the museum
staff and me. Only maps that were chosen as layers would have their corresponding text
descriptions appear on the page. However, over the course of the project, I altered the
design in response to limitations on the project, most notably in regards to time,
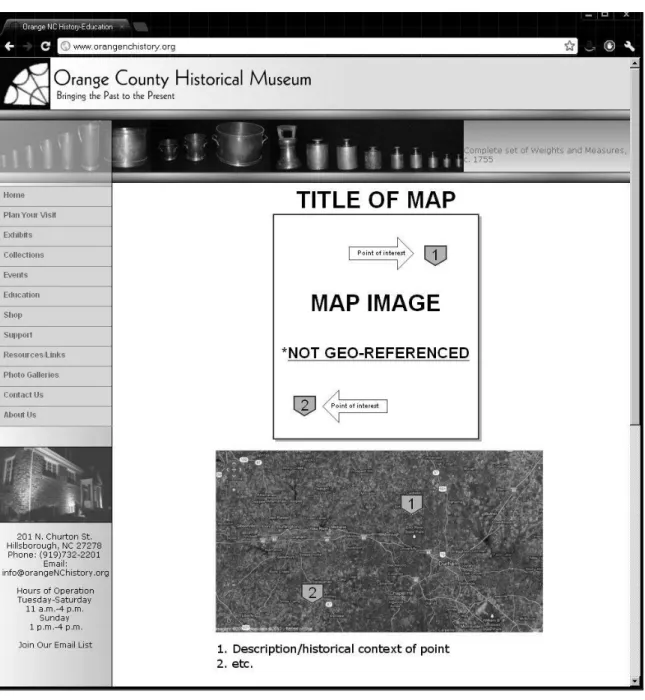
The subsequent design plans involved a thumbnail image of the geo-referenced
map file, located above an in-set frame of a map viewer such as Google Maps. As
demonstrated in Figure 2 on the following page, the design required that the individual
maps be separated. When clicked, the thumbnail image would open to a full-sized view
of the full-quality image file. Using the image editor and features provided by the map
service, placemarkers would be added to the image and map frame, corresponding with
each other. Below the map, a text list would provide historical context and descriptions of
that page’s map. This design effectively incorporates all the desired elements of the
project, but could be considered unwieldy or difficult for users because of its lengthy
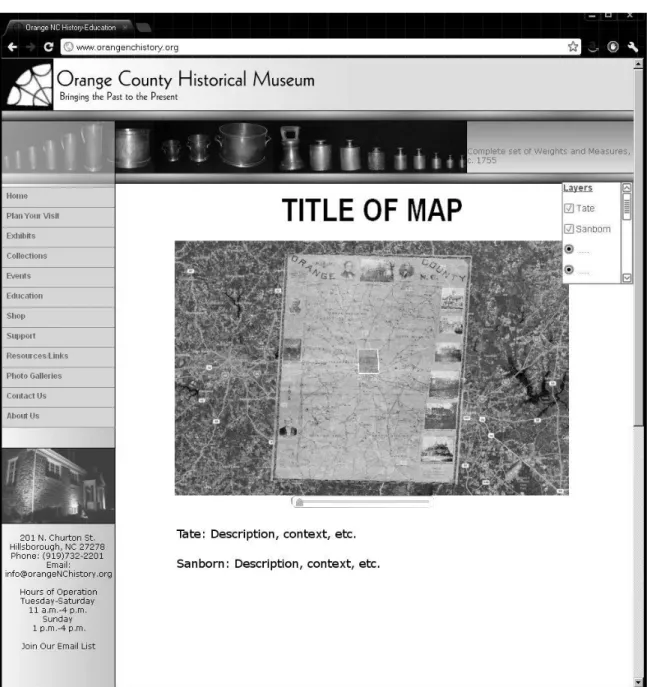
To reduce size and potentially increase usability, I adapted the last design from
the website of Driving Through Time: The Digital Blue Ridge Parkway in North
Carolina. This design, shown in Figure 3 on the next page, would display the map as a
layer on a Google Maps inset, allowing users to view the map directly over current
cartography. A transparency slider would increase or decrease the transparency of the
map image, so users could explore the differences between the historic and current maps.
Below the image and map inset would be a section of text providing historic context. This
design presents an integrated view of the historical map and current imagery, but in
contrast to the initial design, it requires each map to be hosted on a separate webpage.
Because the current collection of digitized and geo-referenced maps is small, this design
is feasible and practical. The largest potential problem for choosing this design is its lack
of scalability. As seen with the Hypercities project, it is frequently most useful to
compare maps within one window; separating each map onto different pages not only
creates awkward interactions for users, but also requires a larger amount of server space
The three designs that were visualized for this project are all desirable and
undesirable in certain ways. The first idea, influenced by Hypercities, would provide the
most user-friendly experience but is technologically impractical (at this point) and may
not be useful for a small collection of maps. The second design is lengthy and would
force the user to continually shift his or her attention between the map image and a base
map; however, it is the simplest design and most practical to implement immediately.
The third design would include all of the historical information and context within one
frame on the page, but each map would be hosted on a separate page, and it is not certain
if the technological capability exists to implement this at the museum at this time.
However, all three designs will be presented to the museum’s administration, and I will
continue to be involved in developing the best interface for the display of these maps.
A crucial component of this project is determining its place within the realm of
digital humanities. To this end, the maps will be presented as part of a larger (and
hopefully growing) collection of historical maps held at the Orange County Historical
Museum which will eventually be added to the geo-referenced collection. With the maps
being displayed in an innovative form (either on-site at the museum or online at the
museum’s website) along with historical explanations and interpretation, the overall
scope of the project falls under the scope of digital humanities because it allows users to
visualize and comprehend the spatial and historical shifts within Orange County over the
Geo-Referencing and Image Editing
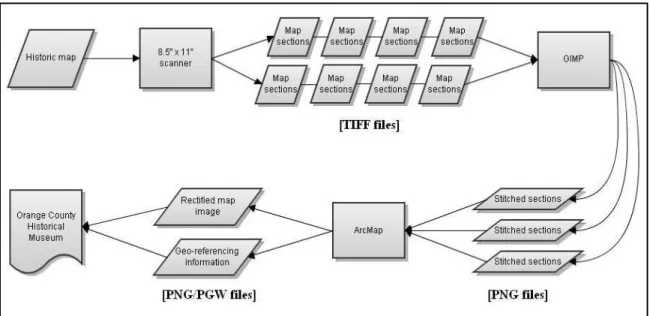
Figure 4: Workflow
The actual process of working with the maps and digital files in order to create
this project followed a fairly straightforward path, as demonstrated by Figure 4 above.
After developing the initial design plan, I acquired the software components. For working
with digital images, I used GIMP (GNU Image Manipulation Program), which is an
image editing program that is free and follows open source principles.20 Among other
features, one important functionality offered by GIMP is its support of transparent
backgrounds, which is important when stitching multiple images together. For the
geo-referencing and rectifying process, I received a license and hard copy of the software for
the ArcGIS 10 Suite. The act of geo-referencing only took place using ArcMap 10, but
that program relies on other parts of the suite to operate on a number of levels, so it is
preferable to acquire the entire package of programs. Once I had obtained the necessary
20 “GNU General Public License,” Free Software Foundation, http://www.gimp.org/about/COPYING
digital images – in the form of high-quality TIFF scans – I converted copies of the files
into the PNG format, thus retaining the original images while creating smaller files which
would reduce the required time to geo-reference. Due to the physical size of the maps and
the size limitations imposed by the museum’s scanning equipment, the majority of the
maps were scanned in separate sections. One map, a comprehensive view of Orange
County that was created in 1891, had already been digitized in previous years; the
museum provided me with the CD-ROM containing the files.
To stitch the map section images together, I used GIMP to create a new image
with a transparent background and dimensions large enough to accommodate all of the
files. I opened the first three map files, which constituted the top third of the map, copied
the files, and pasted them individually into the new image. I then carefully moved each
image into place, overlapping and lining up important features so that the final image
would appear as seamless as possible. However, when I started attempting to add the
second row of images, I ran into a small problem – because of the physical scanning
process, some of the individual map sections had minor but important differences in size
and scale. This meant that the sections would not line up seamlessly in GIMP, so I
re-evaluated my process. I decided to stitch each row together to create separate images,
each containing connecting maps of similar scales. This made it easier for me to match
certain reference points between maps when geo-referencing; by adding reference points
on the edges of the rows, I was able to create a more precise referential image for the
overall view of the map. Figure 5 on the following page shows a view of the process of
Figure 5: Editing with GIMP
Once I had created the separate rows of the map images, I opened a new
document in ArcMap 10 and used the “Add Basemap” feature to lay out map imagery as
a background layer. Because geo-referencing involves connecting points on an image to
their corresponding location, ArcGIS offers different styles of base maps ranging from
street-level to topographic. For the historical maps selected by the museum for this
project, a hybrid map of satellite and map imagery provided the best reference
background. Geo-referencing in ArcMap requires that the user first select a reference
point on the image, and then locate its corresponding location on the base map. As
previously mentioned, having the maps divided into separate sections greatly streamlined
the process. When geo-referencing one image, it is typical to place reference points on
the outside of the image, which forces the interior content of the map to line up according
to those points. However, if the map is improperly aligned (for example, if the map
it would be exceedingly difficult to “stretch” the map to properly reference it. By
separating the map into distinct sections, I was able to produce a more accurate
geo-referenced image. The following screenshot was taken during the geo-referencing process
of the first stitched map section.
Figure 6: Beginning the geo-referencing process
Another important step throughout the geo-referencing process is the security of
geo-referenced points. Because geo-referencing can be an arduous process, frequently
taking hours and days at a time, it is highly advisable to save the locations of the
reference points periodically. In ArcMap, this is easily done by accessing the Link Table
feature and saving the information as a text file (*.txt). In case of a power outage or
accidental computer shutdown – or if the user simply wants to restart the referencing
process without removing other images or starting over from the beginning – the text file
Once all of the map images had been referenced, I used ArcMap’s export function
to create a new PNG image file with a transparent background, along with an associated
PGW “world file.” In order for the museum to utilize the geographic information, these
two files will remain together; whenever one file is moved to a different location, the
other will be moved with it. This is because any GIS software that opens the PNG image
will also need the metadata stored in the PGW file to correctly locate the map. The image
file itself can still be opened on its own. In fact, if it is opened by a regular
image-viewing program, the image will appear warped and stretched as if it was overlaid on a
map already, but if the software does not read geo-referencing information, the program
will only display the image over a transparent background. The following two figures
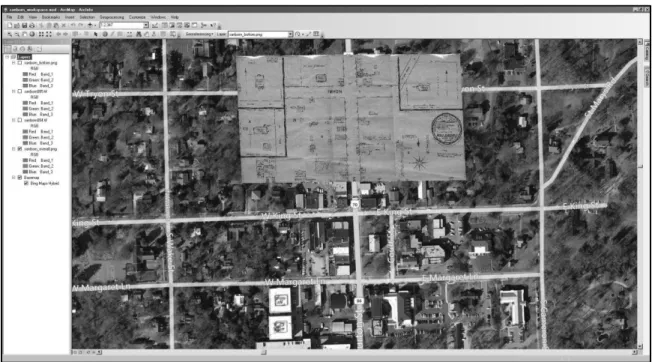
show different views of the geo-referencing process. In Figure 7, the map image has been
faded by 20% in order to see both the historic features on the map and the current map
features on the base map. Figure 8 demonstrates the final view of a geo-referenced map
Figure 7: Transparent overlays
In this workflow, the main files that are necessary to retain after geo-referencing
are the final PNG and PGW files. Those two files contain all of the necessary information
for the technical development of the digital history display laid out as a desired outcome
for this project. The PNG image file acts as a high-quality digital representation of the
original historical map, and the PGW file exists alongside it whenever the
geo-referencing information is needed. The original scanned files, the ArcMap workspace
file, and any associated files can be deleted because they no longer contain useful
information or data.21 Keeping these superfluous files could cause institutions to utilize
far more digital storage space than necessary – for one of the selected maps from the
Orange County Historical Museum, the final PNG and PGW combined to require
approximately one-sixth of the storage space than the total of the extra files.
21 ArcMap creates new files during the geo-referencing process that store information and metadata about
Reflections and Recommendations
The process of designing and implementing a digital humanities project forces the
designer to ask difficult questions and find difficult answers. When I first started
conceptualizing the project, it was very similar to the structure of the Carolina Digital
Library and Archives’ project about the Blue Ridge Parkway – my work with that project
had already made its influence felt. However, after discussions with the director of the
Orange County Historical Museum, the project began to take a different shape, in
accordance with the wishes of the director and my own capabilities. Over time, I was able
to better determine the actual direction of the project, along the lines laid out by the
director and in fulfillment of the goals I hoped to achieve.
One of the most significant challenges for me, as the designer and architect, was
to be realistic about the expectations for myself and the outcomes. As I reviewed the
literature and explored other projects, I began to feel overwhelmed by the potential scope
of a digital humanities project. When I began actually working on it, though, the
processes of scanning and working with the images was much easier than I had imagined.
As with other ventures, most of the preparation for designing and creating this type of
project was mental: visualizing the eventual outcome, imagining potential user
interactions, and strategizing the best ways to achieve the goals I had been assigned.
Finally, I learned some important factors to consider when working with projects
rigorous research to determine the best choice. While cost may sometimes prohibit
smaller institutions from purchasing licenses or particular programs, there are frequently
similar options available for lower costs or even as open-source software. Additionally, if
purchasing expensive equipment or software is unavoidable, it may be possible to
collaborate with local universities or other institutions to share the financial burden.
From a design perspective, the most significant shift in my approach was the
extent to which I needed to continually re-visit my plans and consider the scope and
audience. While the initial scope was determined by the museum’s director, my task of
designing the digital spatial history webpage forced me to reflect on the actual content
that would be presented. I also found my creative design restricted by technology and my
own resources. With more time, financial support, and technological capability, this
project could expand and provide a more comprehensive spatial-temporal view of Orange
County. Until then, the geo-referenced map collection of the Orange County Historical
Bibliography
Arts and Humanities e-Science Support Centre. “‘Beyond GIS’: Geospatial resources and
services for scholars in the humanities.” http://www.arts-humanities.net/
briefingpaper/beyond_gis_geospatial_resources_services_scholars_humanities
(accessed 29 March 2012).
Beyer, Hugh, and Karen Holtzblatt. Contextual Design. San Diego: Morgan Kaufmann
Publishers, 1998.
Carolina Digital Library and Archives. “Driving Through Time: The Digital Blue Ridge
Parkway in North Carolina.” The University of North Carolina at Chapel Hill.
http://docsouth.unc.edu/blueridge parkway/ (accessed 29 March 2012).
Cohen, Daniel J., Michael Frisch, Patrick Gallagher, Steven Mintz, Kirsten Sword, Amy
M. Taylor, William G. Thomas III, and William J. Turkel. “Interchange: The
Promise of Digital History.” The Journal of American History 95, no 2
(September 2008): 442-451.
Crane, Ronald. “The Idea of the Humanities.” In The Idea of the Humanities, and Other
Essays Critical and Historical. Chicago: University of Chicago Press, 1967, 3-15.
Finley, M.I. “Myth, Memory, and History.” History and Theory 4, no. 3 (1965): 281-302.
Free Software Foundation. “GNU General Public License.” http://www.gimp.org/about
Gibbs, Fred. “Digital humanities definitions by type.” Historyproef, entry posted 5
September 2011.
http://historyproef.org/blog/teaching/digital-humanities-definitions-by-type/ (accessed 29 March 2012).
Hill, Linda L. Georeferencing: The Geographic Associations of Information. Cambridge,
MA: MIT Press, 2006.
“Hypercities.” http://hypercities.com (accessed 29 March 2012).
Jessop, Martyn. “The Inhibition of Geographic Information in Digital Humanities
Scholarship.” Literary and Linguistic Computing 23, no. 1 (April 2008): 39-50.
Pitti, Daniel V. “Designing Sustainable Projects and Publications.” In The Companion to
Digital Humanities, edited by Susan Schreibman, Ray Siemens, and John
Unsworth (Oxford: Blackwell Publishing, 2004). http://www.digitalhumanities
.org/companion/ (accessed 29 March 2012).
Thomas, William G. II. “Computing and the Historical Imagination.” In The Companion
to Digital Humanities, edited by Susan Schreibman, Ray Siemens, and John
Unsworth (Oxford: Blackwell Publishing, 2004). http://www.digitalhumanities
.org/companion/ (accessed 29 March 2012).
Warwick, Claire, Melissa Terras, Paul Huntington, and Nikoleta Pappa. “If You Build It
Will They Come? The LAIRAH Study: Quantifying the Use of Online Resources
in the Arts and Humanities through Statistical Analysis of User Log Data.”
Literary and Linguistic Computing 23, no. 1 (April 2008): 85-102.
Wilson, John P., and A. Stewart Fotheringham, eds. The Handbook of Geographic