A multi objective mixed integer programming model for design of
a sustainable meat supply chain network
Fatemeh Ghasemian Zarini
1, Nikbakhsh Javadian
1*1Department of industrial engineering, Mazandaran University of Science and Technology, Babol, Iran
[email protected], [email protected]
Abstract
In the recent decades, rapid population growth has led to the significant increase in food demand. Food supply chain has always been one of the most important and challenging management issues. Product with short age, especially foodstuffs, is the most problematic challenges for supply chain management. These challenges are mainly due to the diversity in the number of these goods, the special need for tracking the flow of goods in the supply chain and the short age of products. Designing an appropriate supply chain network for the organization will increase profitability as well as customer satisfaction. It also helps organizations to achieve competitive advantage in market. In this research, a multi-objective planning model is presented in order to design a sustainable supply chain network. The first objective function minimizes costs, the second objective function minimizes network environmental impacts, the third objective function optimizes the productivity of facilities and the fourth objective function optimizes network social impacts. In this research, in order to deal with uncertainty, the robust optimization approach is implemented. Multi-criteria decision-making methods are also used to solve the multi-objective model.
Keywords:
Supply chain management, sustainable supply chain, multi objective, robust optimization1-Introduction
Today, due to the population growth, changes in general food needs and enhanced economic income, food consumption has increased dramatically. This increase in food consumption has led to increase in demand for food production and distribution and as a result serious economic, social and environmental problems in the whole world. On the other hand, continuous and significant changes in the quality of food products throughout the supply chain have made food supply chain different from other supply chains. It is obvious and understandable that consumers prefer to use the fresh products with a reasonable price, but the high vulnerability of food products lead to a lot of food waste. Today, the growth of food demand, environmental degradation and the lack of resources in developing countries have encouraged decision makers to consider economic and environmental aspects in addition to social aspects in designing a food supply chain network.
*Corresponding author
ISSN: 1735-8272, Copyright c 2020 JISE. All rights reserved Journal of Industrial and Systems Engineering
Vol. 13, Special issue: 16th International Industrial Engineering Conference Winter (January) 2020, pp. 78-92
(IIEC 2020)
TEHRAN, IRAN
22-23 January 2020
79
Therefore, the sustainability of food supply chains and their network design have recently attracted the attention of most consumers, enterprises, governmental agencies and universities. Moheb Alizadeh et al. (2020) presented a multi-objective mixed integer linear programming model to design a green meat supply chain network in Canada. The proposed network was multi-product, multi-period and multi-level. The goal of this network was minimizing the total cost and the total amount of carbon dioxide emissions released from the transportation process, as well as maximizing the effectiveness of the total facility capacity to increase network efficiency. Augmented constraint approach is used to solve the proposed model.
Aras et al. (2018) conducted a study entitled "Designing a robust supply chain network with multi-products for a company in the food sector". In this paper, a multi-stage supply chain network model with multi-products is designed to minimize the total cost of various components. Vafaee et al. (2020) designed a sustainable multi-channel supply chain distribution network in Digikala Company. For this purpose, a mixed integer linear programming model with product, level, and multi-transportation mode has been proposed. The goals of the proposed model were: )1) minimizing the cost of transportation, purchasing vehicles and warehouses, )2) minimizing the amount of carbon dioxide released by vehicles and warehouses, and ) 3) maximizing job opportunities. In order to solve the problems, after modelling, the Goal Programming approach and Gomez software have been used. Ghezavati et al. (2017) designed a perishable food products supply chain network for the tomato industry in Iran. This network aimed to distribute these products with regard to postharvest biological behaviours. A multi-period multi-level mixed integer linear programming model was presented with the objective of maximizing the profit of product distribution. In order to solve the model in large dimensions, Benders’ decomposition algorithm has been used. Mogale et al. (2019) designed a food supply chain network. The proposed network consisted of supply centres, central warehouses, state and regional warehouses and reasonable priced stores in India. This paper aimed to minimize the total costs and emission of carbon dioxide, simultaneously. This research considered a level, multi-period, multi-transportation mode, multi-distribution, multi-vehicle problem with heterogeneous capacity. Finally, a number of real samples were solved using Parto-based MOPSO and NSGA-II algorithms. Cruz et al. (2019) designed an Agri-food supply chain network in Netherlands. In this regard, a mixed integer linear programming model (MILP) has been proposed with the aim of maximizing to support agricultural food supply chain planning (AFSC). In this study, uncertainty in supply and demand was considered using a random scenario tree. Soysal et al. (2014) presented a multi-objective mixed integer linear programming (MOMILP) model to examine an international beef
supply chain network in Brazil. Model objectives include (1) minimizing total logistics costs and (2) minimizing total greenhouse gas emissions from transportation operations. Finally, the ε-constraint method was used to solve the problem. Mohammad et al. (2017) proposed a fuzzy multi-objective programming model (FMOPM) for a meat supply chain network. In this case, the costs of transportation and operations, demand and facilities capacity level were considered under uncertainty. The objectives of this model include 1) minimizing the total cost of transportation and operations, 2) minimizing carbon emissions by transportation 3) minimizing the time of products distribution and 4) maximizing the product delivery service satisfaction. To solve this problem, LP-metrics approach, ε-constraint method and goal programming approach have been used. Bottani et al. (2019) used a multi-objective linear programming model to design a resilient multi-product supply chain network for tomato sauce manufacturing industry and to deal with demand unexpected fluctuations and disruption of raw material supply. The objectives of the proposed model include maximizing network profits as well as minimizing product delivery time. In order to solve this model, Ant Colony Optimization algorithm (ACO) has been used. Mousavi and Bozorgi Amiri (2017) designed a perishable food supply chain network by presenting a sustainable multi-objective location-allocation scheduling model. A mixed integer linear programming model was presented with the aim of minimizing the cost of transportation, improving the quality of food at the time of delivery, and decreasing the amount of carbon emissions by transportation to stabilize the process. Mohammadi et al. (2020) designed a sustainable supply chain network in the food industry by considering direct and indirect transportation with the goal of maximizing network profit and job opportunities, as well as minimizing carbon emissions and waste water in the manufacturing sector. The network was multi-period, multi-product, multi-level and multi-transportation mode. This network consisted of supplier, manufacturer,
80
distributor and retailer. Finally, the ε-constraint approach was used to solve the problem. Bortolini et al. (2018) designed a fresh food supply chain network with reusable and disposable packages in Italy. The goals of this multi-product, multi-period and multi-transportation mode supply chain network were minimizing the total cost of the network and the amount of pollution emissions. In order to solve the problem, AMPL (A Mathematical Programming Language) and Gurobi optimization approach were applied.Validi et al. (2014) analysed the sustainable food supply chain distribution system (milk distribution) in Ireland with the aim of minimizing the emission of carbon dioxide from the transportation process and the total cost of the network. A robust solution has been used to design a distribution network under capacity constraints for a two-layer supply chain. The TOPSIS approach has also been used to rank the actual possible transport routes. Zhang et al. (2019) designed a robust multi-objective fuzzy closed loop supply chain network under uncertainty conditions which included three sustainability dimensions. The objectives of this paper include of minimize total costs and carbon emissions and maximize social impact. This network was able to keep the balance between several conflicting goals. Also, the uncertainty of the parameters was divided into two categories: the first category was lost working days that was related to the social effects and was solved by fuzzy set and membership theory. The second category was demand and reproduction rate which has been investigated by a robust optimization method. To validate the model efficiency and the solution approach, a numerical example was solved using the Simplex approach.
Arampantzi and Minis (2017) in a study proposed a new mixed integer linear programming model to examine the role of sustainability in supply chain network design. The goal of this model was minimizing the operation costs, investment costs and greenhouse gas emissions. The environmental goal of this model was to reduce the amount of waste emitted in the supply chain. The social goal considered job opportunities, prioritizing the social community development and improving working conditions. Goal programming approach and ε-constraint method were used to solve the proposed model in order to achieve Optimal Pareto among the three objectives
Yun et al. (2019) in their study proposed a sustainable supply chain model with various distribution channels. The model was proposed to provide the following goals, (1) minimizing the total cost as an economic issue, (2) minimizing the total amount of carbon emissions as an environmental issue, and (3) maximizing the social effects as a social issue. Three various distribution channels were also considered in this model; (1) natural delivery, (2) direct delivery and (3) direct shipment. A mathematical formula has been proposed for designing the sustainable supply chain model and was implemented using a hybrid genetic algorithm (pro-HGA) method. The results showed the proper performance of the proposed algorithm. In this section related studies in the field of meat supply chain were reviewed. In the next sections, the proposed mathematical model and the solution method are presented. Also, the computational results obtained from the solution of the model are discussed and at the end, conclusions and future suggestions are presented.
2-Problem definition
The present study investigates a multi-period supply chain network with the aim of minimizing costs, reducing environmental impacts, maximizing productivity and optimizing social impacts. Network costs include purchasing costs, fixed costs and transportation costs. The facilities of the designed network in this supply chain include farms, abattoirs, retailers and customers (figure 1). In this network, farms are places in which different types of animals are kept and abattoirs are places in which animals are slaughtered and packaged as processed meat. Then, the meat will be transferred to retailers who are responsible for selling and transferring it to the demand area and customers.
81
Farms abattoirs retailers customers
Fig.1 The proposed meat supply chain network
2-1- Assumption
Demand is under uncertainty.
Transportation costs are under uncertainty.
This research is conducted under the box uncertainty. The capacity of farms, abattoirs and retailers is calculated. The model is considered to be multi-period.
Due to above definitions, the research problem can be formulated as follows:
2-2- Sets
F: set of potential farm locations A: set of potential abattoir locations R: set of potential retailer locations
C
: set of customersJ
: set of products j including livestock and meat T: set of time periods2-3- Parameters
fjt
P : purchasing cost per ton of livestock j from farm f in period t f
n : Fixed-cost of working with farm f a
b
: Fixed-cost for opening abattoir a re
: Fixed-cost for selling products via retailer r fade : Transportation distance (mile) from farm f to abattoir a ar
ge
: Transportation distance (mile) from abattoir a to retailer r rche
: Transportation distance (mile) from retailer r to customer c fajtkc : Unit transportation cost per mile for livestock j from farm f to abattoir a in period t arjt
lc : Unit transportation cost per mile for processed meat j from abattoir a to retailer r in period t rcjt
mc : Unit transportation cost per mile for meat j from retailer r to customer c in period t cjt
d : Demand (ton) of customer c for meat j in period t fj
x : Maximum supply capacity (ton) of farm f for livestock j aj
O : Maximum supply capacity (ton) of abattoir a for processed meat j rj
u : Maximum supply capacity (ton) of retailer r for meat j
: CO2 emission factor per ton and per milef
82 a
: Percentage of decrease in capacity of abattoirs r
: Percentage of decrease in capacity of farm retailers JEJ
: Amount of product j obtained from livestock jw : Weight (ton) of product j including livestock and meat F
f
Fj
: The number of fixed job opportunities created by farm f Rr
Fj : The number of fixed job opportunities created by retailer r A
a
Fj : The number of fixed job opportunities created by abattoirs a F
f
Vj
: The number of variable job opportunities created through working of farm f Rr
Vj : The number of variable job opportunities created through working of retailer r A
a
Vj : The number of variable job opportunities created through working of abattoirs a F
fjt
Vl
: The loss of days caused work’s damages during farm f RRJ
Vl : The loss of days caused work’s damages during retailer r A
AJ
Vl : The loss of days caused work’s damages during abattoirs a
E
LAndE
D: The weights given to the elements of social impacts objective related job opportunities, and worker’s lost days, respectively.2-4- Decision variables
fajt
QU : Quantity of livestock j (ton) transported from farm f to abattoir a in period t arjt
QN : Quantity of processed meat j (ton) transported from abattoir a to retailer r in period t rcjt
QA : Quantity of meat j (ton) transported from retailer r to customer c in period t f
Z : Binary variable, equals to 1 if farm f is selected, 0 otherwise. a
I
: Binary variable, equals to 1 if abattoir a is open, 0 otherwise.Y
r: Binary variable, equals to 1 if retailer r is selected, 0 otherwise.2-5- Mathematical model
1
min
*
*
*
*
*
*
*
*
*
fjt fajt fa fajt arjt ar arjt
f a j t a r j t
rcjt rc rcjt f f a a r r
r c j t f a r
z
p
kc
de
QU
lc
ge
QN
mc
he
QA
n
Z
b
I
e
Y
(1)
2
min j* fa* fajt j* ar* arjt j* rc* rcjt
f a j t a r j t r c j t
Z w de QU w ge QN w he QA
(2)
3
max
fajt/
fj arjt/
aj rcjt/
rjf a j t a r j t r c j t
Z
QU
x
QN
o
QA
u
(3)4
max
Z
E
L(
Z
'
Z
'')
E
D(
Z
''')
(4)' 4
1 1 1
. . .
F A R
F A R
f f a a r r
f a r
Z Fj Z Fj I Fj Y
(4-1)'' 4
1 1 1 1 1 1 1 1 1
( / ) ( / ) ( / )
F J A A J R R J C
F A R
f fajt f a arjt a r rcjt r
f j a a j r r j c
Z Vj QU Cap Vj QN Cap Vj QA Cap
83
''' 4
1 1 1 1 1 1 1 1 1
( / ) ( / ) ( / )
F J A A J R R J C
F A R
fjt fajt f AJ arjt a RJ rcjt r
f j a a j r r j c
Z Vl QU Cap Vl QN Cap Vl QA Cap
(4-3)
Subject to:
.
(1
).
fajt f f fj
a j j
QU
Z
x
f t, (5).
(1
).
arjt a a j
r j j
QN
I
o
a t, (6).
(1
).
rcjt r r rj
c j j
QA
Y
u
r t, (7)fajt arjt
f r
QU QN
a j t, , (8)arjt rcjt
a c
QN QA
r j t, , (9)/
fajt arjt j
f r
QU QN EJ
a j, (10)rcjt cjt r
QA d
c j t, , (11)
,
,
0,1
f a rZ
I Y
f a r, , (12),
,
0
fajt arjt rcjt
QU
QN
QA
f a r c j t, , , , , (13)According to the definitions given above, the multi-objective mathematical planning model is formulated as follows. Equation (1) is the economic objective function which minimizes total costs (both fixed costs and variable costs). Equation (2) deals with the environmental impacts of the issue and minimizes the amount of 𝐶𝑂2 gas released by supply chain transportation. Equation (3) is the third objective function which maximizes the efficiency of capacity and facilities. Equation (4) is the objective function of social impacts which optimizes the social aspects of the proposed model includes the weight of job opportunities and the days lost by the workers, respectively. Equations (4-1) and (4-2) consider fixed and variable job opportunities for the supply chain network and equation (4-3) considers the lost working days during the process of production and distribution.
Constraints (5), (6), and (7) are determined based on the capacity constraints of farms, abattoirs, and retailers, respectively. Constraints (8) and (9) indicate input meat and output meat, which must be equal in each slaughterhouse and each retail store, respectively. Constraint (10) is the amount of livestock required for demand and (11) is related to customer satisfaction with regard to the demand. Finally, constraints (12) and (13) define binary variables and non-negative variables.
3-Robust optimization
Robustoptimization is one of the new methods in mathematical planning that has attracted the attention of many researchers. Robust optimization is a response to uncertainty of input data and enables decision makers to act in accordance with their level of risk-taking and risk-aversion. This approach ultimately leads to a series of responses that are significantly less sensitive to input data uncertainty. The goal of robustoptimization is selecting an answer that is able to overcome data uncertainty in the best possible way. Uncertain data are assumed to be unknown but bounded. Also, in most current researches, the uncertainty space is assumed to be convex. In this approach, optimization with uncertain parameters is transformed into robust optimization. Also, robustoptimization does not need any information about the probability distribution of uncertain data. Robust optimization basically ensures stability and flexibility by making an optimal issue mandatory for the entire given uncertainty space.
84
addressed using a robust optimization approach. According to the following linear programming
𝑀𝑖𝑛 Z: ny+ d s.t: hx ≤b
The issue of uncertain linear programming is defined as follows: Min Z: ny+ d
s.t: hx ≤ b (14)
𝑛, 𝑑, ℎ, 𝑏 ∈ 𝑈
In this model, the parameters n, d, h, b is in the uncertainty set U. X-vector is the robust answer to the problem if it meets all the constraints of the uncertainty set U. Ben-Tal defines the robust state of the above issue as follows:
min{𝑐̂𝑥 = 𝑠𝑢𝑝𝑛,𝑑,ℎ,𝑏∈𝑈[𝑛𝑦 + 𝑑𝑥]: ℎ𝑥 ≤ 𝑏 ∀𝑛, 𝑑, ℎ, 𝑏} (15) n is the set of objective function coefficients and y is the vector of zero-one variables (binary variables). Also, x is the vector of decision variables. The optimal answer to (15) is the robust optimal answer to (14). Finally, according to Pishvaee et al. (2017)the robust model is as follows:
min
:
*
(
*
*
)
(
*
*
)
*
*
*
*
*
kc kc
fajt
fit fajt fajt fa fajt fajt
f a j t f a j t
lc mc
arjt ar arjt rc rcjt rcjt
a r j t r c j t
f f a a r r
f a r
Z
P
Qu
kc
de
Qu
lc QN
ge
mc he
QA
n
z
b
I
e
y
Z
(16)
.
c kc
c
G
fajtQu
fajt fajt
f a j t, , , (17).
c kc
c
G
fajtQu
fajt farjt
f a j t, , , (18).
c lc
c
G
arjtQN
arjt arjt
a r j t, , , (19).
c lc
c
G
arjtQN
arjt arjt
a r j t, , , (20).
c mc
c
G
rcjtQA
rcjt rcjt
r c j t, , , (21).
c mc
c
G
rcjtQA
rcjt rcjt
r c j t, , , (22)d cjt
rcjt d cjt
QA
d
G
c j t, , (23)d cjt
rcjt d cjt
QA
d
G
c j t, , (24)4- Multi
-
Choice Goal Programming with utility Function (MCGP)
Multi-Choice Goal Programming (MCGP) is used in this study with utility function.
4-1-MCGP implementation
Chang's latest Goal Planning Model is used in the present study because it takes into account the preferences of decision makers in addition to other advantages. According to the definitions and concepts mentioned above, the Multi-Choice Goal Programming model for the issue of sustainable meat supply chain under uncertainty is as follows:
85
3 3
1 1 2 2 4 4
1 2 3 4 1 1 2 2 3 3 4 4 1 1 2 2 3 3 4 4
min w (d d ) w (d d ) w (d d ) w (d d ) w . w . w . w .
f f f f f f f f
(25)
1,max 1
1
1,max 1,min
U
y
U
U
(26)2,max 2
2
2,max 2,min
U
y
U
U
(27)3 3,min
3
3,max 3,min
y
U
U
U
(28)4 4,min
4
4,max 4,min
y
U
U
U
(29)1 1 1 1
Z dd y (30)
2 2 2 2
Z dd y (31)
3 3 3 3
Z dd y (32)
4 4 4 4
Z dd y (33)
1 1
1
(34)5- Case study
In this study, validity and efficiency of the proposed model have been investigated based on Savannah production group in Galugah. Gulogah is located in the southeast of the Caspian Sea and the north of the northernmost ridge of the Alborz Mountain (Jahan Mora) at geographical coordinates of 53 degrees and 48 minutes east longitude with 36 degrees and 45 minutes north latitude and is located in the east of Mazandaran province and Behshahr city and west of Golestan province. Savannah Production Group has started its activities since the second half of 1989 by establishing a veterinary pharmacy. In the following years, Savannah Production Group extended its activities by establishing broody chicken and mother chicken units. Now, this production group is trying to become one of the best food brands in the world by completing its healthy and qualified production chain.
The production chain of this group consists of veterinary complex (clinic, laboratory, and pharmacy), units of broody chicken and mother chicken, seed unit and abattoirs (slaughter line, meat cutting units, packaging, processing, freezing tunnels, refrigerators, refineries). The meat powder production unit, stores and restaurant chains are in progress. The capacity of the abattoirs according to the exploitation license is 120,000 pieces per day.
5-1-Data Estimation
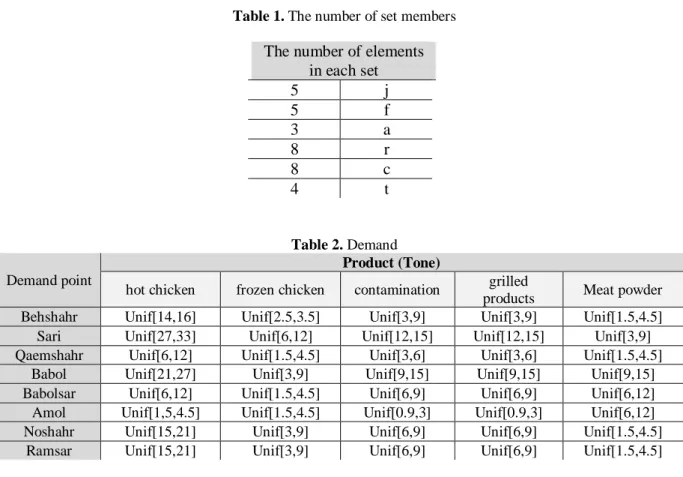
In this section, the data required to solve the mathematical model are evaluated according to a case study. In Savannah production group, various products are produced. In this study, some of these products including hot chicken without antibiotics, frozen chicken, contamination, grilling and powder have been considered. Therefore, the set (j) consists of 5 members, the first product is hot chicken, the second product is frozen chicken, the third product is contamination, the fourth product is grilled products and the fifth product is meat powder. Also, the number of farms (f) is equal to 5. The number of slaughterhouses (a) is equal to 3, the number of retailers (r) is equal to 8, the number of customers (c) is equal to 8 and the number of time periods (t) is equal to 12. The number of elements in each set is given in table 1.
86
Table 1. The number of set members
The number of elements in each set
j 5
f 5
a 3
r 8
c 8
t 4
Table 2. Demand Demand point
Product (Tone)
hot chicken frozen chicken contamination grilled
products Meat powder Behshahr Unif[14,16] Unif[2.5,3.5] Unif[3,9] Unif[3,9] Unif[1.5,4.5] Sari Unif[27,33] Unif[6,12] Unif[12,15] Unif[12,15] Unif[3,9] Qaemshahr Unif[6,12] Unif[1.5,4.5] Unif[3,6] Unif[3,6] Unif[1.5,4.5]
Babol Unif[21,27] Unif[3,9] Unif[9,15] Unif[9,15] Unif[9,15] Babolsar Unif[6,12] Unif[1.5,4.5] Unif[6,9] Unif[6,9] Unif[6,12] Amol Unif[1,5,4.5] Unif[1.5,4.5] Unif[0.9,3] Unif[0.9,3] Unif[6,12] Noshahr Unif[15,21] Unif[3,9] Unif[6,9] Unif[6,9] Unif[1.5,4.5]
Ramsar Unif[15,21] Unif[3,9] Unif[6,9] Unif[6,9] Unif[1.5,4.5]
The demand for the product (j) by the retailer (r) in the time period (t) on monthly basis in tone is shown in table 2.
Table 3. Purchasing cost
Parameter Purchasing unit cost
fjt
P Unif [27,33]
The cost of purchased product (j) from the potential farm (f) in the time period (t) on a monthly basis is given in table 3 in Toman.
Table 4. Types of costs, both fixed and variable in the time period (t) on a monthly basis in Toman
parameter value
f
n
Unif[5,7]a
b
Unif[5000,10000]r
e
Unif[9,11]fajt
kc Unif[0.1,0.2]
arjt
lc Unif[0.3,0.6]
rcjt
87
5-2-Results of solving the proposed model
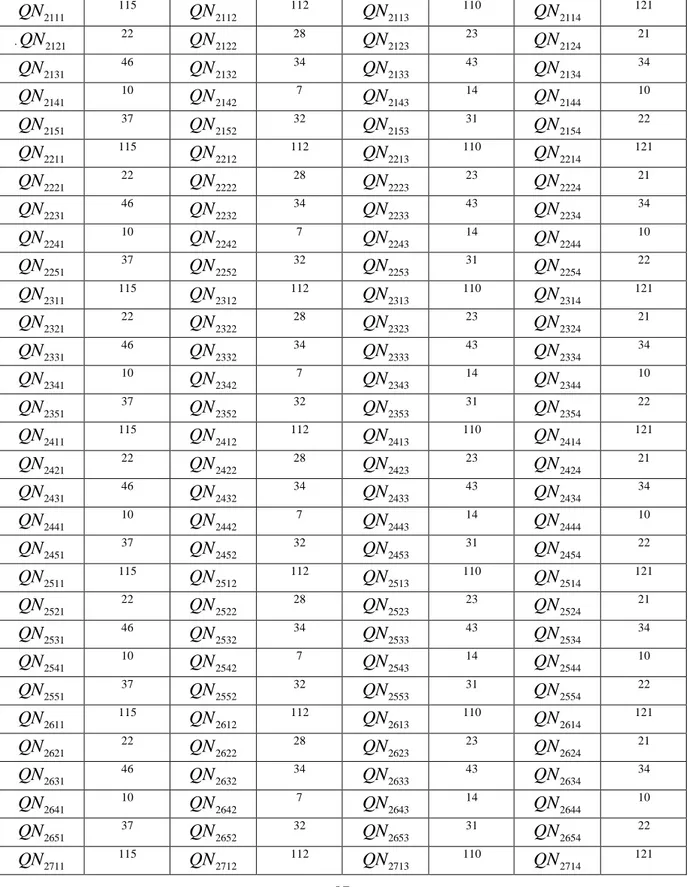
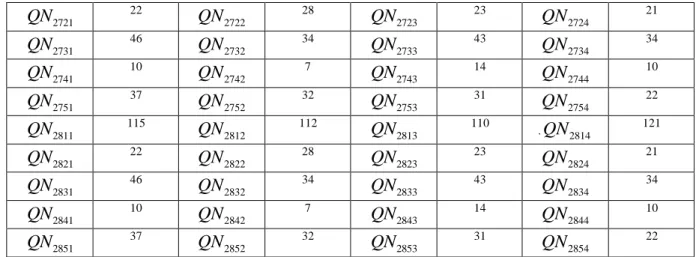
The parameters mentioned above have been implemented along with the proposed model in Lingo software. The overall optimal result was equal to 542766. The decision variables except the output variables with zero value are reported in the following tables. The amount of product J that is transferred from slaughterhouse A to retailer R over time t is shown in table 5.
Table 5- QNarjt
121 2114
QN
110 2113QN
112 2112QN
115 2111QN
21 2124QN
23 2123QN
28 2122QN
22 2121QN
. 34 2134QN
43 2133QN
34 2132QN
46 2131QN
10 2144QN
14 2143QN
7 2142QN
10 2141QN
22 2154QN
31 2153QN
32 2152QN
37 2151QN
121 2214QN
110 2213QN
112 2212QN
115 2211QN
21 2224QN
23 2223QN
28 2222QN
22 2221QN
34 2234QN
43 2233QN
34 2232QN
46 2231QN
10 2244QN
14 2243QN
7 2242QN
10 2241QN
22 2254QN
31 2253QN
32 2252QN
37 2251QN
121 2314QN
110 2313QN
112 2312QN
115 2311QN
21 2324QN
23 2323QN
28 2322QN
22 2321QN
34 2334QN
43 2333QN
34 2332QN
46 2331QN
10 2344QN
14 2343QN
7 2342QN
10 2341QN
22 2354QN
31 2353QN
32 2352QN
37 2351QN
121 2414QN
110 2413QN
112 2412QN
115 2411QN
21 2424QN
23 2423QN
28 2422QN
22 2421QN
34 2434QN
43 2433QN
34 2432QN
46 2431QN
10 2444QN
14 2443QN
7 2442QN
10 2441QN
22 2454QN
31 2453QN
32 2452QN
37 2451QN
121 2514QN
110 2513QN
112 2512QN
115 2511QN
21 2524QN
23 2523QN
28 2522QN
22 2521QN
34 2534QN
43 2533QN
34 2532QN
46 2531QN
10 2544QN
14 2543QN
7 2542QN
10 2541QN
22 2554QN
31 2553QN
32 2552QN
37 2551QN
121 2614QN
110 2613QN
112 2612QN
115 2611QN
21 2624QN
23 2623QN
28 2622QN
22 2621QN
34 2634QN
43 2633QN
34 2632QN
46 2631QN
10 2644QN
14 2643QN
7 2642QN
10 2641QN
22 2654QN
31 2653QN
32 2652QN
37 2651QN
121 2714QN
110 2713QN
112 2712QN
115 2711QN
88 21 2724
QN
23 2723QN
28 2722QN
22 2721QN
34 2734QN
43 2733QN
34 2732QN
46 2731QN
10 2744QN
14 2743QN
7 2742QN
10 2741QN
22 2754QN
31 2753QN
32 2752QN
37 2751QN
121 2814QN
. 110 2813QN
112 2812QN
115 2811QN
21 2824QN
23 2823QN
28 2822QN
22 2821QN
34 2834QN
43 2833QN
34 2832QN
46 2831QN
10 2844QN
14 2843QN
7 2842QN
10 2841QN
22 2854QN
31 2853QN
32 2852QN
37 2851QN
For example,
QN
2634= 34 means that the amount of the third type of product in the fourth season of the year that is transferred from the second abattoirs to the sixth retailer is equal to 34 tone.6-Sensitivity analysis
In this section, the effect of some model parameters on the objective functions is investigated. To do so, the sensitivity analysis of the changes of the objective function with different values of the
parameters is shown and the results are analysed .
6-1- Sensitivity analysis of the first objective function
Fig.2. Sensitivity analysis on demand (the first objective function)
The first objective function minimizes the total cost. According to (figure 2), increase in demand has a significant effect on the first objective function.
89
6-2- Sensitivity analysis of the second objective function
Fig.3. Sensitivity Analysis on Demand on the Second Objective Function
As can be seen in (figure 3), increase in demand has a significant effect on the second objective function which is the same as environmental impacts.
Fig.4 Sensitivity analysis on demand on the third objective function
As can be seen in (figure 4), increase in demand leads to increase of the value of the third objective function. The third objective function optimizes productivity.
16150 16200 16250 16300 16350 16400 16450 16500
1 2 3 4 5
THIRD OBJECTIVE FUNCTION
Series1D
90
6-3- Sensitivity analysis of the fourth objective function
Fig.5. Sensitivity analysis on demand on fourth objective function
The fourth objective function optimizes social impacts. As shown in (figure 5), the value of the fourth objective function increases with the increase in demand.
7- Conclusion
Sustainable food supply chains face challenges such as waste management and environmental issues. Meanwhile, sustainable supply chain is an integrated technique to examine all economic, social and environmental aspects. In this research, a multi-objective mixed integer linear programming model with uncertainty to design a sustainable meat supply chain network consideration of economic, environmental, productivity and social objectives functions. The proposed model minimized total network costs (both fixed and variable costs) and optimized productivity. Also, robust programming approach is used to deal with uncertainty in some model parameters. Lingo software and Multi-Choice Goal Programming are applied in order to solve the model with regard to the utility function. Then, sensitivity analysis is performed on the values of the objective function relative to the changes in demand and the results are reported. The results of sensitivity analysis showed that the increase in demand is positively related to the amount of the first, second and fourth functions. On the other hand, the increase in demand leads to decrease in the amount of the third function.
Future research directions for this work are as follows:
In this study, the rate of corruption is not considered. In order to bring the results of the research closer to the real world, the rate of corruption can be considered in the future studies. Meta-innovative algorithm can be used in order to solve the models in larger dimensions. It
also helps to achieve more accurate answers.
Accurate solution algorithms such as Benders decomposition algorithm can be applied in the future researches.
Responsiveness can be added to the proposed model. Reliability can be added to the problem.
Adding more objectives to this model such as minimizing the delivery time of meat products.
0 5000 10000 15000 20000 25000 30000 35000 40000
1 2 3 4 5
FOURTH OBJECTIVE FUNCTION
Series1D
91
References
Mohebalizadehgashti, F., Zolfagharinia, H., & Amin, S. H. (2020). Designing a green meat supply chain network: A multi-objective approach. International Journal of Production Economics, 219, 312-327.
Aras, N., & Bilge, Ü. (2018). Robust supply chain network design with multi-products for a company in the food sector. Applied Mathematical Modelling, 60, 526-539.
Vafaei, A., Yaghoubi, S., Tajik, J., & Barzinpour, F. (2020). Designing a sustainable multi-channel supply chain distribution network: A case study. Journal of Cleaner Production, 251, 119628.
Ghezavati, V. R., Hooshyar, S., & Tavakkoli-Moghaddam, R. (2017). A Benders’ decomposition algorithm for optimizing distribution of perishable products considering postharvest biological behavior in agri-food supply chain: a case study of tomato. Central European Journal of Operations Research, 25(1), 29-54.
Mogale, D. G., Cheikhrouhou, N., & Tiwari, M. K. (2019). Modelling of sustainable food grain supply chain distribution system: a bi-objective approach. International Journal of Production Research, 1-24.
Cruz, L., Pires-Ribeiro, J., & Barbosa-Póvoa, A. (2019). Design and Planning of Agri-Food Supply Chains. In Computer Aided Chemical Engineering (Vol. 46, pp. 55-60). Elsevier.
Soysal, M., Bloemhof-Ruwaard, J. M., & Van Der Vorst, J. G. (2014). Modelling food logistics networks with emission considerations: The case of an international beef supply chain. International Journal of Production Economics, 152, 57-70.
Mohammed, A., & Wang, Q. (2017). The fuzzy multi-objective distribution planner for a green meat supply chain. International Journal of Production Economics, 184, 47-58.
Bottani, E., Murino, T., Schiavo, M., & Akkerman, R. (2019). Resilient food supply chain design: Modelling framework and metaheuristic solution approach. Computers & Industrial Engineering, 135, 177-198.
Musavi, M., & Bozorgi-Amiri, A. (2017). A multi-objective sustainable hub location-scheduling problem for perishable food supply chain. Computers & Industrial Engineering, 113, 766-778.
Mohammadi, Z., Barzinpour, F., & Teimoury, E. (2020). Designing sustainable supply chain network
by considering direct and indirect shipment: Evidence from food industry. Decision Science
Letters, 9(3), 323-336.
Bortolini, M., Galizia, F. G., Mora, C., Botti, L., & Rosano, M. (2018). Bi-objective design of fresh food supply chain networks with reusable and disposable packaging containers. Journal of cleaner production, 184, 375-388.
Validi, S., Bhattacharya, A., & Byrne, P. J. (2014). A case analysis of a sustainable food supply chain
distribution system—A multi-objective approach. International Journal of Production
Economics, 152, 71-87.
Zhang, X., Zhao, G., Qi, Y., & Li, B. (2019). A Robust Fuzzy Optimization Model for Closed-Loop Supply Chain Networks Considering Sustainability. Sustainability, 11(20), 5726.
92
and its application to a global manufacturer. Journal of Cleaner Production, 156, 276-292.
Yun, Y., Chuluunsukh, A., & Gen, M. (2019, August). Design and Implementation of Sustainable Supply Chain Model with Various Distribution Channels. In International Conference on Management Science and Engineering Management (pp. 469-482). Springer, Cham.
Pishvaee, Mir Saman, Masoud Rabbani, and Seyed Ali Torabi. "A robust optimization approach to closed-loop supply chain network design under uncertainty." Applied Mathematical Modelling 35.2 (2011): 637-649.