Total Internal Reflection Fluorescence Microscopy for
Characterizing Biochemical Interactions
Bridgett L. Steele
A dissertation submitted to the faculty of the University of North Carolina at Chapel Hill in partial fulfillment of the requirements for the degree of Doctor of Philosophy in the
Department of Chemistry.
Chapel Hill 2009
ABSTRACT
Bridgett L. Steele: Total Internal Reflection Fluorescence Microscopy for Characterizing Biochemical Interactions
(Under the Direction of Nancy L. Thompson)
Total internal reflection fluorescence (TIRF) microscopy is a widely used technique for the study of biologically relevant processes both in vitro and in vivo. In
TIRF, an incident light beam propagates through a transparent solid and encounters a solid/liquid interface at an angle sufficient enough such that the light undergoes total internal reflection, which generates an evanescent field that decays exponentially with distance from the surface. Thus, the main advantage of TIRF is that it selectively excites fluorescent molecules at or near the solid-solution interface. TIRF is used to study the thermodynamic and kinetic properties of three systems in this dissertation.
Discoidin domain receptor 2 (DDR2) is a receptor tyrosine kinase that is activated by fibrillar collagens in the extracellular matrix. Upon activation through collagen binding, DDR2 regulates cell adhesion, proliferation, and extracellular matrix remodeling. To study the binding of the extracellular domain of DDR2 to collagen, methods to deposit thin films of aligned or unaligned collagen I on fused silica slides were developed. Additionally, to characterize the effect of oligomerization of DDR2 on collagen binding, methods to separate monomeric, dimeric, and aggregates of DDR2 were also explored. This work represents the preliminary steps necessary to study the binding of surface immobilized collagen to fluorescently-labeled DDR2 using TIRF.
To Mom and Dad:
Thank you for 28 years of unfaltering love and support.
And in Loving Memory of
ACKNOWLEDGEMENTS
First and foremost, I’d like to thank my parents for always being there for me, whether it was car problems, the numerous moves in the sweltering heat, or just the periodic “You go, Girl!” pep talks. You’ve always believed in me, even when I didn’t believe in myself. I know that without your support I would have never made it this far.
To Renea, thanks for pulling me out of the lab and onto a plane bound for Europe! It was an experience I’ll never forget. Also, thanks for reminding me that the grass isn’t always greener on the other side and to enjoy the experience of being in school.
Lance, I can’t thank you enough for all the little things you’ve done over the last 3 years, but especially the last 3 months, to help me get through graduate school. Thank you for keeping me sane, for making me laugh, for weathering my moods, for fixing my computer issues, and for keeping me fed. Our relationship means more to me than I could ever put into words.
To Karen, from the good (?) old days in electronics lab to now, thanks for being a wonderful friend. I’ll never forget our late night movies and brownie binges. Graduate school wouldn’t have been the same without you.
To my research advisor, Nancy, thanks for helping me grow into the person and the scientist that I am today. I’ve appreciated your guidance through the rough times in my research and in my life.
TABLE OF CONTENTS
LIST OF TABLES... xi
LIST OF FIGURES ... xii
LIST OF ABBREVIATIONS... xiv
Chapter 1 Introduction ... 1
1.1 Overview ... 2
1.2 Total internal reflection fluorescence microscopy (TIRF) ... 3
1.3 Epifluorescence Microscopy ... 8
1.4 Continuous Photobleaching... 9
1.5 Atomic Force Microscopy... 9
1.6 References ... 18
Chapter 2 Quantitative Studies of the Ligand-Dependent Binding of Pregnane X Receptor to Steroid Receptor Coactivator 1 ... 22
2.1 Introduction ... 23
2.2 Theory... 30
2.2.1 Equilibrium Binding of Coactivator Peptide in the Absence of Ligand ... 30
2.2.2 Effect of Nonfluorescent Ligands ... 32
2.3 Materials and Methods ... 36
2.3.1 Materials... 36
2.3.3 Immobilizing Proteins Using His6 Tags... 37
2.3.4 AviTag-His6-LBD-PXR... 39
2.3.5Fluorescent Labeling of SRC-1 peptide ... 43
2.3.6Surface Immobilization of Receptors Using NeutrAvidin (Control Experiments) ... 44
2.3.7 Equilibrium Binding of SRC-1 to Immobilized B-PXR ... 46
2.3.8 Apparatus for TIRF and Epifluorescence ... 46
2.4 Results ... 47
2.4.1 Immobilizing Proteins at Surfaces using His6 Tags ... 47
2.4.2 Specifically Biotinylating the LBD of PXR... 48
2.4.3 Immobilizing Proteins at Surfaces Using Biotin-Avidin Interactions ... 49
2.4.4 Equilibrium Binding of B-PXR to SRC-1 Peptide ... 50
2.5 Discussion... 53
2.6 References ... 65
Chapter 3 Experiments toward Understanding the Molecular Binding of the Discoidin Domain Receptor 2 to Monomeric and Fibrillar Collagen Type... 70
3.1 Introduction ... 71
3.2 Materials and Methods ... 79
3.2.1 Materials... 79
3.2.2 Collagen Alignment and Characterization ... 79
3.2.3 Expression, Purification, and Characterization of DDR2 ... 83
3.2.4 FPLC ... 86
3.2.5 Fluorescent Labeling... 86
3.3 Results ... 88
3.3.1 Aligned and Unaligned Films of Collagen Fibrils ... 88
3.3.2 Fluorescent Imaging of Collagen Fibril Films ... 89
3.3.3 AFM Imaging... 89
3.3.4 Expression of DDR2 ... 91
3.3.5 TIRF Microscopy ... 92
3.4 Discussion... 95
3.5 References ... 110
Chapter 4 Quantifying GFP Diffusion in Escherichia coli by Using Continuous Photobleaching with Evanescent Illumination... 114
4.1 Introduction ... 115
4.2 Theory... 117
4.2.1Conceptual Basis... 117
4.2.2 Concentration of Unbleached Molecules as a Function of Space and Time... 119
4.2.3Fluorescence Decay During Continuous Photobleaching... 124
4.2.4Limits as a Function of Intensity Parameter c... 125
4.2.5 Measurements with Immobilized GFP... 126
4.3 Methods ... 127
4.3.1GFP Expression... 127
4.3.2 GFP Purification... 127
4.3.3 Sample Preparation ... 128
4.3.4 Total Internal Reflection (TIR) Fluorescence Microscopy... 129
4.3.5 Size of Evanescent Illumination... 129
4.3.7 Cell Length... 130
4.3.8 Data Analysis ... 131
4.4. Results ... 132
4.4.1 Size of Evanescent Illumination in the x-y Plane and I0 Values... 132
4.4.2 Cell Length... 132
4.4.3 Photobleaching Propensity... 133
4.4.4 Diffusion Coefficient of GFP in E. coli... 133
4.4.5 Effects of Osmotic Shock... 135
4.5 Discussion... 135
LIST OF TABLES
2.1 Selected Agonists of PXR...28
2.2 Selected Antagonists of PXR...29
2.3 Kd for B-PXR Binding to SRC-1 ...51
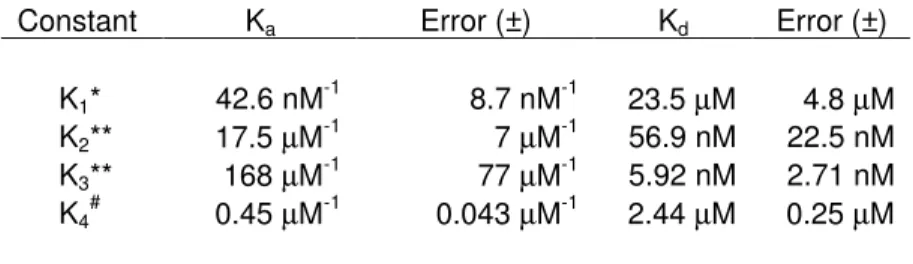
2.4 Calculated K’s for B-PXR Binding to SRC-1 ...52
3.1 Evaluation of Sample Reproducibility...94
LIST OF FIGURES
1.1 Total Internal Reflection ...12
1.2 TIRF Apparatus ...13
1.3 Equilibrium Binding Measured with TIRF...14
1.4 TIR-FRAP...15
1.5 Epifluorescence Illumination ...16
1.6 AFM Apparatus ...17
2.1 Ligand-Dependent Activation of PXR...56
2.2 Crystal Structure of LBD of PXR...57
2.3 Theoretical TIRF Equilibrium Binding Curves ...58
2.4 Reversible Equilibria of Surface-Immobilized PXR Complexes ...59
2.5 Theoretical Ka vs L Curve ...60
2.6 Equilibrium Binding of EGFP-His6 to Ni-DOGS-NTA Lipids ...61
2.7 Western Blotting of B-PXR ...62
2.8 SRC-1 Binding to Immobilized B-PXR ...63
2.9 Ligand-Dependent Binding of PXR...64
3.1 Structure of Collagen Fibrils...102
3.2 NMR Structure of the Discoidin Domain of DDR2 ...103
3.3 Epifluorescent Image of Aligned Collagen Fibrils ...104
3.4 AFM Images of Collagen Films ...105
3.5 SDS-PAGE and Western Blotting of ECD-DDR2 ...106
3.7 FPLC Chromatograms of ECD-DDR2 Samples ...108
3.8 SDS-PAGE of FPLC Fractions...109
4.1 Through-Prism Total Internal Reflection with Continuous Photobleaching (TIR-CP)... ...139
4.2 Parameters xn and fn...140
4.3 Accuracy of x12 Approximations ...141
4.4 Spatial Profile of the Evanescent Illumination in the x-y Plane. ...142
4.5 Cell Length, L ...143
4.6 Photobleaching Propensity for Immobilized GFP ...144
4.7 Representative Evanescently Excited Fluorescence Decay Curves for GFP in E. Coli Cells ...145
LIST OF ABBREVIATIONS
α incidence angle
αc critical angle
A488 Alexa Fluor® 488 C5 maleimide
A514 Alexa Fluor® 514 carboxylic acid, succinimidyl ester AF-2 activation factor 2 domain
AFM atomic force microscopy
AMP ampicillin
B-PXR biotinylated PXR BSA bovine serum albumin CCD charge-coupled device CHO Chinese hamster ovary
CHLOR chloramphenicol
CF correction factor
CP continuous photobleaching d depth of the evanescent wave
Da Dalton
DBD DNA binding domain
DDR(s) discoidin domain receptor(s) DDR1 discoidin domain receptor 1 DDR2 discoidin domain receptor 2
dia diameter
DMEM Dulbecco's modified eagle medium DNA Deoxyribonucleic acid
DPPC 1,2-Dipalmitoyl-sn-Glycero-3-Phosphocholine
DS discoidin
DTT dithiothreitol
ε molar extinction coefficient ECD extracellular domain ECM extracellular matrix
EDS N-2-aminoethyl-3-aminopropyl-trimethoxysilane EGFP enhanced green fluorescent protein
EM-CCD electron-multiplying charge coupled device Fab fragment antigen binding
FITC fluorescein isothiocyanate
FC fibrillar collagen
FCS fluorescence correlation spectroscopy FPLC fast protein liquid chromatography
FRAP fluorescence recovery after photobleaching FRET fluorescence resonance energy transfer GFP green fluorescent protein
G(t) normalized autocorrelation function HEK human embryonic kidney
HCl hydrochloride
HPLC high performance liquid chromatograpy HRP horseradish peroxidase
IgG Immunoglobulin G
IPTG isopropyl-β-D-thiogalactopyranoside
Κd dissociation constant
λ wavelength
λ0 wavelength of light in a vacuum
LB Luria broth
LBD ligand binding domain LBP ligand binding pocket
M molarity (moles/liter)
mA milliamp
MALS multi-angle light scattering
MC monomeric collagen
MEM minimal essential media MMP(s) matrix metalloproteinase(s)
MW molecular weight
MWCO molecular weight cut off n1 refractive index of solid
n2 refractive index of liquid
NBD-DPPE 1,2-Dipalmitoyl-sn-Glycero-3-Phosphoethanolamine-N-(7-nitro-2-1,3-benzoxadiazol-4-yl) (Ammonium Salt)
Ni-DOGS-NTA
1,2-Dioleoyl-sn-Glycero-3-[N-(5-amino-1-carboxylpentyl)iminodiacetic acid)succinyl](nickel salt) Ni-NTA nickel nitrilotriacetic acid
NR nuclear receptor
O hydroxyproline
Ova ovalbumin
PAGE polyacrylamide gel electrophoresis PBS phosphate buffered saline
PMSF phenylmethanesulphonylfluoride
POPC 1-Palmitoyl-2-Oleoyl-Glycero-3-Phosphocholine PPAR peroxisome proliferated-activator receptor PVDF polyvinyldiene fluoride
PXR pregnane X receptor
RXRα retinoid X receptor α
SDS sodium dodecyl sulfate
SEC size exclusion chromatography
SMRT silencing mediator for retinoid and thyroid receptors SPR surface plasmon resonance
TCS transferred cross-saturation TEM transmission electron microscope TIR total internal reflection
TIRF total internal reflection fluorescence
Chapter 1 Introduction
1.1 Overview
Measuring the interactions between individual biological molecules in a regulated pathway is key to understanding the overall functioning observed in cellular systems. Total internal reflection fluorescence microscopy (TIRF) is a powerful method for quantitatively measuring equilibrium thermodynamic and kinetic constants in biological systems. As such, this thesis presents work towards characterizing the molecular interactions of two biologically relevant systems, pregnane X receptor (PXR) and discoidin domain receptor 2 (DDR2), using TIRF microscopy, and presents a new TIRF method for studying protein diffusion in living cells. PXR is a member of the nuclear receptor family of ligand activated transcriptional factors and is believed to be responsible for the metabolism of over 50% of prescription drugs.1 In Chapter 2, in vitro
binding of PXR to one of its transcriptional co-activators, steroid receptor co-activator 1 (SRC-1), in the presence of the antibiotic rifampicin is examined using TIRF. DDR2 is a receptor tyrosine kinase that binds to collagens in the extracellular matrix (ECM), in turn leading to the upregulation of enzymes that degrade the ECM.2 In Chapter 3, work towards using TIRF to study the binding of the extracellular domain of DDR2 to collagen type I is explained. Finally, a new method for studying diffusion of green fluorescent protein (GFP) in Escherichia coli through combination of TIRF with continuous
1.2 Total internal reflection fluorescence microscopy (TIRF)
Total internal reflection fluorescence microscopy (TIRF) was first introduced as a sensitive method for measuring the biophysical interactions of surface associated fluorescent molecules in the 1980’s.3 Nearly thirty years after its inception, TIRF is commonly used to measure surface densities of bound, fluorescent molecules and to image cell–substrate contacts.4-6 TIRF is also used in conjunction with other techniques such as fluorescence recovery after photobleaching (FRAP), fluorescence resonance energy transfer (FRET), fluorescence correlation spectroscopy (FCS), and fluorescence polarization to measure surface binding kinetic rates and translational diffusion coefficients, molecular distance-dependent events, local fluorophore concentrations and translational mobilities, and population orientation distributions, respectively.4, 7 Recently, TIRF has been combined with atomic force microscopy (AFM), and the combination has been shown to be a powerful technique for determining both the local structure and dynamics of biological molecules and assemblies.8, 9
In TIRF, an incident light beam propagates through a transparent solid, encounters a solid-liquid interface at an angle greater than the critical angle, and
undergoes total internal reflection. The critical angle is defined as αc = sin-1(n2/n1),
where n2 and n1 are the refractive indices of the solution and solid, respectively (n1 > n2).
An electromagnetic field called the evanescent wave is created and propagates parallel to the surface. The evanescent wave penetrates into the liquid medium, and the intensity decays exponentially with distance from the surface. The characteristic 1/e decay depth
is defined by the equation d = λ0/[4π(n12sin2α-n22)1/2], where λ0 is the wavelength of light
interface (Figure 1.1). The primary advantage of using evanescent illumination is that it selectively excites fluorescently labeled molecules at the surface-solution interface, even while they are in reversible equilibrium with the solution.4, 7 For live cells immobilized at the solid-solution interface, only fluorophores located within or close to the plasma membrane are excited, which significantly reduces background fluorescence.6 TIRF measurements are most commonly carried out on a fluorescence microscope but can also be performed in a conventional spectrofluorimeter adapted for evanescent excitation.7, 10 Additionally, the use of microfluidics with fluorescence microscopy would allow for the automation of TIRF measurements.11
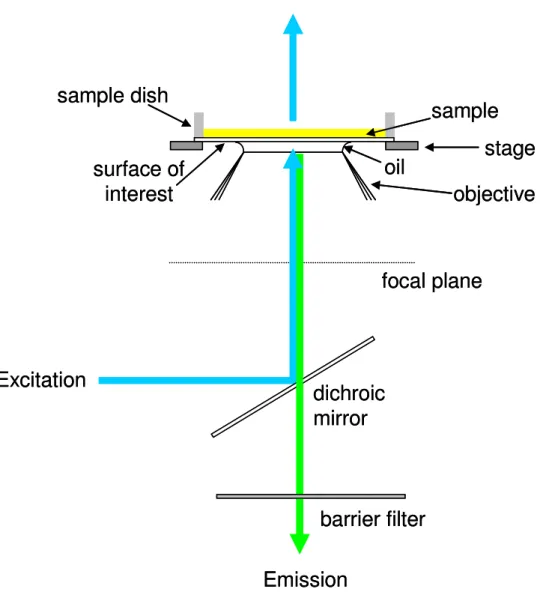
For fluorescence microscopy, the conventional method for generating TIR to date has been to use a prism, mounted to the stage of an inverted fluorescence microscope, through which a laser beam is loosely focused at the point of internal reflection. The prism is optically coupled, generally by using a refractive index matching liquid such as glycerol, to the surface of interest. A surface, solution and coverslip sandwich is formed using spacers. The evanescently excited fluorescence is collected with a microscope objective and is passed through a barrier filter (and usually a dichroic mirror) in the microscope to remove scattered radiation from the excitation source. The light is passed to a detector, which is typically a silicon avalanche photodiode or a photomultiplier. For
A second method for generating an evanescent field along a surface of interest is to use through-objective TIRF. As the name implies, internal reflection is generated by focusing a laser beam through the periphery of a high numerical aperture objective, which is directly coupled to the surface of interest, in a manner similar to epi-illumination (see section 1.3). The evanescently excited fluorescence is collected back through the same objective, passes through a dichroic mirror and barrier filter to remove scattered excitation light and is passed through a pinhole to the detector (Figure 1.2b). Additional focusing lenses may also be required to direct the light source through the objective at an angle great enough for TIRF. Recent work details the building and testing of in-house through-objective TIRF systems.4, 12-14 Additionally, several manufacturers provide TIRF attachments for inverted microscopes; thus, through-objective TIRF is becoming the predominant configuration.
Theoretical treatments for the optical characteristics of the evanescent wave for both geometries have been presented.19-21
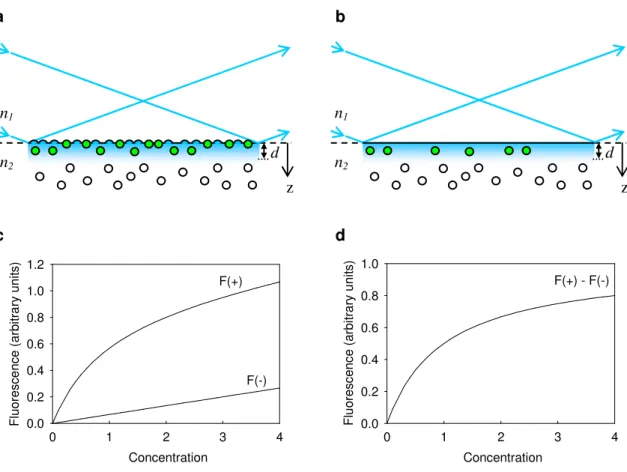
In TIRF, equilibrium constants are found by measuring the evanescently excited fluorescence intensity as a function of the bulk concentration of fluorescently labeled molecules in solution. The resulting signal arises from two sources—from fluorescently labeled molecules that bind to the surface and from fluorescently labeled molecules that are not associated with the surface but diffuse within the evanescent wave. The latter creates a background signal that increases linearly with the bulk concentration of fluorophores in solution, therefore requiring the use of negative controls to account for this phenomenon. Negative controls are created either by removing surface binding sites or by blocking binding to the surface. The background signal is then subtracted from the original curve before obtaining the equilibrium binding constant (Figure 1.3).22
bilayers and has been used in live cell work to monitor kinetic rates for the interactions of intracellular and extracellular proteins with the plasma membrane.5 When used in combination with an imaging detector, spatial maps of dissociation rates from intact cell membranes for a fluorescent molecule can be generated and used to probe surface inhomogeneity in cells.23
In recent years, the commercialization of through-objective TIRF microscopes, combined with improvements in data acquisition rates in electron-multiplying charge coupled device (EM-CCD) cameras, has lead to a rapid rise in use of TIRF in single-molecule detection and imaging in vivo of dynamic membrane processes. The
advantages of imaging with TIRF include improved background as compared to traditional fluorescence microscopy, precise axial tracking, applicability to multi-color and multi-photon excitation, and the ability to image cells longer due to higher survival rates achieved by using low excitation intensities.4, 6 Furthermore, TIRF has been shown to be compatible with standard epifluorescence, bright field, dark field, or phase contrast illumination and can be switched back and forth to obtain more information about the biological systems under study. Unlike confocal microscopy, TIRF lacks the ability to probe deep within thick cells, but will likely continue to grow in popularity due to its ability to be adapted to standard microscope optics.4
1.3 Epifluorescence Microscopy
commonly used for imaging of biological samples labeled with fluorescent dyes and is the illumination method used in wide field, through-objective TIRF, and confocal fluorescence imaging. Epifluorescence is used in Chapter 3 to image collagen films on fused-silica substrates.
1.4 Continuous Photobleaching
Continuous photobleaching (CP) was first developed in the 1980’s as alternative method to FRAP for studying the translation diffusion of lipids in model systems and live cells. In CP, an excitation source is used to bleach fluorescence molecules in a sample, and the fluorescence decay is monitored as a function of time. The rate and the shape of the fluorescence decay can then be analyzed to extract diffusion coefficients for biological samples. As high powered laser flashes and detector protection intervals are not required for CP, the instrumental set-up is also less complicated than for FRAP. However, there is a higher probability of photochemical effects occurring in CP, since the intensity used to excite and bleach fluorophores in CP is higher than the intensity used to monitor fluorescence recovery in FRAP, and data interpretation can be complicated.33, 34 A novel method that combines CP with TIR, which allows for diffusion to be measured in structures only slightly larger than optical resolution, is described in chapter 4.35
1.5 Atomic Force Microscopy
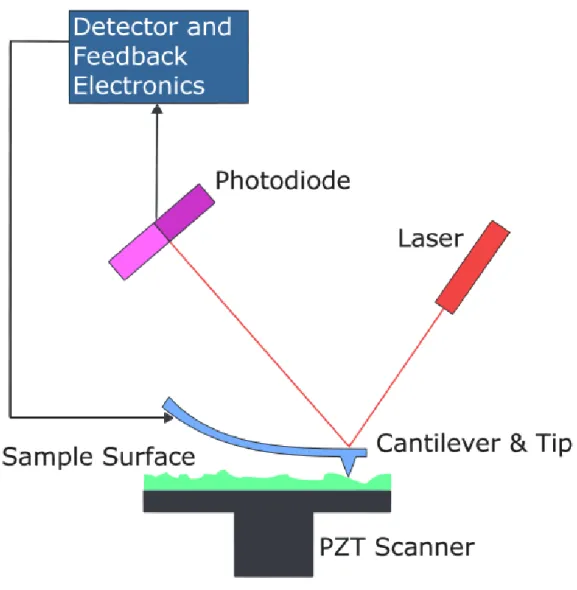
intramolecular forces between interacting molecules.37-40 In imaging AFM, a sharp tip (typically made of silicon or silicon nitride), which is attached to a spring loaded cantilever, is rastered across the surface of sample. Interactions with features on the surface cause the tip to move up or down with the contour of the surface and are detected using a laser beam, which is reflected off the back of the cantilever and onto a position sensitive photodiode. A piezoelectric tube connected to a feedback mechanism is used to translate the sample in the X, Y, and Z directions (Figure 1.6). An image of the surface is then generated by plotting Z direction movements as a function of X-Y positions.39, 40 The spatial resolution of the measurements is related to the radius of curvature of the tip apex, which is minimized (typically 2 to 50 nm) for best resolution.40 AFM can be conducted in air, aqueous solution, or under vacuum. Due to its widespread use, many AFM scanning techniques have been developed,40 and the two most commonly used modes are contact and intermittent-contact or tapping mode.
334 . 1 2 =
n
n
1n
2d
α
>
α
cz
a
b
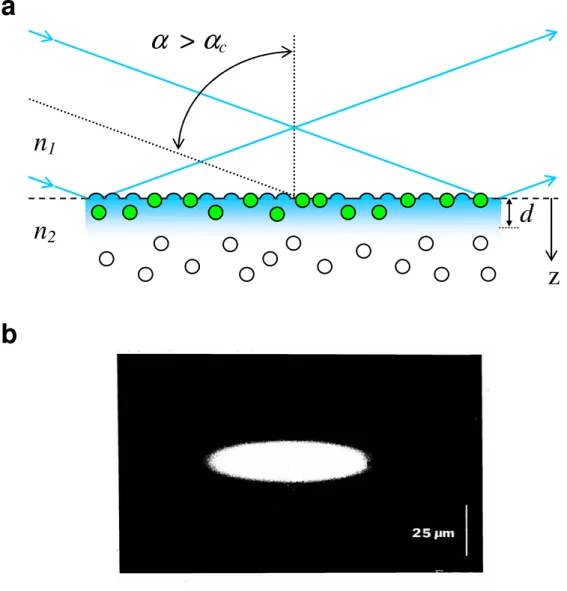
Figure 1.1 Total Internal Reflection. (a) Total internal reflection is generated when an incident light beam propagates through a transparent solid and encounters a planar solid-solution interface at an angle greater than the critical angle αc, creating an
electromagnetic field that excites fluorescent molecules near the solid-solution interface (green circles). The evanescent wave decays exponentially with distance d
(shown in blue) from the surface, and fluorescent molecules outside of this field are not excited (clear circles). For fused silica and glass, n1≈1.5, n2≈1.3 and d≈0.1 µm. (b)
microscope detector laser PC correlator shutter BF pinhole eye mirror DCM detector laser PC correlator microscope prism shutter BF pinhole eye mirror a
i b i
ii ii stage objective focal plane dichroic mirror surface of interest oil λ0 sample sample dish spacer/sealant objective focal plane coverslip oil sample surface of interest stage prism glycerol λ0 microscope detector laser PC correlator shutter BF pinhole eye mirror DCM microscope detector laser PC correlator shutter BF pinhole eye mirror DCM detector laser PC correlator shutter BF pinhole eye mirror DCM detector laser PC correlator microscope prism shutter BF pinhole eye mirror detector laser PC correlator microscope prism shutter BF pinhole eye mirror a
i b i
ii ii stage objective focal plane dichroic mirror surface of interest oil λ0 sample sample dish objective focal plane dichroic mirror surface of interest oil λ0 sample sample dish spacer/sealant objective focal plane coverslip oil sample surface of interest stage prism glycerol λ0 spacer/sealant objective focal plane coverslip oil sample surface of interest stage prism glycerol λ0
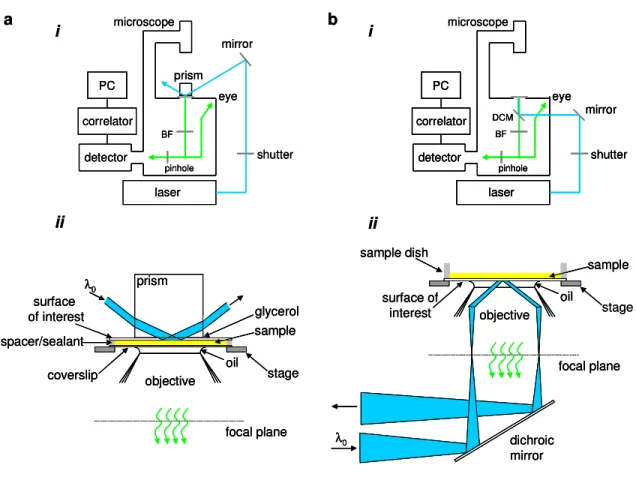
Figure 1.2 TIRF Apparatus. (a) Through-Prism TIRF. (i) A laser beam is totally internally reflected into a sample through a prism that is mounted onto the stage of an inverted microscope. The evanescently excited fluorescence is collected through a microscope objective and passed through a barrier filter (BF) to remove scattered evanescent light. The light is passed through a circular pinhole (optional), which is placed in a confocal back-image plane, before reaching the detector. The resulting
signal is processed using a PC with an optional correlator card. (ii) The sample is composed of a
transparent planar substrate of interest, solution and coverslip sandwich separated by spacers, and is mounted onto an inverted microscope such that the prism is optically coupled with glycerol to the substrate (usually fused silica). Internal reflection is generated by focusing a laser beam through the prism onto the sample and the evanescently excited fluorescence is collected through the objective. (b)
Through-objective TIRF. (i) A laser beam is directed through the microscope, reflected upwards using
a dichroic mirror (DCM) and focused through the periphery of a high numerical aperture objective, which is directly coupled to the surface of interest, to generate internal reflection. The evanescently excited fluorescence is collected back through the same objective, passes through a barrier filter (BF) to remove excitation light and passes through a pinhole (optional) before reaching the detector. The
resulting signal is acquired using a PC. (ii) The transparent planar substrate of interest is coupled to a
high numerical aperture objective using immersion oil. Total internal reflection is generated by focusing the laser through the periphery of a high numerical objective onto the substrate and the
KA (unitless)
0 1 2 3 4
F lu o re s c e n c e ( a rb it ra ry u n it s ) 0.0 0.2 0.4 0.6 0.8 1.0 1.2 F(+) F(-) KA (unitless)
0 1 2 3 4
F lu o re s c e n c e ( a rb it ra ry u n it s ) 0.0 0.2 0.4 0.6 0.8 1.0
F(+) - F(-) 334 . 1 2= n n1
n2 d
z 334 . 1 2= n n1
n2 d
z
Concentration Concentration
a
d b
c
Figure 1.3 Equilibrium Binding Measured with TIRF. (a) Fluorophores (clear and green circles) are in equilibrium between surface binding sites and solution.
n1
n2
d
z
n1
n2
d
z
n1
n2
d
z
time t
0
F
lu
o
re
s
c
e
n
c
e
F
(t
)
b
c d
a
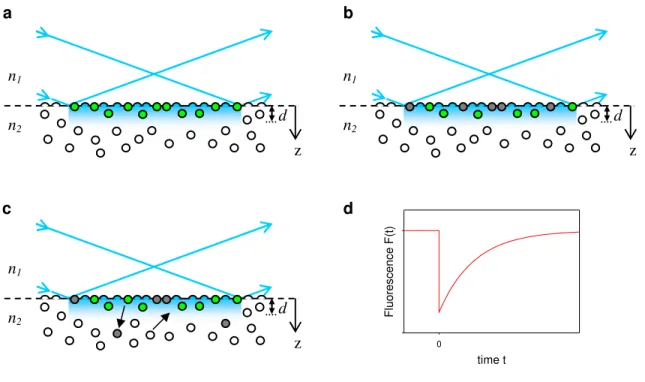
Figure 1.4 TIR-FRAP. In TIR-FRAP, (a) before bleaching (t<0), fluorescent molecules (green and clear circles) are in equilibrium between surface binding sites and the solution, and those at or near the surface are evanescently excited (green circles), giving rise to a fluorescence signal. (b) At t=0, a short, high intensity laser pulse is applied to the sample such that a fraction of the surface-associated fluorescent molecules within the evanescent wave are irreversibly photobleached (gray circles), reducing the fluorescence signal. (c) At t>0, surface-associated, photobleached molecules begin to desorb from the surface and are replaced with unbleached fluorophores from solution or from the surrounding non-illuminated area, and the fluorescence signal begins to recover. (d) By fitting the fluorescence recovery curve to appropriate theoretical forms, information about the surface association and
objective
focal plane
dichroic
mirror
surface of
interest
oil
Excitation
sample
sample dish
stage
barrier filter
Emission
objective
focal plane
dichroic
mirror
surface of
interest
oil
Excitation
sample
sample dish
stage
barrier filter
Emission
Figure 1.5 Epifluorescence Illumination. In epi-illumination, excitation light (blue) is passed through a microscope port, reflected off a dichroic mirror through an
1.6 References
1. Watkins, R. E.; Wisely, G. B.; Moore, L. B.; Collins, J. L.; Lambert, M. H.; Williams, S. P.; Willson, T. M.; Kliewer, S. A.; Redinbo, M. R., The human nuclear xenobiotic receptor PXR: structural determinants of directed promiscuity. Science 2001, 292, 2329-2333.
2. Vogel, W. F.; Abdulhussein, R.; Ford, C. E., Sensing extracellular matrix: an update on discoidin domain receptor function. Cellular Signalling 2006, 18, 1108-1116.
3. Axelrod, D., Cell surface contacts illuminated by total internal reflection fluorescence. The Journal of Cell Biology 1981, 89, 141-145.
4. Axelrod, D., Total internal reflection fluorescence microscopy. In Biophysical Tools for Biologists, Vol 2: In Vivo Techniques, 2008; Vol. 89, pp 169-221.
5. Thompson, N. L.; Pero, J. K., Total internal reflection fluorescence microscopy: applications in biophysics. In Fluorescence Spectroscopy in Biology Advanced Methods and their Applications to Membranes, Proteins, DNA, and Cells, Hof, M.; Hutterer, R.;
Fidler, V., Eds. Springer-Verlag: Berlin Heidelberg, 2005; Vol. 3, pp 79-103. 6. Groves, J. T.; Parthasarathy, R.; Forstner, M. B., Fluorescence imaging of membrane dynamics. Annual Review of Biomedical Engineering 2008, 10, 311-338.
7. Thompson, N. L.; Pero, J. K., Total internal reflection-fluorescence correlation spectroscopy. In Reviews in Fluorescence 2006, Geddes, C.; Lakowicz, J., Eds. Kluwer
Academic/Plenum Press: New York, 2006; Vol. 3, pp 215-237.
8. Oreopoulos, J.; Yip, C. M., Combined scanning probe and total internal reflection fluorescence microscopy. Methods 2008, 46 (1), 2-10.
9. Shaw, J. E.; Oreopoulos, J.; Wong, D.; Hsu, J. C. Y.; Yip, C. M., Coupling evanescent-wave fluorescence imaging and spectroscopy with scanning probe
microscopy: challenges and insights from TIRF-AFM. Surface and Interface Analysis
2006, 38 (11), 1459-1471.
10. Thompson, N. L.; Pearce, K. H.; Hsieh, H. V., Total internal fluorescence microscopy-application to substrate-supported planar membranes. European Biophysics Journal with Biophysics Letters 1993, 22 (5), 367-378.
11. Holden, M. A.; Cremer, P. S., Microfluidic tools for studying the specific binding, adsorption, and displacement of proteins at interfaces. Annual Review of Physical
Chemistry 2005, 56, 369-387.
13. Hassler, K.; Leutenegger, M.; Rigler, P.; Rao, R.; Rigler, R.; Gosch, M.; Lasser, T., Total internal reflection fluorescence correlation spectroscopy (TIR-FCS) with low background and high count-rate per molecule. Optics Express 2005, 13 (19), 7415-7423. 14. Ohsugi, Y.; Saito, K.; Tamura, M.; Kinjo, M., Lateral mobility of membrane-binding proteins in living cells measured by total internal reflection fluorescence correlation spectroscopy. Biophysical Journal 2006, 91 (9), 3456-3464.
15. Leutenegger, M.; Blom, H.; Widengren, J.; Eggeling, C.; Gosch, M.; Leitgeb, R. A.; Lasser, T., Dual-color total internal reflection fluorescence cross-correlation
spectroscopy. Journal of Biomedical Optics 2006, 11 (4).
16. Thompson, N. L.; Steele, B. L., Total internal reflection with fluorescence correlation spectroscopy. Nature Protocols 2007, 2, 878-890.
17. Huang, Z. P.; Pearce, K. H.; Thompson, N. L., Translational diffusion of bovine prothrombin fragment 1 weakly-bound to supported planar membranes-measurement by total internal-reflection with fluorescence pattern photobleaching recovery. Biophysical Journal 1994, 67 (4), 1754-1766.
18. Starr, T. E.; Thompson, N. L., Formation and characterization of planar
phospholipid bilayers supported on TiO2 and SrTiO3 single crystals. Langmuir 2000, 16
(26), 10301-10308.
19. Axelrod, D., Total internal reflection fluorescence microscopy in cell biology.
Traffic 2001, 2 (11), 764-774.
20. Steyer, J. A.; Almers, W., A real-time view of life within 100 nm of the plasma membrane. Nature Reviews Molecular Cell Biology 2001, 2 (4), 268-275.
21. Burghardt, T. P.; Ajtai, K.; Borejdo, J., In situ single-molecule imaging with attoliter detection using objective total internal reflection confocal microscopy.
Biochemistry 2006, 45 (13), 4058-4068.
22. Burghardt, T. P.; Thompson, N. L., Evanescent intensity of a focused gaussian light-beam undergoing total internal-reflection in a prism. Optical Engineering 1984, 23
(1), 62-67.
23. Mattheyses, A. L.; Axelrod, D., Direct measurement of the evanescent field profile produced by objective-based total internal reflection fluorescence. Journal of Biomedical Optics 2006, 11 (1).
24. Thompson, N. L.; Axelrod, D., Biochemical kinetics of protein surface binding studied at equilibrium with total internal-reflection fluorescence. Biophysical Journal
25. Sund, S. E.; Axelrod, D., Actin dynamics at the living cell submembrane imaged by total internal reflection fluorescence photobleaching. Biophysical Journal 2000, 79
(3), 1655-1669.
26. Gösch, M.; Rigler, R., Fluorescence correlation spectroscopy of molecular motions and kinetics. Advanced Drug Delivery Reviews 2005, 57 (1), 169-190.
27. Thompson, N. L., Fluorescence correlation spectroscopy. In Topics in
Fluorescence Spectroscopy, Lakowicz, J., Ed. Plenum Press: 1991; Vol. 1, pp 337-378.
28. Rigler, R.; Elson, E. L., Fluorescence correlation spectroscopy: theory and applications. Springer: Berlin, 2001.
29. Thompson, N. L.; Wang, X.; Navaratnarajah, P., Total internal reflection with fluorescence correlation spectroscopy: applications to substrate-supported planar membranes. Journal of Structural Biology 2009, In press.
30. Pero, J. K.; Haas, E. M.; Thompson, N. L., Size dependence of protein diffusion very close to membrane surfaces: measurement by total internal reflection with
fluorescence correlation spectroscopy. Journal of Physical Chemistry B 2006, 110 (22),
10910-10918.
31. Lieto, A. M.; Cush, R. C.; Thompson, N. L., Ligand-receptor kinetics measured by total internal reflection with fluorescence correlation spectroscopy. Biophysical Journal 2003, 85 (5), 3294-3302.
32. Lieto, A. M.; Thompson, N. L., Total internal reflection with fluorescence correlation spectroscopy: nonfluorescent competitors. Biophysical Journal 2004, 87 (2),
1268-1278.
33. Starr, T. E.; Thompson, N. L., Total internal reflection with fluorescence
correlation spectroscopy: combined surface reaction and solution diffusion. Biophysical Journal 2001, 80 (3), 1575-1584.
34. Thompson, N. L., Surface binding rates of non-fluorescenct molecules may be obtained by total internal-reflection with fluorescence correlation spectroscopy.
Biophysical Journal 1982, 38 (3), 327-329.
35. Brünger, A.; Peters, R.; Schulten, K., Continuous fluorescence microphotolysis to observe lateral diffusion in membranes. Theoretical methods and applications. Journal of Chemical Physics 1985, 82, 2147-2160.
37. Slade, K.; Steele, B. L.; Pielak, G.; Thompson, N. L., Quantifying green
fluorescent protein diffusion in Escherichia coli by using continuous photobleaching with
evanescent illumination. Journal of Physical Chemistry B 2009, 113, 4837-4845. 38. Binnig, G.; Quate, C.; Gerber, C., Atomic force microscopy. Physical Review Letters 1986, 56, 930-933.
39. Goksu, E. I.; Vanegas, J. M.; Blanchette, C. D.; Lin, W. C.; Longo, M. L., AFM for structure and dynamics of biomembranes. Biochimica Et Biophysica
Acta-Biomembranes 2009, 1788 (1), 254-266.
40. Muller, D. J.; Krieg, M.; Alsteens, D.; Dufrene, Y. F., New frontiers in atomic force microscopy: analyzing interactions from single-molecules to cells. Current Opinion in Biotechnology 2009, 20 (1), 4-13.
41. Yang, Y.; Wang, H.; Erie, D. A., Quantitative characterization of biomolecular assemblies and interactions using atomic force microscopy. Methods 2003, 29 (2), 175-187.
42. Frétigny, C., Atomic force microscopy. In Nanoscience: Nanotechnologies and Nanophysics, Dupas, C.; Houdy, P.; Lahmani, M., Eds. Springer-Verlag: Berlin
Heidelberg, 2007.
43. Ando, T.; Uchihashi, T.; Fukuma, T., High-speed atomic force microscopy for nano-visualization of dynamic biomolecular processes. Progress in Surface Science
2008, 83 (7-9), 337-437.
Chapter 2
2.1 Introduction
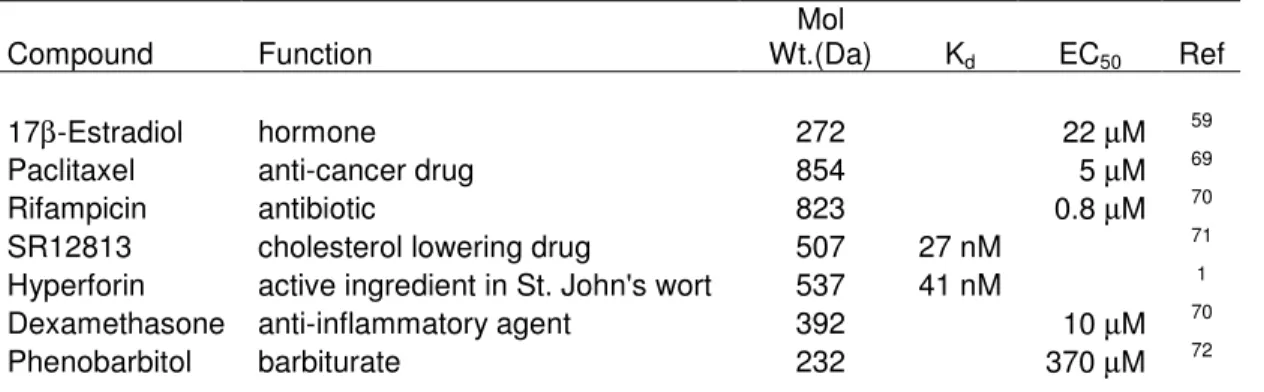
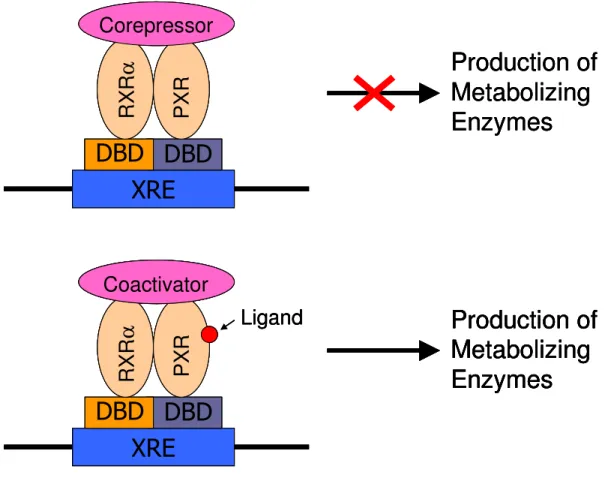
Pregnane X receptor is a member of the nuclear receptor (NR) family of ligand activated transcription factors that regulate gene expression. These receptors bind to DNA, recruit transcriptional coregulators in a ligand dependent manner, and activate the production of proteins that metabolize exogenous (xenobiotic) and endogenous chemicals.43-45 Unlike many other nuclear receptors that bind with high specificity to a particular set of ligands, PXR is a promiscuous receptor that binds to ligands of various sizes, ranging from 200 to 800 Da, with a wide array of structural diversity, including prescription drugs, herbal medicines, dietary supplements, environmental pollutants, and endobiotics.46, 47 Upon activation through ligand binding, PXR induces the expression of gene products involved in the uptake, metabolism, and elimination of xenobiotic and endobiotic compounds.45, 48
The complete extent of gene regulation by PXR is still being determined, as recent studies have implicated new genes previously not classified as PXR targets.49, 50
The general structure of PXR is similar to that of other nuclear receptors and contains an N-terminal ligand-independent transcriptional factor (AF-1) domain followed by a highly conserved DNA binding domain (DBD), characterized by two C4-type zinc fingers. A flexible hinge region connects the DBD to the ligand binding domain (LBD), which in addition to the ligand binding pocket (LBP) contains hetero- and homo-dimerization motifs and the ligand-dependent transcriptional regulation docking site, known as activation factor 2 (AF-2). PXR heterodimerizes with its obligate DNA
binding partner, retinoid X receptor α (RXRα), and binds to a variety of xenobioitic
recognition elements (direct repeats DR-3, DR-4, DR-5 and everted repeats ER-6 and ER-8), in the promoter regions of target genes.44, 45 Studies with human PXR indicate sublocalization in the nucleus even in the absence of activating ligand,50-52 however; localization may be species dependent, as studies in mice have shown that PXR is localized in the cytoplasm and translocates to the nucleus after receptor activation.51, 53
that contain the LXXLL motif, such as members of the p160 family of transcriptional activators, which includes steroid receptor coactivator-1 (SRC-1) and glucocorticoid receptor interacting protein-1 (Grip-1), are recruited along with basal transcriptional machinery, ultimately leading to gene expression. This two-state model for transcriptional activation is a common paradigm for ligand-dependent activation of nuclear receptors and is depicted in Figure 2.1. However, the discovery of corepressors that interact with agonist-bound nuclear receptors may require refinement of this model.54, 55
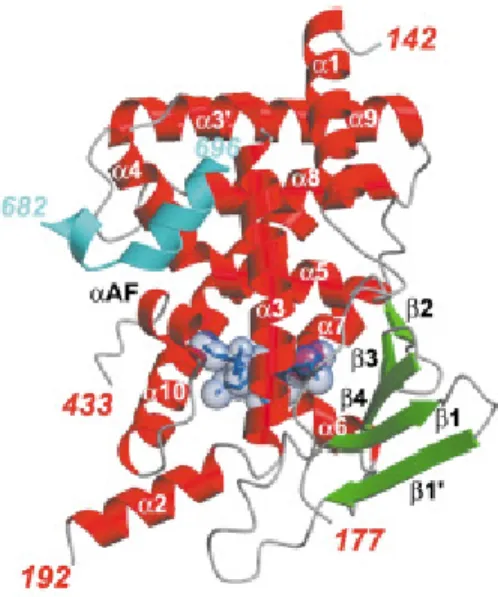
The overall fold of the ligand binding domain of PXR is similar to other NRs and
consists of a three-layer “α-helical sandwich” that encloses the large, spherical
binding-pocket of PXR (Figure 2.2). Unique to PXR, the LBD contains an insert of 50-60 amino
acid residues located between α1 and α3 that creates an extended, five-stranded
anti-parallel β-sheet adjacent to the LBP (other NR LBDs contain only 2 or 3-stranded β
-sheets) and creates a novel α2 fold along the underside of the LBP. Residues 178-191 of
the insert are disordered in PXR LBD crystal structures, implying structural mobility. Additionally, the binding pocket of PXR is much larger (on the order of 2 to 3 times) than other NRs and contains hydrophobic and hydrophilic residues that interact with bound
ligands. As in other NR-LBDs, the PXR LBD ends with a short helix (termed αAF or
α12) that is critical to the AF-2 region and thus coregulator binding.
that three main regions become disordered to create the space necessary to accommodate large agonists. These regions are the flexible loop formed from residues 229 to 235, a hydrophobic loop formed from residues 309 to 321 that folds into α6 in some structures,
and residues 192 to 210 that form a pseudo-helix or fold into α2, a “bona fide helix”, depending on the bound agonist. These structures reveal that the region comprising the
α2 helix directly contacts bound ligands and changes its conformation to accommodate
specific ligands. Additionally, α2 is believed to act as “trapdoor” to the ligand binding
pocket, dropping out of the way to provide a dynamic entry and exit way to the LBP of PXR. The crystal structure of SR12813 ligand alone showed three distinct binding conformations within the LBP, suggesting that the LBD of PXR “breathes” to allow the ligand to find the optimal binding orientation, and binding of the SRC-1 coactivator locks the ligand into a single conformation, stabilizing the interaction.44 Interestingly, the
crystal structure of the LBD of PXR bound to the endobioitic ligand 17β-estradiol (272
Da) showed that 1000 Ǻ3 of the ligand binding pocket was unoccupied.59
For many studies including in crystal structures, small α-helical peptides that contain the LXXLL or LXXX(L/I)XXX(L/I) motifs, termed NR boxes or interaction domains (ID), observed in coactivators and corepressors, respectively, are used instead of the corresponding full length proteins. Transcriptional coregulators generally contain several interaction domains, and NRs exhibit preferential binding to a particular ID within the coregulator.60 The crystal structure of PXR bound to ID2 of SRC-1 reveals
that the coactivator binding motif contains a two turn α-helix, which forms a charge clamp with the AF-2 region of PXR, connected to a second short, kinked helix that is
interacts with the corepressor docking site, located in NRs on α helices 3 through 5. The
coregulator binding sites overlap each other, and ultimately the position of the αAF/α12 helix determines whether the coactivator or corepressor binds to the LBD of the NR.55
Crystal structure data have also revealed that PXR forms a novel homodimer at an
interface created by the extended β-sheet observed in the LBD domain of PXR.58 The
β1’ strands from each monomer associate in an antiparallel fashion, creating the
homodimer interface, to form a 10-stranded intermolecular, β-sheet. The association of
the β1’ strands is stabilized by intermolecular hydrogen bonding between the
main-chains and through interlocking tryptophan and tyrosine residues (Trp223/Try225) that form an aromatic zipper at the dimer interface. Further studies have shown that removal of the tryptophan zipper resulted in loss of homodimerization, but did not affect the
ability of the receptor to bind to DNA, to heterodimerize with RXRα, or to bind to
activating ligands, and did not alter the subcellular localization of the receptor.61 However, the recruitment of transcriptional coactivators has been shown to be dependent on PXR’s ability to homodimerize,61 indicating that long-range motions “communicate” stabilizing effects from homodimerization to the AF-2 domain.62 Therefore, it has been proposed that the functional unit of PXR is a heterotetramer that is comprised of a PXR
dimer bound to two separate RXRα units.61, 62
relative potency. The inadvertent upregulation of metabolizing enzymes by PXR often leads to undesirable drug-drug interactions such as reduced efficacy of co-administered therapeutic drugs or the generation of toxic levels of drug metabolites. The classical example of this type of interaction is the failure of estrogen-containing oral contraceptives due to their increased metabolism by PXR gene products when taken with other known PXR activators such as rifampicin or St. John’s wort. To avoid these interactions, high throughput screening methods to detect possible PXR agonists have been developed using in vitro methods63, 64 and a commercialized kit is available.64 As
the potency of PXR activation by agonists has been shown to be species specific, the development of in vivo screening methods in animal models may not be optimal unless
“humanized” models are used.65, 66 Additionally, computational modeling methods have been developed to screen potential agonists based on structural similarity to known activators, through computational docking of ligands to the three dimensional structures generated from x-ray crystallography, NMR structures, or homology modeling of the protein, or through combination of both (reviewed in 67, 68).
Table 2.1 Selected Agonists of PXR
Compound Function
Mol
Wt.(Da) Kd EC50 Ref
17β-Estradiol hormone 272 22 µM 59
Paclitaxel anti-cancer drug 854 5 µM 69
Rifampicin antibiotic 823 0.8 µM 70
SR12813 cholesterol lowering drug 507 27 nM 71
Hyperforin active ingredient in St. John's wort 537 41 nM 1
Dexamethasone anti-inflammatory agent 392 10 µM 70
Another method for preventing PXR mediated drug-drug interactions is through the therapeutic use of PXR antagonists. Until recently, very few PXR antagonists had been identified, but the list is steadily growing, due in part to the discovery that antifungal azoles such as ketaconazole, which were first characterized as weak agonists of PXR, act as antagonists to ligand bound PXR. Studies showed that these PXR antagonists allosterically inhibit the receptor by binding in the same hydrophobic groove to which the coactivator binds.73, 74 Computational modeling and docking studies of this interaction eventually lead to the discovery of novel antagonists through database searching of commercially available molecules and through computer-aided antagonist design methods.67, 68, 75-77 Table 2.2 presents a selected list of known PXR antagonists along with their corresponding half maximal inhibitory concentrations (IC50), which are a
measure of the concentration of the antagonist necessary to achieve a 50% reduction in the signal that results from the activation of PXR in the presence of a known agonist.
Table 2.2 Selected Antagonists of PXR
Compound Function Mol Wt (Da) IC50 Ref
Ecteinascidin
(ET-743) anti-tumor drug 762 2 nM 69
Ketaconazole anti-fungal 531 ~20 µM 73
Fluconazole anti-fungal 306 ~20 µM 74
Enilconazole fungicide 297 ~20 µM 74
Leflunomide drug for rheumatoid arthritis 270 6.8 µM 75
experimental studies that quantitatively measure the interaction of PXR with its transcriptional coregulators, agonists, and antagonists. As such the goal to this study is to use total internal reflection fluorescence microscopy (TIRF) to measure the binding equilibrium of the LBD of PXR to a peptide analog of the steroid receptor coactivator-1 (SRC-1) in the presence of rifampicin, a known ligand and classic transcriptional activator. The rates will be used to quantitatively define the cyclic nature of the ligand dependent binding of coregulators to PXR. As TIRF requires that the LBD of PXR be immobilized at the solid-solution interface, this chapter also briefly describes the development of immobilization techniques that preserve biological functioning of the immobilized species.
2.2 Theory
2.2.1 Equilibrium Binding of Coactivator Peptide in the Absence of Ligand
To measure the equilibrium binding of the LBD of PXR using TIRF, the receptor is irreversibly immobilized at a solid-solution interface (see Methods) at which a laser is internally reflected. Enough fluorescently-labeled coactivator is added such that the bound coregulator density is constant and the solution concentration is known. The presumed reaction scheme is
1
C R
A+ ⇔ (1)
RA C
K1= 1 (2)
1
C R
RT = + (3)
fluorescent coregulator, RT is the total surface density of deposited receptor, and K1 is the
equilibrium binding constant for the association of free receptor, R, with fluorescently-labeled coregulator, A. The resultant evanescently excited fluorescence from the surface is
1
QC
F = (4)
where Q is proportionality constant, and substituting for C1 and R using equations (2) and
(3) gives
T QR A K
A K F
1 1
1+
= (5)
which has the standard form for the binding of a monovalent ligand to an immobilized receptor.
By measuring the evanescently excited fluorescence at increasing solution concentrations of A, a plot of F versus A is obtained (Figure 2.3a). After background subtraction, the equilibrium constant K1 can then be extracted by fitting the curve to
2.2.2 Effect of Nonfluorescent Ligands
Addition of non-fluorescent ligands of PXR to the solution containing fluorescently labeled coregulators in the presence of the immobilized LBD of PXR, results in a multiple reaction system. The presumed reaction scheme (depicted in Figure 2.4) is
1
C R
A+ ⇔ (1)
2
C R
L+ ⇔ (6)
3
1 C
C
L+ ⇔ (7)
3
2 C
C
A+ ⇔ (8)
where L is the solution concentration of nonfluorescent ligand, C2 is the surface density
of receptor complexed with nonfluorescent ligand, and C3 is the surface density of
receptor complexed with ligand and fluorescent coregulator. This generates four equilibrium association constants
RA C
K1 = 1 (2)
RL C
K2 = 2 (9)
L C
C K
1 3
3 = (10)
A C
C K
2 3
4 = (11)
where K2 is the association constant for ligand and receptor, K3 is the association
receptor-ligand complex and coregulator and all K values have units of (solution concentration)-1. The total concentration of receptors on the surface is defined by
3 2
1 C C
C R
RT = + + + (12)
and the resulting fluorescence from surface bound evanescently excited molecules is
) (C1 C3
Q
F = + (13)
with the assumption that Q is equivalent for C1 and C3.
As the scheme outlined above is cyclic, the equilibrium constants are related. By using equations 10-13 and by simplifying we find that
4 2 3
1K K K
K = (14)
Therefore, by substituting for C1 and C3, equation 15 for the measured surface-associated
fluorescence, after correction for background and contributions from solution, can be written as = + + + +
= QRT
LA K K L K A K A L K K K L A F 4 2 2 1 4 2 1 1 ) ( ) , ( T QR LA K K L K A K A L K K 3 1 2 1 3 1 1 ) 1 ( + + + + (15)
where the second equation follows from the relationship defined in equation 14. Note that at the limits of A=0 and A=∞
0 ) , 0 ( L =
F (16) T T QR QR LA K K A K A L K K L F = + + → ∞ 3 1 1 3
1(1 )
) ,
Thus, when there are no fluorescent coregulators present, the measured fluorescence is zero, and, when the concentration of fluorescent coregulators is very high, the surface-immobilized receptors are saturated with coregulator and the signal is proportional to the total surface concentration of receptor. Also, applying the same limits to the ligand concentration results in
T QR A K A K A F 1 1 1 ) 0 , ( + = (18) T T QR A K A K QR LA K K L K LA K K A F 4 4 4 2 2 4 2 1 ) , ( + = + →
∞ (19)
Therefore, when the concentration of ligand is zero, the equation for the surface fluorescence is equivalent to equation 5 and, of the four, only the association constant K1
contributes to the observed signal. When saturating concentrations of ligand are present (L=∞), the resulting fluorescence is dependent on the association of C2 with A, which is
described by K4. Additionally, equation 17 can be written as
= + + + + +
= QRT
A L K L K K A L K L K K L A F ) 1 1 ( 1 ) 1 1 ( ) , ( 2 3 1 2 3 1 T a a QR A K A K +
1 (20)
where Ka is an “apparent” K, depends on L, and is given by
At the limits,
1 0
]
[Ka L= =K (22)
4 1 2 3) ( ]
[ K K
K K
Ka L=∞ = = (23)
which is in agreement with equations 16 and 17. Additionally, equation 21 can be rewritten using equation 14 as
L K L K K K Ka 2 4 2 1 1+ + = (24)
Using TIRF, the surface fluorescence as a function of A is measured for increasing, constant values of L (to beyond a saturating concentration). In other words, multiple binding curves as a function of A are collected at different, constant concentrations of L. After background correction, each curve is fit to
T a a QR A K A K A F + = 1 )
( (25)
For each binding curve, best-fits of the data should give equivalent values of QRT but
values of Ka that depend on L (Figure 2.3b). The Ka values are then plotted as function
of L, and fitted to equation 21, where K2 and K3 are free parameters and K1 is determined
from the curve taken when the concentration of ligand is zero. Using the relationship defined in equation 16, K4 can then be determined. When the coregulator is a coactivator
that acts by a mechanism in which the ligand increases the association constant for the coactivator and receptor such that K3 > K2, the Ka vs L plot appears as shown in Figure
K2, the data would be similar, except that the plot would decrease from a maximum at L
= 0 (K1) to a minimum at at L = ∞ (K4).
2.3 Materials and Methods 2.3.1 Materials
All chemicals were purchased from Fisher Scientific (Fairlawn, NJ) unless otherwise specified. Deionized (DI) water was generated using a NANOpure® II water purification system (Barnstead International, Dubuque, IA). All lipids were purchased from Avanti Polar Lipids (Alabaster, Alabama). Purified biotin protein ligase (BirA), Biomix A, and Biomix B, were purchased from Avidity (Aurora, Colorado).
2.3.2 Slide Cleaning
2.3.3 Immobilizing Proteins Using His6 Tags
2.3.3.iEGFP-His6 Expression and Purification
Glycerol stocks of Escherichia coli (E. Coli) cells transformed with a plasmid
containing enhanced green fluorescent protein (EGFP) with a C-terminal His6 tag under a
T7 promoter (a gift from Dr. Dorothy Erie’s lab, UNC chemistry) were used to express protein using standard procedures. Briefly, a starter culture of liquid Luria Broth with
100 µg/mL of ampicillin (LBAMP) was inoculated with a single colony and grown
overnight. This starter culture was used to inoculate (1:100 dilution) 2 L of fresh LBAMP.
Once the optical density at 600 nm was between 0.5 to 0.7, the culture was induced with
a final concentration of 100 µM isopropyl-β-D-thiogalactopyranoside (IPTG) (99% Pure,
Dioxane-free; Promega Corp, Madison, WI)and was grown for 4 hours. All cultures were grown at 37˚C with constant shaking at 225 rpm. Cells were harvested by centrifugation (Sorvall RC-3B, Sorvall Instruments, Newtown, CT) at 1600 g for 20 min at 4˚C. The pellet was frozen at -80°C prior to protein purification.
The cell pellet was resuspended in lysis buffer (50 mM sodium phosphate pH 7.8, 300 mM NaCl, 5 mM imidazole, and 1 mM phenylmethanesulphonylfluoride (PMSF), before adding lysozyme (1 mg/mL working concentration) and reacting for 30 min at 4°C with gentle agitation to lyse the cells. The cell solution was then tip sonicated using 10 second pulses for 1 minute, and cell debris were removed by centrifugation (Sorvall
20 mM imidazole until the absorbance at 280 nm was less than 0.01, and 1 mL fractions were eluted with buffer containing 50 mM sodium phosphate pH=8.0, 300 mM sodium chloride, and 250 mM imidazole. The fractions containing EGFP were then pooled and dialyzed into PBS (phosphate buffered saline; 0.05 M sodium phosphate pH=7.4, 0.15 M sodium chloride, 0.01% sodium azide) overnight at 4°C. The concentration of the protein
was determined spectrophotometrically using the molar extinction coefficient (ε) of 5.5 x 10⁴ M-1cm-1 at 488 nm.
2.3.3.iiVesicle Fusion and Sample Preparation
For imaging studies, small unilamellar vesicles (SUVs) consisting of 5% 1,2-Dioleoyl-sn-Glycero-3-[N-(5-amino-1-carboxylpentyl)iminodiacetic acid)succinyl] (Nickel Salt) (Ni-DOGS-NTA); 93% 1,2-Dipalmitoyl-sn-Glycero-3-Phosphocholine (DPPC); 2% 1,2-Dipalmitoyl-sn-Glycero-3-Phosphoethanolamine-N-(7-nitro-2-1,3-benzoxadiazol-4-yl) (Ammonium Salt) (NBD-DPPE) were prepared by vesicle fusion. For control measurements, SUVS consisting of 98% (DPPC); 2% (NBD-DPPE) were also prepared. Lipids were mixed in chloroform, were dried under vacuum overnight, and were suspended in 3 mL of DI water such that the total concentration of lipids was 2 mM. The suspended mixture was then tip sonicated (Fisher Sonic Dismembrator, Model 300) for 15 minutes at 40-80% power in an ice bath to form SUVs. For TIRF measurements, 5 mol% Ni-DOGS-NTA, 95 mol% DPPC or 100 mol% 1-Palmitoyl-2-Oleoyl-Glycero-3-Phosphocholine (POPC) were made using the methods described above.
vesicle suspension was clarified by air ultracentrifugation at 130,000 g for 30 min (Beckman Airfuge; Beckman-Coulter, Fullerton, CA). Planar substrate supports were formed by attaching fused-silica substrates (1 in x 1 in x 1 mm) to glass microscope slide (1 in x 3 in 1 mm) using double-sided tape (3M Corp., Part No. 021200-64988) to form
slide “sandwiches”. To the internal volume of the sandwich, 75 µL of SUVs were
applied and incubated at room temperature for 1 hour before washing with 3 mL of PBS or PXR buffer (20 mM Tris pH 7.8, 250 mM sodium chloride, 5 mM dithiothreitol (DTT), 5% glyercol).
2.3.3.iiiEquilibrium Binding of EGFP to Ni- DOGS-NTA Membranes
To study the equilibrium binding of EGFP to Ni-NTA-DOGS membranes using TIRF, slide sandwiches with lipid bilayers consisting of 5 mol% Ni- DOGS-NTA, 95 mol
% DDPC or 100 mol% POPC were made as described above. To each slide, 200 µL of
0.5 to 10 µM EGFP in PBS were added, and evanescently-excited fluorescence intensity
was measured for nine spots on each slide using the TIRF system described below. Three completed data sets were collected and averaged to obtain the equilibrium binding constant (Kd). Sigma Plot® (Systat Software Inc., San Jose, CA) was used for data
analysis and curve fitting. 2.3.4 AviTag-His6-LBD-PXR
2.3.4.iPlasmids
The LBD of human PXR, amino acids 130-434, containing a N-terminal His6 tag
sequence was confirmed by DNA sequencing using commercially available primers (FASP and RSAP, Avidity). The AviTag-His6-LBD-PXR forthwith will be referred to as
b-PXR. A plasmid coding for an 88 amino acid fragment of SRC-1 (residues 623-710) was provided by Dr. Matthew Redinbo.1
2.3.4.ii Expression and Purification
b-PXR was co-coexpressed in E. Coli cells with the SRC-1 plasmid in either the
BL21 (DE3) or BL21 (AI) strain (Invitrogen Corp, Carlsbad, CA). For expression in BL21 (DE3) cells, an overnight culture containing 100 µg/mL of ampicillin and 35 µg/ml
chloramphenicol in LB (LBAMP-CHLOR) was grown from a single colony and a 1:100
dilution of this cultrure was used to start a 1.5 L culture of TB (24 g/L yeast extract, 12 g/L tryptone, 17 mM potassium phosphate monobasic, 72 mM potassium phosphate dibasic, 0.4% glycerol) at the same concentration of antibiotic (TBAMP-CHLOR) or 1.5 L
culture of LBAMP-CHLOR. The cells were grown to an optical density at 600 nm (OD600) of
approximately 0.6 at 37°C with shaking (225 rpm), and then induced with 50 µM to 1 mM of IPTG and allowed to grow at 37°C for 4 hours or overnight at 18°C. Alternatively, a 1.5 L culture of TBAMP-CHLOR was started as described above, IPTG was
added, and the culture was allowed to grow overnight at 22°C. For expression in BL21 (AI) cells, a 1.5 L culture of TBAMP-CHLOR was started as described, grown until an OD600
For all cultures, the cell pellet was resuspended in Ni-A wash buffer (20 mM Tris, pH 7.8, 250 mM sodium chloride, 20 mM imidazole, 5% glycerol) with 2 mM PMSF, 50
µg/mL DNase, 5 µg/mL aprotinin and 5 µg/mL leupeptin and was tip sonicated using 5 second pulses with 10 second off cycles for 3 minutes. The mixture was then centrifuged at 27000 g for 45 minutes to pellet cell debris, and the supernatant was collected and 0.45
µm filtered (Millex-HV syringe filters; Millipore Corp., Billerica, MA) before loading onto a Ni-NTA column. The column was then washed with 400 mL of Ni-A buffer, and was eluted using Ni-E buffer (20 mM Tris, pH 7.8, 250 mM sodium chloride, 300 mM imidazole, 5% glycerol). The fractions containing protein were pooled and dialyzed overnight into biotinylation buffer (20 mM Tris pH 7.8, 250 mM NaCl, 10 mM imidazole). All steps were performed at 4°C. Protein purity was ascertained using SDS-PAGE with Coomassie blue staining.
Protein expression was verified using western blotting with anti-His3-horseradish
peroxidase (HRP) antibodies (His-probe (H-3) HRP; Santa Cruz Biotechnology, Inc, Santa Cruz, CA) by pelleting 1 mL of cell culture. After discarding the supernatant, the cell pellet was resuspended in 0.25 mL of Ni-A buffer and put through a freeze-thaw cycle three times to lyse cells. The samples were then centrifuged to remove cell debris, and an aliquot of the supernatant was diluted 1:1 with 2x SDS-Loading Buffer (250 mM Tris-base pH=6.9, 40% (v/v) glycerol, 9.25% (w/v) SDS, 0.1% bromophenol blue, 10%
transferring to a PVDF membrane in 20 mM Tris-HCl, 20 mM glycine buffer at 350 mA for 60 minutes at 4°C. The membrane was blocked in 10 mM Tris pH=7.5, 150 mM sodium chloride, 5% (w/v) non-fat dried milk, and 0.05% Tween-20 buffer (TBST) for 45 minutes, was incubated with 1:1000 dilution of anti-His3 antibody in TBST for 1 hour,
was washed three times for 15 minutes with TBST, and was thoroughly washed with DI water to remove the milk. The blocking, incubation, and washing steps were all completed at room temperature. In the dark room, the blot was incubated with ECL detection chemical (Pierce Biotechnology, Rockford, IL) for 2 minutes and was exposed to Amersham Hyperfilm ECL photosensitive film (GE Healthcare, Piscataway, NJ) for 8-16 seconds. The film was developed using standard procedures.
2.3.4.iii Biotinylation of b-PXR
Purified b-PXR in biotinylation buffer was concentrated to 0.2 mg/mL using Amicon Ultra MWCO 10,000 (Millipore). Protein concentration was determined using Bio-Rad Protein Assay and BSA standards according to manufacturer’s protocols. The protein was biotinylated according to manufacturer’s instructions (Avidity product inserts). Briefly, the sample was diluted 8:1:1 b-PXR in biotinylation buffer, Biomix A,
and Biomix B, and 2.5 µg of BirA were added for every 10 nmoles of b-PXR. The