PERFLUOROPOLYETHER-BASED ELECTROLYTES FOR LITHIUM BATTERY APPLICATIONS
Hiu Ching Wong
A dissertation submitted to the faculty of the University of North Carolina at Chapel Hill in partial fulfillment of the requirements for the degree of Doctor of Philosophy in the Department
of Chemistry
Chapel Hill 2015
Approved by:
ABSTRACT
HIU CHING WONG: Perfluoropolyether-based Electrolytes for Lithium Battery Applications
(under the direction of Prof. Joseph M. DeSimone)
Large-scale rechargeable batteries are expected to play a key role in today’s emerging sustainable energy landscape. State-of-the-art lithium-ion batteries are not only widely used in electric vehicles, but they are currently gaining traction as backup power in aircraft and smart grid applications. In all of these cases, safety surrounding the electrolyte, an essential component of a lithium-ion battery, is a challenging limitation: the low flash points of currently used small molecule organic alkyl carbonates impose a high risk of ignition under most operating
conditions. For this reason, extensive efforts are being made to develop viable nonflammable electrolytes to replace these organic solvents.
Herein, we describe new classes of nonflammable liquid and solid electrolytes composed of oligomeric perfluoropolyethers. These materials are promising electrolyte alternatives due to their low glass transition temperatures, high chemical stability, capacity to dissolve lithium salts such as lithium bis(trifluoromethane)sulfonimide lithium salt, and compatibility with various common polymers such as poly(ethylene glycol). Synthetic modifications used to introduce a wide range of functional groups has created a platform of intrinsically fireproof materials that can be chemically tailored to achieve the desired physical, thermal, mechanical, and
commercially available hydroxyl-terminated PFPEs. The terminal group and molecular weight effects on the bulk properties of these materials were systematically characterized and their viability as electrolytes was evaluated.
The described work ultimately paves the way towards further optimization of perfluoropolyether materials towards the development of high performance lithium- ion batteries. The interesting properties of these materials invite an extensive study into the
fundamental mesoscale ion transport and the relationship between perfluoropolyether chemical structure and electrolyte electrochemical property, as well as a closer analysis into the
ACKNOWLEDGEMENTS
The author acknowledges those who contributed to and assisted with the work herein: Dr. Didier Devaux, Dr. Alessandra Vitale, Dr. Daniel Hallinan Jr., Jacob Thelen, William Daniel, Dr. Yanbao Fu, Dr. Sue Mecham, Mahati Chintapalli, Alexander Lapides, Dr. Ashish Pandya, and Dr. Simon Lux. The work described especially in the fourth chapter would not materialize without the contributions of two young talented scientists, Kevin Olson and Austria Taylor; it was such a pleasure to have the opportunity to mentor them during my graduate experience. My gratitude additionally extends to Dr. Yapei Wang, Dr. Mark Elsesser, Dr. David Wong, Crista Farrell, Vicki Haithcock, and Dr. J. Chris Luft for some great conversations and their countless support in my professional development. Of course, I would also like to sincerely thank my principal investigator Professor Joseph M. DeSimone; it has been an honor to be a part of his team and grow as a researcher under his technical and professional guidance.
My pursuit of a graduate degree at North Carolina was largely due to the efforts of Professor Alex Adronov, my mentor and former advisor at McMaster University. The many times in which he had more confidence in me than I had for myself taught me valuable lessons in maturity and perseverance and his wise words continue to resonate whenever I encounter
scientific and professional challenges.
during my time spent at the University of California, Berkeley and Lawrence Berkeley National Laboratory.
My entire experience would definitely not have been possible without the continued and unconditional support from my family: my parents, Chris and Vizonia, and my brother, Jonathan. I would also like to thank my friends Tiffany, Quynh, Daniel, Sarah, Tessa, and Stuart, and many others who were an instrumental source for motivation and encouragement.
Last but not least, with all my heart, I would like to thank and dedicate this work to Zachary Lewis Rodgers, who continues to inspire me everyday on and beyond the benchtop.
"What we call the beginning is often the end. And to make an end is to make a beginning. The end is where we start from."
TABLE OF CONTENTS
LIST OF TABLES………...…...…...xii
LIST OF FIGURES………...….………...xiii
LIST OF ABBREVIATIONS………...…...xix
CHAPTER 1: INTRODUCTION TO LITHIUM-ION BATTERIES ... 1
1.1 Introduction to Lithium-Ion Batteries………..………..1
1.1.1 Battery History, Terminology, and Chemistry ... 2
1.1.2 Concerns Regarding Battery Electrolytes ... 4
1.1.3 Current Efforts in Electrolyte Research ... 5
1.1.4 Liquid Electrolytes ... 6
1.1.4.1 Development of Fire Retardant Additives ... 6
1.1.4.2 Room Temperature Ionic Liquids ... 6
1.1.5 Solid-State Electrolytes ... 7
1.1.6 Hybrid Electrolytes and Other Systems ... 9
1.2 Perfluoropolyethers………..………..9
1.2.1 Methods Used to Synthesize PFPEs ... 10
1.2.1.1 Anionic Ring Opening Polymerization of Hexafluoropropylene Oxide ... 10
1.2.1.2 Direct Fluorination ... 11
1.2.1.3 Photooxidation ... 12
1.2.2 PFPE Uses and Applications ... 14
1.3.1 Physical and Thermal Characterization ... 18
1.3.1.1 Thermogravimetric Analysis ... 18
1.3.1.2 Different Scanning Calorimetry ... 19
1.3.1.3 Flammability Tests ... 20
1.3.1.4 Viscosity ... 21
1.3.2 Characterization of Elastomers ... 22
1.3.3 Electrochemical Characterization ... 24
1.3.3.1 Ionic Conductivity ... 24
1.3.3.2 Electrochemical Window ... 25
1.3.3.3 Battery Performance ... 26
1.3.4 Lithium-Ion Transference Number ... 27
1.3.4.1 Lithium-Ion Transference Number Using Pulsed Field Gradient NMR ... 28
1.3.4.2 Other Methods of Measuring Li-ion t+’s ... 30
1.3.4.2.1 Potentiostatic Polarization ... 30
1.3.4.2.2 Galvanostatic Polarization ... 31
1.3.4.2.3 Electromotive Force Method ... 31
REFERENCES ... 34
CHAPTER 2: PFPE/PEG BLENDS AS LI- ION BATTERY ELECTROLYTES ... 40
2.1 Introduction to Perfluoropolyether/Poly(ethylene glycol) Blends………...……..40
2.1.1 Investigations of Blends of Oligomers of PFPE and PEG with a Lithium Salt ... 42
2.2 Materials………..………...………43
2.3 Experimental……….………...43
2.3.2 Electrochemical Characterization ... 44
2.4 Results and Discussion………..………..44
2.5 Conclusion………..……….58
REFERENCES ... 59
CHAPTER 3: NOVEL PERFLUOROPOLYETHER-BASED ELECTROLYTES ... 62
3.1 Investigations of Perfluoropolyether/Carbonate Electrolytes…………...…...…..62
3.2 Materials………...………..………64
3.3 Experimental……….…………..……….64
3.3.1 Synthesis of PFPE-Dimethyl Carbonate ... 64
3.3.2 Physical and Thermal Characterization ... 65
3.3.3 NMR Characterization of PFPEs ... 66
3.3.4 Electrochemical Characterization ... 68
3.3.5 Determination of t+ using Alternating Current Impedance Spectroscopy ... 68
3.3.6 Electrochemical Coin Cell Testing ... 70
3.4 Results and Discussion………..………..71
3.5 Future Directions for PFPE-Dimethyl Carbonate Electrolytes……..………..83
REFERENCES ... 84
CHAPTER 4: FURTHER MODIFICATIONS OF PERFLUOROPOLYETHERS ... 87
4.1 PFPEs as a Chemical Platform for End Group Functionalization………..…………87
4.2 Part A: Effect of Functional Groups on Electrolyte Properties……..……...……….87
4.2.1 Materials ... 88
4.2.2 Experimental ... 89
4.2.2.2 Synthesis of PFPEE10- Diallyl Carbonate ... 89
4.2.2.3 Synthesis of PFPEE10-Dipropargyl Carbonate ... 90
4.2.2.4 Physical Characterization of PFPEs ... 90
4.2.3 Results and Discussion ... 91
4.3 Part B: Translation to Ultraviolet-Curable PFPE Electrolytes………....…..100
4.3.1 Materials ... 101
4.3.2 Experimental ... 102
4.3.2.1 Synthesis of PFPE-Dimethacrylate ... 102
4.3.2.2 Synthesis of PFPE-Dithiol ... 102
4.3.2.3 Photocuring of PFPE Precursors... 103
4.3.2.4 Characterization of Crosslinked PFPEs ... 103
4.3.3 Results and Discussion ... 104
REFERENCES ... 112
CHAPTER 5: ONGOING AND FUTURE DIRECTIONS... 115
5.1 Introduction………..………..115
5.2 NMR as a Tool to Study Ion Transport in Electrolytes…………..………...115
5.2.1 Using pfg-NMR to Measure t+’s in PFPE Electrolytes ... 116
5.2.1.1 Preliminary Experiments and Results ... 116
5.2.1.1.1 Materials ... 116
5.2.1.2 Experimental ... 117
5.2.1.2.1 Synthesis of PFPE-Dimethyl Carbonate ... 117
5.2.1.2.2 Preparation of NMR Samples ... 117
5.2.1.3 Discussion of Preliminary Results ... 119
5.2.2 Other Possible NMR Experiments: Determination of Linewidth and Relaxation ... 125
5.2.2.1 Linewidth ... 125
5.2.2.2 Relaxation ... 127
5.3 Investigation of PFPE/Electrode Interfaces………..……….128
5.3.1 Characterization of PFPE/Electrode Interfaces ... 130
5.3.2 Enhancing SEI Formation through Incorporation of Ethylene Carbonate... 131
5.3.3 Investigation of Failure Modes ... 133
LIST OF TABLES
Table 1.1 Example of hybrid electrolytes, as reported by Kim and coworkers in
Chemistry of Materials.27…………..………...9 Table 2.1 Sustained burning information for PFPE+PEG Electrolyte (r=0.026) ... 50 Table 2.2 Selected peaks and full widths at half maximum of 19F NMR for PEG,
PFPE+PEG and PFPE electrolytes. ... 56 Table 2.3 VTF fitted parameters for PEG, PFPE+PEG and PFPE electrolytes
containing LiTFSI (r = 0.026). ... 57 Table 3.1 Chemical shift analysis of a 19F NMR spectrum of PFPE1000-diol. Peaks
a-h correspond to peaks a-h in Figure 3.2. ... 67 Table 3.2 Determination of m:n and number of repeating units for PFPE1400-diol,
PFPE2000-diol, and PFPE4000-diol ... 67 Table 3.3 PFPEs studied with their corresponding degrees of polymerization and
Tg’s. ... 72
Table 4.1 Determination of m:n:q ratio and number of units for PFPEE10-diol. ... 92 Table 4.2 Thermal properties of PFPEE10-diol and synthesized dicarbonate
derivatives ... 95 Table 4.4 Corresponding decomposition temperature (5%), sustained burning
LIST OF FIGURES
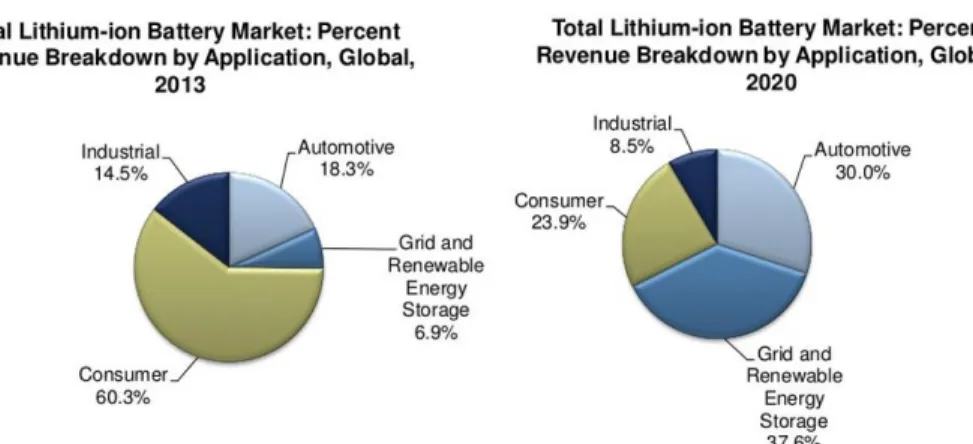
Figure 1.1 Li-ion battery market revenue breakdown in 2013 and the projected
breakdown in 2020, as published by Frost and Sullivan.1 ... 1 Figure 1.2 Li-ion battery in various configurations as published by Armand and
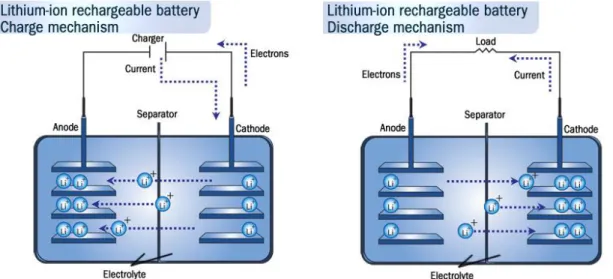
coworkers in Nature: (a) cylindrical (b) coin (c) prismatic or pouch unit, and (d) flat.3 ... 3 Figure 1.3 Schematic of the charge (left) and discharge (right) process of a Li-ion
battery.9 ... 4 Figure 1.4 Japan Airlines Boeing 787 Dreamliner at Boston Logan Airport with
smoke from battery fire.14 ... 5 Figure 1.5 Chemical structures of typical RTILs, as reported by Stępniak and
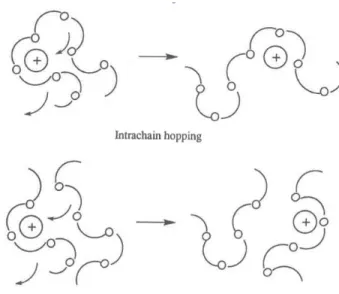
coworkers in Electrochmic Acta.24 ... 7 Figure 1.6 Intrachain (top) and interchain (bottom) hopping of ions facilitated by
segmental motion of polymer chains.34 ... 8 Figure 1.7 Different types of branched and linear PFPEs with various end group
functionalities. ... 10 Figure 1.8 Anionic ring opening of HFPO in the presence of CsF and TG.40 ... 11 Figure 1.9 Lewis acid catalyzed ring opening polymerization of 2,2,3,3-
tetrafluorooxetane following by direct fluorination under UV light.39 ... 11 Figure 1.10 Synthetic schemes outlining the initiation, propagation, and termination of
PFPE polymerization.49... 13 Figure 1.11 Temperature range of use of PFPEs relative to other lubricants and oils.53 ... 15 Figure 1.12 Microchannel section and sidewall of PFPE microfluidic device (left);
PFPE device filled with colored water-based solution (as reported by
Bongiovanni and coworkers in Langmuir).54... 16 Figure 1.13 Density of attached spores of Ulva on PDMS and PFPE elastomers
containing sPFPE and sPFPE with 10% SS after a 1h settlement period, as reported by DeSimone and coworkers in Macromolecules. Bars show 95 %
confidence limits.66 ... 17 Figure 1.14 Synthetic scheme of PFPE/PEG networks via a precursor approach,
Figure 1.15 Final density of attached diatoms on PFPE/PEG coatings. Bars show 95% confidence limits, as reported by DeSimone and coworkers in
Biofouling.65 ... 18 Figure 1.16 Sample DSC curve illustrating the Tg, Tc and Tm of a sample.70 ... 20 Figure 1.17 Example of a customized ignition test involving exposing a flame to
an electrolyte-soaked membrane.74 ... 21 Figure 1.18 Sample apparatus of sustained burning test in accordance with ASTM
D4206. ... 21 Figure 1.19 Stress strain plot and characteristic curves of rigid plastics, fibers,
flexible plastics, and elastomers.81 ... 23 Figure 1.20 Sample Nyquist plot obtained from EIS.83 ... 25 Figure 1.21 Components of an assembled battery coin cell. ... 26 Figure 1.22 Sample galvaonostatic cycling of a battery cell between 2.75 V and
4.25 V at a C-rate of 20 C. ... 27 Figure 1.23 Sample diffusion spectrum of two signals decaying in intensity as
magnetic field gradient strength increases.90 ... 29 Figure 1.24 Sample plot of diffusion peak intensity as a function of gradient field
strength.90 ... 29 Figure 1.25 Sample Etrans vs. E plot produced by the electromotive force method
for an EC/DEC electrolyte, as reported by Gores and coworkers in
Electrochimica Acta.86 ... 33 Figure 2.1 Photograph of PFPE/PEG blend films that are optically transparent or
opaque based on different composition ratios and molar masses, as reported by DeSimone and coworkers in the Journal of the American Chemical
Society. X-axis denotes the molar mass of PFPE and PEG and Y-axis represent composition ratios.22 ... 41 Figure 2.2 Chemical structures of PFPE-diol, PEG-diol, and LiTFSI... 42 Figure 2.3 Representative DSC heating curve of an immiscible ternary blend
Figure 2.4 Photograph of miscible and immiscible ternary blends PFPE/PEG/ LiTFSI and ternary phase diagram of PFPE, PEG, and LiTFSI physical blends expressed in wt. fractions. ... 46 Figure 2.5 FTIR spectra of PFPE, PEG, LiTFSI and blended solutions at various
wt. fractions. Highlighted guidelines are shown at 748, 798, 1190, 1325 and 1345 cm-1 respectively. ... 48 Figure 2.6 DSC cooling traces of PFPE and PEG blends at various PFPE wt.
fractions... 49 Figure 2.7 Percent crystallinity, expressed in Xc, as a function of PFPE wt.
fraction. ... 49 Figure 2.8 Thermogram of PFPE/PEG Blend ([PFPE]/[PEG]=1.6) with LiTFSI
concentration r = 0.026. (Td (5%) = 197.84 °C) in N2. ... 50 Figure 2.9 Tg of PFPE (Δ), PEG (☐), and PFPE+PEG blend (○) electrolytes as a
function of salt concentration r; dotted lines represent fitted linear
regressions... 52 Figure 2.10 19F NMR spectra of PFPE, PEG, and PFPE+PEG electrolytes in
reference to 0.05 M LiTFSI in D2O and pure PFPE. Highlighted guidelines are shown at -79.94, -83.49, and -85.51 ppm. ... 55 Figure 2.11 Temperature-dependent ionic conductivities of PFPE (black Δ), PEG
(blue ☐), and PFPE/PEG blend (red ○) electrolytes (r = 0.026); each sample follow VTF behavior... 57 Figure 3.1 1H NMR of PFPE1000-DMC in CDCl3. ... 65 Figure 3.2 19F NMR of PFPE1000-diol obtained in CDCl3. Peak labels a-h
correspond to peaks a-h in Table 3.1 ... 67 Figure 3.3 Nyquist plot obtained from AC Impedance for PFPE1000-DMC
electrolyte. Open symbols represent the experimental spectrum while the line is the modeling using electrical equivalent circuit. ... 69 Figure 3.4 Electrical model used to fit the Nyquist plot. ... 69 Figure 3.5t+ measurements of cells containing 50 μm PFPE1000-DMC electrolyte
using the Bruce and Vincent method using a 20 mV polarization at 38.8 °C. ... 70 Figure 3.6 Chemical reaction scheme describing the synthesis of PFPE-DMC
Figure 3.7TG curves for thermal decompositions of DMC (solid grey),
PFPE1000-diol (dash blue), and PFPE1000-DMC (solid green). ... 73 Figure 3.8 Characterization of LiTFSI loading in PFPE electrolytes. (A)
Maximum LiTFSI loading in PFPE-diols (blue) and PFPE-DMCs (green) expressed in rmax, the molar ratio of Li-ions to repeating fluoroether units and molarity, and in Rmax (inset), the molar ratio of Li-ions to end group
functionalities, as a function of molecular weight. (B) FTIR spectra of
PFPE1000-DMC/LiTFSI blends at different concentrations. ... 75 Figure 3.9 FTIR of PFPE1000-diol/LiTFSI blends compared to pure PFPE1000-diol
and LiTFSI. ... 76 Figure 3.10 Electrochemical behavior of PFPE electrolytes. (A) Ionic
conductivities of PFPE1000-diol (filled black circles), PFPE1400-diol (filled green squares), PFPE2000-diol (filled blue triangles), PFPE4000-diol (filled red diamonds), PFPE1000-DMC (open black circles, PFPE1400-DMC (open green squares), PFPE2000-DMC (open blue triangles), PFPE4000-DMC (open red diamonds) with LiTFSI at 30°C as a function of r. (B) t+ (open green triangles) and temperature-dependent conductivity (filled blue squares) of PFPE1000-DMC. Conductivity follows VFT
regression (grey, A = 5.10-4 Scm-1K-0.5, B = 0.47 kJmol-1, T0 = 271 K). ... 78 Figure 3.11 Nyquist plot obtained from AC impedance for SEO polymer electrolyte.
t+ was calculated to be 0.12. ... 80 Figure 3.12 Cyclic voltammograms of PFPE1000-DMC at 1 mV.s-1 from a
Li/Electrolyte/Stainless steel cell obtained at every fifth cycle at 40 °C (blue), 60 °C (green), 80 °C (orange), and 100 °C (red)... 81 Figure 3.13 Cyclability of Li/PFPE1000-DMC-LiTFSI/LiNMC cells. (A) Discharge
profiles obtained at 30 °C at different rates from C/20 to C/8 for a typical prototype Li/PFPE1000-DMC-LiTFSI/LiNMC. (B) Cycle performance of battery prototypes showing discharge (open green squares), charge (open blue squares) capacities, as well as overall efficiencies (filled grey circles). ... 82 Figure 3.14 Cycle performance of LiPF6-EC/DEC (1 M, 1:2 vol, Daikin Industries)
batteries. ... 82 Figure 4.1 Chemical structure of PFPEE10-diol ... 92 Figure 4.2 Synthetic scheme of PFPEE10-diol to prepare PFPEE10-DMC,
Figure 4.4 Thermogravimetric curves for thermal decomposition of PFPEE10-diol and its derivatives obtained in N2 ... 95 Figure 4.5 Maximum solubility of LiTFSI in different PFPE electrolytes. ... 96 Figure 4.6 Viscosity as a function of salt concentration in PFPE electrolytes. ... 97 Figure 4.7 Tg as a function of salt concentration in PFPEE10-diol and its
derivatives. ... 98 Figure 4.8 IR spectra of PFPEE10-DPC with 29 wt.% LiTFSI (purple) relative to
pure PFPEE10-DPC (black). ... 99 Figure 4.9 Schematic of the synthesis of PFPE-DMA. ... 105 Figure 4.10 A schematic of the synthesis of PFPE-dithiol. ... 106 Figure 4.11 A schematic of the free-radical polymerization and thiol-ene click
reaction between PFPE-DMA and PFPE-dithiol. ... 106 Figure 4.12 Gel fraction of PFPE-DMA elastomers with various wt.% of
PFPE-dithiol ... 107 Figure 4.13 Young’s Modulus of PFPE elastomers with various wt. % of
PFPE-dithiol. ... 109 Figure 4.14 Stress strain curves for PFPE-DMA elastomers with various wt. %
of PFPE-dithiol ... 109 Figure 4.15 The flexibility of (left) a PFPE-DMA elastomer compared to that of a
PFPE-DMA with 20% PFPE-dithiol elastomer (right). ... 109 Figure 4.16 Arrhenius plots of temperature-dependent ionic conductivity of
PFPE-DMA elastomers with various wt.% of PFPE-dithiol. ... 111 Figure 5.1 Schematic of NMR sample set up using a coaxial insert.6 ... 118 Figure 5.2 Sample STEbp pulse sequence as observed in the nucleus channel (in
this example figure the nucleus channel is 1H) and gradient channel (denoted by G). The radio frequency pulse, magnetic field gradient pulse, and acquisition of the free induction decay (FID) are also noted. ... 119 Figure 5.3 Measurement of D from STEbp and LEDbp sequences as a function
Figure 5.5 Simulated diffusion decay curve from 2 to 95% gradient strength in 14 steps obtained using Bruker TopSpin software. The data fit shown was achieved using equation 5.1. ... 121 Figure 5.6 Diffusion decay curve where the intensity has not decayed sufficiently
even at 95 % gradient strength. ... 122 Figure 5.7 Diffusion coefficients of Li-ions in PFPE-DMC (open blue circles) and
PFPE-diol (open red squares) as a function of temperature (K-1) ... 124 Figure 5.8 7Li NMR spectra of PFPE-diol containing 10 wt. % LiTFSI from 20 to
-40 °C (293 to 233 K). ... 126 Figure 5.9 Illustration of a π pulse and its effects on magnetic spin.23 ... 128 Figure 5.10 Sample graph of T1 relaxation as a function of inverse temperature
(K-1). A T1 minimum is shown here at approximately 3.15 K-1 (44 °C). ... 128 Figure 5.11 In situ TEM experiments reported by Cui and coworkers in Nano
Letters. (a) schematic of a typical in situ TEM cell. (b-d) Time series of the lithiation of a single silicon sphere (a-Si sphere and a-LixSi sphere
indicates unlithiated and lithiated spheres respectively).33 ... 131 Figure 5.12 Synthesis of vinyl ethers bearing carbonate side groups, as reported
by Boutevin and coworkers in in the Journal of Polymer Science.38 ... 132 Figure 5.13 Proposed synthetic scheme of the synthesis of PFPE-EC
electrolytes ... 132 Figure 5.14 Dendritic lithium formed in a lithium battery, as observed by Notten
LIST OF ABBREVIATIONS AND SYMBOLS A constant proportional to the number of charge carriers A/cm2 Ampere per square centimeter
AC alternating current
Aeff or A in terms of electrochemical and mechanical testing; cross-sectional area AFM atomic force microscopy
ASTM American Society for Testing and Materials ATR attenuated total reflectance
ATRP atom-transfer radical-polymerization B activation energy for ion motion BBO broadband observe
C/n charge rate
CDCl3 deuterated chloroform
cP centiPoises
DMA dimethylacrylate DMC dimethyl carbonate DMSO dimethyl sulfoxide DP degree of polymerization DPC diproparyl carbonate
DSC differential scanning calorimetry
E potential difference of cell in the presence of a salt bridge
E Young’s Modulus
Etrans potential different of cell in absence of a salt bridge EC ethylene carbonate
EIS electrochemical impedance spectroscopy F Faraday’s constant
Fn tensile force
FID free induction decay
FTIR Fourier transform infrared spectroscopy FWHM full width at half maximum
g gradient strength
g/mL gram per milliliter g/mol grams per moles
G NMR gradient channel
h hours
HMIS Hazardous Materials Identification System I in terms of NMR; observed intensity I0 in terms of NMR; reference intensity IEM 2-Isocyanatoethyl methacrylate
ICPMS inductively coupled plasma mass spectroscopy IR infrared spectroscopy
L length
LEDbp longitudinal eddy current delay with bipolar gradients
Li lithium
Li-ion lithium-ion
LiTFSI bis(trifluoromethane)sulfonimide lithium salt Mc molecular weight between crosslinks
mg milligram
mHz millihertz
mm millimeter
N2 nitrogen gas
nm nanometer
NMC nickel manganese cobalt oxide
NMR nuclear magnetic resonance spectroscopy
O2 oxygen gas
PEO poly(ethylene oxide)
pfg-NMR pulsed-field gradient nuclear magnetic resonance spectroscopy PFPE perfluoropolyether
PFPE1000-X or PFPE-X; materials synthesized from Fluorolink D10 or PFPED10-diol; X represents terminal functional group (allyl, DMC, propargyl, etc.) (Chemical structure found in Chapter 2.)
PFPE1400-X materials synthesized from Fluorolink materials molecular weight 1400. X represents terminal functional group (allyl, DMC, propargyl, etc.) (Chemical structures found in Chapter 3)
PFPE2000-X materials synthesized from Fluorolink materials molecular weight 2000. X represents terminal functional group (allyl, DMC, propargyl, etc.) (Chemical structures found in Chapter 3)
PFPE4000-X materials synthesized from Fluorolink materials molecular weight 4000. X represents terminal functional group (allyl, DMC, propargyl, etc.) (Chemical structures found in Chapter 3)
PFPEE10-X materials synthesized from Fluorolink E10 or PFPEE10-diol; X
represents terminal functional group (allyl, DMC, propargyl, etc.) (Chemical structures found in Chapter 4.)
r lithium salt concentration; molar ratio of lithium ions to polymer repeating units rmax maximum molar ratio of lithium ions to polymer repeating units
R ideal gas constant
R in terms of electrochemical calculations; resistance RTIL room temperature ionic liquids
s seconds
SE spin echo
SEI solid electrolyte interface
STE stimulated echo
STEbp stimulate echo with bipolar gradients S/cm Siemens per centimeter
t+ transference number
T0 empirical reference temperature corresponding to zero configurational energy T1 spin-lattice relaxation
Tc crystallization temperature TEA triethylamine
TFE tetrafluoroethylene
Tg glass transition temperature
TG tetraglyme
TGA thermogravimetric analysis Tm melting temperature
UV-Vis ultraviolet visible spectroscopy
V volts
VFT Vogel-Tamman-Fulcher Xc degree of crystallization
XPS x-ray photoelectron spectroscopy
wt. weight
Δ NMR diffusion time
Ω/cm2
Ohm per square centimeter
γ gyromagnetic ratio
ε in terms of tensile testing; engineering stress
ε in terms of calculating ionic conductivity; porosity of separator
η viscosity
υE crosslink density
μ mobility
CHAPTER 1
INTRODUCTION TO LITHIUM-ION BATTERIES
1.1 Introduction to Lithium-Ion Batteries
Lithium-ion (Li-ion) batteries are one of the most commonly used batteries in portable electronics such as cellphones and laptops. In contrast to primary batteries, which are non-rechargeable and disposable, Li-ion batteries belong in the family of secondary or non-rechargeable batteries, and therefore demonstrate drastically longer lifetimes. In addition, Li-ion batteries exhibit high energy density, slow loss in charge when not in use, and are significantly more lightweight than lead acid batteries. According to Frost & Sullivan, a global growth consulting firm that provides market research and analysis, the global Li-ion battery market was worth $11.7 billion in 2012 and is expected to double by 2016.1 While the handheld consumer segment currently dominates sales in this area, growth in this market is driven by the burgeoning
automotive and utility segments, as utilities are seeking to use Li-ion batteries as energy storage and smart grid solutions to improve efficiency and effectiveness (Figure 1.1).
1.1.1 Battery History, Terminology, and Chemistry
Nonrechargeable lithium (Li) batteries were first prepared by Dr. Michael Stanlay Wittingham while he was working for Exxon Research and Engineering Company in 1976. Dr. John Goodenough, from Oxford University then the University of Texas at Austin, expanded this work in 1979 by developing rechargeable lithium ion cells composed of lithium cobalt oxide (LiCoO2) and lithium metal as the cathode and anode respectively.2 This was the first
demonstration of cathode materials capable of reversible intercalation and stable donation of Li-ions. By 1991, Li-ion batteries containing LiCoO2 were commercially released by Sony and Asahi Kasei; LiCoO2 is now a ubiquitous material in today’s portable electronic devices.
Although the two terms “battery” and “cell” are often used interchangeably to describe an electrochemical storage system, it is important to note the differences especially for industrial and commercial applications. A “cell” or “battery cell” is a basic electrochemical unit that contains the fundamental components such as the electrodes, electrolyte and oftentimes the separator. Battery cells are most commonly found in cylinder, coin, prismatic, and flat
configurations (Figure 1.2). In contrast, a “battery”, also called a “battery pack”, is composed of a collection of cells, as well as the appropriate housing or casing, electrical interconnections and other types of electronics that control or stabilize the cells from overheating or overcharging. Larger applications such as laptops and zero emission vehicles use battery packs due to higher voltage requirements.
cathode, and carbon (in the form of graphite) as the anode. During the battery cell charge process, Li-ions move through the electrolyte from the positive electrode, the cathode, to the negative electrode, the anode. During the cell discharges, the direction of Li-ion migration is reversed, and Li-ions are intercalated back into LiCoO2 (Figure 1.3), thus providing current through a load. These processes can also be described in terms of the following electrochemical half-reactions:
LiCoO2 ⇄ Li1-nCoO2 + nLi+ + ne-………..equation 1.1 nLi+ + ne- + C ⇄ LiyC………....equation 1.2
Figure 1.2 Li-ion battery in various configurations as published by Armand and coworkers in Nature: (a) cylindrical (b) coin (c) prismatic or pouch unit, and (d) flat.3
Researchers continue to explore the use of materials other than LiCoO2 and graphite in order to improve the energy density, cost and durability of overall Li-ion batteries.
(LiMn2O4)5 and lithium iron phosphate (LiFePO4)6 as cathode materials. For anodes, silicon7 and lithium titanium oxide8 are also gaining popularity.
Figure 1.3 Schematic of the charge (left) and discharge (right) process of a lithium- ion battery.9
1.1.2 Concerns Regarding Battery Electrolytes
Material selection for Li-ion battery electrolytes is crucial as it acts as the media
separating the cathode and anode, and therefore must be physically and electrochemically stable against both oxidizing and reducing chemistries. As a source of Li-ions, electrolytes contain lithium salts with large polarizable, monovalent anions such as hexafluorophosphate (PF6-), perchlorate (ClO4-), and bis(trifluoromethane)sulfonimide (TFSI-).
Small molecule alkyl carbonates are currently the most commonly used liquid
under most operating conditions. The intrinsic instability of carbonate-based solvents increases at higher temperatures, where exothermic electrolyte breakdown can lead to thermal runaway,10,11 resulting in battery short-circuiting and ultimately catastrophic failure of the battery. While this failure rate stands at about 1 in 10 million systems, this rate is intolerable for large-scale
applications where catastrophic failure of one cell affects the operation of the battery pack as a whole; cost and user safety could also be heavily compromised. These safety issues were widely recognized when large Li-ion batteries were incorporated as back up power sources on aircraft; to date there have been at least five reported incidents of battery fires or smoke on the Boeing 787 Dreamliner passenger aircraft (Figure 1.4).12,13
Figure 1.4 Japan Airlines Boeing 787 Dreamliner at Boston Logan Airport with smoke from battery fire.14
1.1.3 Current Efforts in Electrolyte Research
liquids. As alternatives to liquid electrolytes, solid-state polymeric electrolytes and hybrid systems have also garnered much interest.
1.1.4 Liquid Electrolytes
1.1.4.1 Development of Fire Retardant Additives
Fire retardant additives studied for Li-ion battery electrolytes are most commonly organophosphates and their halogenated derivatives;15-18 these chemicals reduce electrolyte flammability by acting as chemical radical scavengers that terminate radical chain reactions leading to combustion.16,17 While effective, there is oftentimes a trade-off between electrolyte flammability and reductive stability since many phosphates degrade against low reductive potentials and therefore are incompatible with anodes such as graphite.15,17
In addition to phosphorus-based additives, small molecule ethers19-21 and fluorinated carbonates17,22,23 have also been reported. Because the lithium salt dissolution capabilities and electrochemical properties of these nonflammable molecules are limited, they must be diluted with traditional volatile carbonates and are strictly used as co-solvents. Elimination of flash point and flammability of the overall electrolyte is only achieved when fluorinated carbonates becomes the majority component.17
1.1.4.2 Room Temperature Ionic Liquids
and nonvolatile, which makes them of great interest in Li-ion battery research. However, the purity of RTILs is often an issue, as their moisture sensitivity significantly impacts their
conductivity. The high viscosity that is characteristic for ionic liquids (in some cases as high as 500-600cP)24,26 can also cause difficulties with handling, which subsequently increases cost.
Figure 1.5 Chemical structures of typical RTILs, as reported by Stępniak and coworkers in Electrochimica Acta.24
1.1.5 Solid-State Electrolytes
Dry polymer electrolytes are attractive alternatives to liquids due to the complete
backbone. There are two generally accepted mechanisms for ion transport in these materials: (i) the ion hopping mechanism where ions ‘hop’ from one region to the next, and (ii) the vehicular mechanism where the ion migrates with the solvation shell intact. In polymeric electrolytes, the latter is suppressed due to limited diffusion of polymer chains in entangled systems.28 Ion transport in macromolecular electrolytes is therefore dominated by rapid segmental motion of polymer chains that lead to intrachain or interchain hopping of ions (Figure 1.6). Since polymer segmental motion is reduced as temperatures approach the glass transition temperature (Tg) of the polymer, a low Tg is an important property to achieve when selecting suitable materials for solid electrolyte design. The melting temperature, Tm, however, is also a big shortcoming of PEO polymers; its semi-crystalline nature limits practical ionic conductivity to temperatures above melting (typically at around 60 °C). Although strategies used to mitigate crystallinity span from the use of nanoparticle fillers such as aluminum oxide (Al2O3), titanium dioxide (TiO2), and silicon dioxide (SiO2)3,29 to novel macromolecular architectures such as stars,30,31 combs,28 and dendrimers,32,33 research in this field has not been widely commercialized.
1.1.6 Hybrid Electrolytes and Other Systems
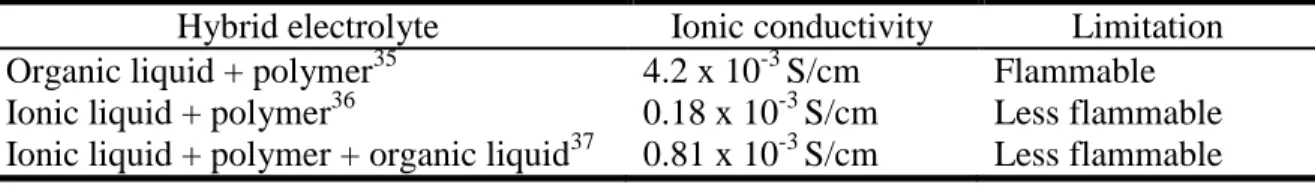
The disadvantages presented in each type of homogeneous electrolyte have led to the development of hybrid or composite materials aimed to simultaneously mitigate the limitations and combine the benefits of individual components. As a result, crosslinked polymer matrices are frequently swelled with organic carbonate solutions or ionic liquids (also known as gel electrolytes). Often, however, the drawbacks of each constituent are still observed. For example, organic carbonate additives are added to polymer matrices to increase ionic conductivity, but produces compositions that are still considered flammable (Table 1.1).27
Table 1.1 Example of hybrid electrolytes, as reported by Kim and coworkers in Chemistry of Materials.27
Hybrid electrolyte Ionic conductivity Limitation Organic liquid + polymer35 4.2 x 10⁻³ S/cm Flammable Ionic liquid + polymer36 0.18 x 10⁻³ S/cm Less flammable Ionic liquid + polymer + organic liquid37 0.81 x 10⁻³ S/cm Less flammable
1.2 Perfluoropolyethers
The development of polytetrafluoroethylene (PTFE) has since garnered heavy interest in perfluoro- or polyfluoro- alkyl compounds; due to the strength of C-F chemical bonds, these materials are widely known to be chemically and thermally inert. Within this family,
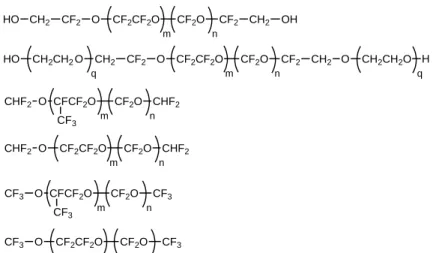
Figure 1.7 Different types of branched and linear PFPEs with various end group functionalities.
1.2.1 Methods Used to Synthesize PFPEs
1.2.1.1 Anionic Ring Opening Polymerization of Hexafluoropropylene Oxide
PFPEs are commonly synthesized by anionic ring-opening polymerization of hexafluoropropylene oxide (HFPO).39 Cesium fluoride (CsF) was reported to be the most effective source of fluoride anions because of its low lattice energy and highly ionic nature. However, in order to facilitate the formation of active fluoride ions, strongly coordinated solvents must be used, tetraglyme (TG) is therefore frequently used in conjunction to complex cesium cations in order to generate free fluoride ions. The fluoride ions subsequently react with HFPO monomers to initiate the reaction (Figure 1.8). Chain transfer reactions are the
predominant reactions under these conditions, and as a result only low molar mass PFPE oligomers are produced using this method.39-41
HO CH2 CF2 O CF2CF2O CF2O CF2 CH2 OH
m n
CHF2 O CF2O CHF2
m n
CF
CF3 CF2O
CHF2 O CF2CF2O CF2O CHF2
m n
O CH2 CF2 O CF2CF2O CF2O CF2 CH2 O
q m n q
CH2CH2O
CH2CH2 H
HO
CF3 O CF2O CF3
m n
CF
CF3 CF2O
CF3 O CF2CF2O CF2O CF3
Figure 1.8 Anionic ring opening of HFPO in the presence of CsF and TG.40
1.2.1.2 Direct Fluorination
The Lewis acid- catalyzed ring opening polymerization of 2,2,3,3-tetrafluorooxetane to synthesize PFPEs was first industrialized by Daikin Industries. 2,2,3,3-tetrafluorooxetane was first prepared from tetrafluoroethylene (TFE) and paraformaldehyde. Initiated by a fluoride ion, typically from CsF, 2,2,3,3-tetrafluorooxetane is subsequently polymerized in a nonprotic polar solvent like TG to produce a polyfluorinated polymer. The polymers are then treated with fluorine gas for direction substitution of the hydrogen atoms in the backbone; this process is accelerated by ultraviolet (UV) irradiation (Figure 1.9).42,43
Figure 1.9 Lewis acid catalyzed ring opening polymerization of 2,2,3,3-tetrafluorooxetane following by direct fluorination under UV light.39
TG -35 °C Cs+ + F- TG
F2C
O CF CF3
CsF +
CF3CF2CF2O
-Cs+, TG
+ n F2C
O CF CF3
+
F-+
Cs+, TG
CF2 O CF CF2O
-CF F
CF3 nCF3
CF2 O CF CF
CF F
CF3 nCF3
O + F
-CF3CF2CF2O
-H2C O CF2
F2C
+ F- CH
2 CF2CF2 O
-F
CH2 CF2CF2 O
-F +
H2C O
CF2 F2C
n F CH2 CF2CF2 O CH2 CF2CF2 O
-n
CH2 CF2CF2 O
F CH2 CF2CF2 O
-n
CH2 CF2CF2 O
F CH2 CF2CF2 n
O
CH2 CF2CF2 O
F CH2 CF2CF2
n
O F
2
hv
CHF CF2CF2 O
F CH2 CF2CF2 n
O
CH2 CF2CF2 O
F CH2 CF2CF2
n
O F2
Similarly, Lagow and coworkers44-46 developed a PFPE synthetic technique by direct fluorination of hydrogenated polyethers.39 Known as the ‘LaMar’ process, this method involves a cryogenic reactor, and allows a vast range of perfluorinated compounds to be prepared using low concentrations of fluorine.42,47
1.2.1.3 Photooxidation
The synthesis of PFPEs through photo-oxidative polymerization was first patented by Solvay Solexis.48 In general, TFE is polymerized at low temperatures in a controlled partial pressure of oxygen gas (Figure 1.10). Initiator radicals are produced by exposing allyl acyl fluorides to ultraviolet light within the wavelengths of 200 to 350nm at -40°C. Polymerization propagation consists of rotating processes of oxygen gas (O2) addition, coupling of two alkoxy radicals that releases O2, and addition of TFE. Inevitable β-scission side reactions of perfluoro-ethoxy radicals, favored in higher temperatures, produce perfluoro-mperfluoro-ethoxy radicals and carbonyl fluoride. This results in random insertions of perfluoromethoxy units along the backbone of PFPE polymers. The propagating radicals are considered terminated when alkoxy radicals couple to produce interior peroxy units. Termed peroxidic perfluoropolyethers, the polymer chains are cleaved thermally or through catalytic reduction to produce the PFPE
material functionalized with acyl fluorides on both terminal ends. Subsequent reactions of these highly reactive terminal groups allow for PFPEs to be functionalized with a variety of chemical moieties including hydroxyl groups.49 Relative concentrations of initiator, oxygen, and
tetrafluoroethylene are used to control and tune the average molecular weight of the final polymer; fluorine gas is also oftentimes used. Ratios of perfluoromethylether to
Figure 1.10 Synthetic schemes outlining the initiation, propagation, and termination of PFPE polymerization.49 F O CF2 CF2
hv (200-350 nm) - 40°C F O CF2 O2 F O CF2 O2 F O CF2 O2 2 F O CF2 O
2 + O
2
Initiation
F O
CF2
O + CF2 CF2
F O CF2 O CF2 CF2
P = PFPE Polymer
O CF2
CF2
P
O2 O
CF2
CF2
P O2
O CF2
P
O2 O
CF2 O2 P O CF2 CF2
P O2
2 OCF2
CF2
P O + O2
2
2 2 + O2
O CF2
O2
P OCF2
O P Coupling O CF2 CF2
P O2 +
O CF2
O2
P OCF2
CF2
P O + OCF2
O
P + O2
O CF2 CF2 P O O CF2 O P
+ CF2 CF2
P OCF2
CF2
OCF2CF2
+ CF2 CF2
P OCF2
O CF2
CF2
Addition of Tetrafluoroethylene
O CF2
CF2
P O P OCF2
b-Scission + O F F Propagation Termination
Peroxidic PFPE Formation
O CF2
CF2
P O
2 OCF2
CF2
P O
2 OCF2
O
P OCF2
O P
OCF2CF2
O P
O CF2
CF2
P O + OCF2
O P O CF2 O P O CF2 CF2
P O OCF2O P
Catalytic Reduction
CF2 O O
CF2
H2, cat.
P OCF2 2
CF2 O P CF2
O
P CF2
O H
P OCF2 CF2
O H P OCF2
C O
Our group has also previously developed a synthetic method for PFPEs through the photooxidation of HFP in liquid carbon dioxide. This strategy provides an environmentally friendly alternative to organic and fluorinated solvent systems such as dichlorodifluoromethane and exploit the benefits of utilizing an environmentally friendly and tunable continuous
phase.39,50,51
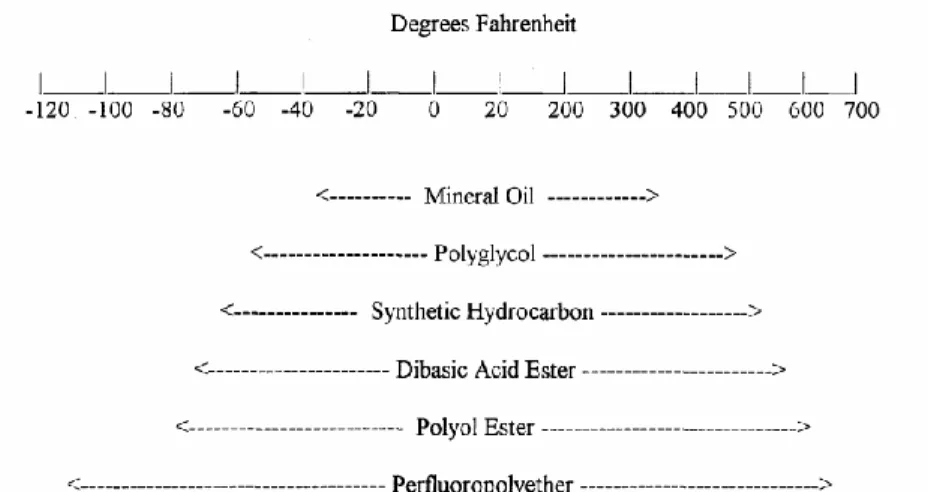
1.2.2 PFPE Uses and Applications
Figure 1.11 Temperature range of use of PFPEs relative to other lubricants and oils.53
Figure 1.12 Microchannel section and sidewall of PFPE microfluidic device (left); PFPE device filled with colored water-based solution (as reported by Bongiovanni and coworkers in
Langmuir).54
Figure 1.13 Density of attached spores of Ulva on PDMS and PFPE elastomers containing sPFPE and sPFPE with 10% SS after a 1h settlement period, as reported by DeSimone and
coworkers in Macromolecules. Bars show 95 % confidence limits.66
Figure 1.15 Final density of attached diatoms on PFPE/PEG coatings. Bars show 95% confidence limits, as reported by DeSimone and coworkers in Biofouling.65
1.3 Techniques for Electrolyte Characterization
1.3.1 Physical and Thermal Characterization
For electrolytes, important physical and thermal properties include degree of lithium salt dissolution, thermal stability, and viscosity. Lithium salt dissolution is commonly measured qualitatively through visual observation (solubility frequently leads to production of clear colorless solutions) or quantitatively using mass spectroscopy. On the other hand, thermal stability and viscosity require more analytical experimentation. Thermal stability, an important indication of a material’s robustness, against a wide range of temperatures when incorporated into a full battery, is usually characterized using thermogravimetric analysis (TGA) and differential scanning calorimetry (DSC) methodologies. In addition to these two techniques, electrolyte flammability is also characterized through a variety of methods.
1.3.1.1 Thermogravimetric Analysis
amount and rate of change in a sample’s mass as a function of temperature or time in a controlled rate and atmosphere. Because materials tend to experience sample weight loss as a result of degradation or evaporation, changes in initial measured mass indicate valuable information regarding the stability, purity, and composition of materials. For example if a material that exhibits negligible or no mass change between 50 and 200 °C, this indicates that it is thermally stable within that temperature range. Furthermore, TGA is able to determine compositional analysis of blends or multicomponent samples based on the known characteristic vaporization temperatures of pure components.67
1.3.1.2 Different Scanning Calorimetry
Similarly, DSC is a fundamental physical characterization method used to study the thermal behavior of materials.68 One of the most important tools of DSC techniques is the determination of the first and second order transitions in polymers, which corresponds to the Tm (and Tc), and Tg respectively.
Experimentally, a typical DSC experiments treats a small quantity of sample enclosed in a pan to a controlled temperature program, pressure and atmosphere and monitors heat effects relative to a reference sample. The reference is usually an inert material or empty pan made out of aluminum. The different in heat flow, that is, the heat absorbed by the material in a unit of time (𝑑𝐻𝑑𝑡), is then monitored as the temperature of both the sample and the reference changes at a constant rate. In other words:69
∆𝑑𝐻𝑑𝑡
=
(𝑑𝐻𝑑𝑡)𝑠𝑎𝑚𝑝𝑙𝑒
−
( 𝑑𝐻𝑑𝑡)𝑟𝑒𝑓𝑒𝑟𝑒𝑛𝑐𝑒………...…..equation 1.3
and exothermic processes like crystallization result in a sudden positive and negative difference in heat flow respectively. On the other hand, second order processes such as glass transitions result in a broader increase or decrease in heat flow difference due to changes in the polymer’s heat capacity below and above Tg (Figure 1.16).
Figure 1.16 Sample DSC curve illustrating the Tg, Tc and Tm of a sample.70
1.3.1.3 Flammability Tests
In order to determine the flammability of electrolytes, a variety of flame tests can be used; literature reports methods spanning from standardized flash point71,72 and sustained burning tests72 to customized ignition test set ups15,18 (Figure 1.17). For example, an instrument in accordance to the American Society of Testing and Materials (ASTM) is commonly used; Figure 1.18 is a schematic of an apparatus used to measure sustained burning of liquid materials in an open cup at a controlled temperature and pressure, a protocol known as ASTM D4206.73 On the other hand, custom-built set ups commonly forego the use of an instrument and quantify flammability by describing thermal responses when a material is exposed to flame and
Figure 1.17 Example of a customized ignition test involving exposing a flame to an electrolyte-soaked membrane.74
Figure 1.18 Sample apparatus of sustained burning test in accordance with ASTM D4206.73
1.3.1.4 Viscosity
𝜎 =𝑛𝑒𝑘𝑇2𝐷…………..……….equation 1.4
𝐷 =6𝜋𝑟𝜂𝑘𝑇 ………...…….…equation 1.5 where n is the number density of charge carriers, e is the electronic charge, k is the Boltzmann’s constant, T is the temperature, D is the diffusion coefficient, and r is the effective radius of the diffusing species. Therefore, low viscosity materials tend to result in higher conductivity due to enhancement of Li-ion diffusion and migration.75
Understanding viscosity behavior of electrolytes is also crucial in determining wetting time in the assembly of full batteries. Electrodes must be fully wetted with the electrolyte in order to achieve full electrode capacity potential. Insufficient time allotted for viscous electrolytes to wet the electrode surface tends to deteriorate Li-ion battery performance and shorten battery cycle life.76 Conventional small molecular alkyl carbonates exhibit dynamic viscosities as low as 1.7 - 3.0 cP at 25 °C.77
Although the glass capillary viscometer is traditionally one of the most common instruments used to measure kinematic viscosity (related to dynamic viscosity through the sample’s density), the use of advanced rotational rheometers is becoming increasingly popular.
1.3.2 Characterization of Elastomers
Mechanical stability, or a material’s ability to withstand mechanical deformation and stress, is not only important for solid-state electrolytes in wearable and flexible batteries, but also affects dendrite growth in electrolyte-electrode interfaces; studies have shown that the
stress-strain curves as well as the determination of the Young’s Modulus, E. The process involves applying a controlled force to elongate a test specimen along a direction until it fractures. The measured elongation is used to calculate the engineering strain, ε, using the equation:
𝜀 =𝐿−𝐿0
𝐿0 ………..…….equation 1.6
where L and L0 is the final and initial length respectively. In response to an applied force, the
engineering stress, σ, is determined with the equation:
𝜎 =𝐹𝐴𝑛…………...………..……equation 1.7 where Fn and A is the tensile force and cross-sectional area of the sample respectively.80
Measured stress and strain points are graphed into stress-strain curves (Figure 1.19). The
Young’s modulus, or tensile modulus, a properties used to characterize stiffness, is subsequently calculated using the equation:
𝐸 =𝜎𝜀………...………...…….equation 1.8
1.3.3 Electrochemical Characterization
Extensive electrochemical characterization describes the behavior of an electrolyte and dissolved lithium salt in the presence of voltage and probes an electrolyte’s short- and long- term viability as a reliable component of marketable Li-ion batteries. Important properties range from ionic conductivity and capacitance retention in batteries to more complex understanding of ion movement through Li-ion transference numbers.
1.3.3.1 Ionic Conductivity
Ionic conductivity, σ, is one of the most extensively studied properties for electrolytes for Li-ion batteries. It is a measure of an electrolyte’s ability to conduct electricity and the mobility and speed of ions through the media. Sufficient ionic conductivities over wide temperature ranges must be achieved in order to obtain practical battery performance for portable electronics and transportation applications. Currently, state-of-the-art carbonate-based electrolytes exhibit ionic conductivities on the order of 3.4 – 11.1 mS/cm.77
Ionic conductivity is determined by measuring the resistance, R, between two electrodes at a fixed distance, then calculated using the equation:
σ = 𝑅∙𝐴𝐿
𝑒𝑓𝑓………..equation 1.9
here; however it is important to note that potentiostats display EIS behavior in the form of Nyquist plots (Figure 1.20), from which resistance can be extracted from the x-intercept of the lowest radial frequency.
Figure 1.20 Sample Nyquist plot obtained from EIS.83
1.3.3.2 Electrochemical Window
formation of the SEI layer is commonly deemed a vital process in batteries, it oftentimes lack in film thickness consistency and structure homogeneity throughout the battery, ultimately and inevitably leading in an increase in cell internal impedance over time, causing reduction in capacity and cycle life.84
1.3.3.3 Battery Performance
If an electrolyte exhibits practical ionic conductivity, the material can be coupled with electrodes and a separator in an assembled battery cell for further battery testing; the construction and components of a coin cell battery is shown in Figure 1.21. Characterization of Li-ion cells usually involves galvanostatic charges and discharges at various cycles and charge rates. During galvanostatic cycling, cells are cycled within a potential range depending on the electrochemical and redox stability of the electrolyte and electrodes. Charges and discharge current is often expressed as the charge rate or C-rate, calculated from the theoretical energy capacity of the electrodes; the C-rate is a measure of the rate required for a cell to be charged or discharged and the maximum capacitance achievable at that rate.85 For example, a C-rate of 20 C indicates the necessary current applied or drained from the cell in order to completely charge or drain in 20 hours (Figure 1.22).
Figure 1.22 Sample galvaonostatic cycling of a battery cell between 2.75 V and 4.25 V at a C-rate of 20 C.
1.3.4 Lithium-Ion Transference Number
Full electrochemical characterization of battery electrolytes would not be complete without a measure of charge transport, which includes determination of ion transference numbers, also known as t+. Only Li-ions are pertinent to cell charge and discharge; however, ionic conductivity measurements include mobility of both ionic species, the Li-ion and its counterion, Li-ion transference numbers are a more specific property that is defined as the contribution of total ionic conductivity that originates solely from Li-ions. In other words, it is the fraction of current contributed by the mobility of Li-ions, and is therefore a value between 0 and 1.
The concept of t+’s is important when considering the long-term performance of a battery cell. Electrolytes exhibiting low t+’s cause concentration gradients of the lithium salt to develop over time, which ultimately leads to poor high-rate performance and limitations in cell power output.86 In fact, studies have suggested that electrolytes exhibiting high t+’s are far superior in applications that require a high discharge rate than electrolytes with low t+’s, even when the conductivity of the materials is reduced by over an order of magnitude.87 Li-ion t+’s closest to unity, are therefore highly desired.
Four acceptable techniques for t+ measurements exist in the literature for nonaqueous electrolytes: the potentiostatic polarization method, galvanostatic polarization method, electromotive force method, and pulsed-field gradient (pfg) NMR method.
1.3.4.1 Lithium-Ion Transference Number Using Pulsed Field Gradient NMR
Pfg-NMR is an experiment in the family of diffusion NMR techniques used to characterize long-range translational motion of a molecular or ionic species. This method couples radio-frequency pulses used in conventional NMR experiments with magnetic field gradients to extract spatial information along the Z-direction of the sample tube.88 The concepts and theory regarding NMR and pfg-NMR is well studied, and will therefore not be described extensively herein. In brief, a typical pfg-NMR experiment involves application of a series of pulses at increments of increasing gradient strength and recording the intensity of the signals of interest as a function of magnetic field gradient strength (Figure 1.23).
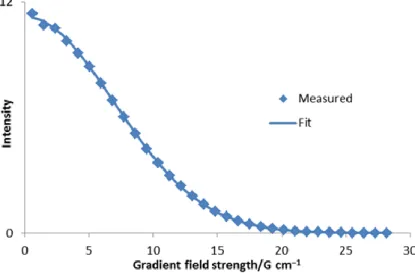
Using intensity information from diffusion spectra, a plot of intensity as a function of gradient strength can be plotted (Figure 1.24). Diffusion can then be calculated by fitting the plot curve using the equation:89
𝐼 = 𝐼0𝑒−𝐷𝛾
2𝑔2𝛿2(∆−𝛿
3)…………..………equation 1.10
Figure 1.23 Sample diffusion spectrum of two signals decaying in intensity as magnetic field gradient strength increases.90
Figure 1.24 Sample plot of diffusion peak intensity as a function of gradient field strength.90
The t+ is ultimately calculated from determination of t+ for both the lithium cation and counterion, and is described as
𝑡+ = 𝐷+
𝐷++𝐷−………equation 1.11
where D+ and D- is the self diffusion coefficient of the cation and anion respectively. It is important to note that transference number measured using pfg-NMR methods tend to
increase in accuracy only in dilute samples of lithium salt in the electrolyte. Alternatively, methods have been developed to determine the degree of salt dissociation and decouple measure diffusion coefficients from neutral ion pairs from solvated lithium ionic species.8691,92 More details regarding pfg-NMR experiments are discussed in Chapter 5.
1.3.4.2 Other Methods of Measuring Li-ion t+’s
As previously mentioned, the other methods of measuring Li-ion t+’s in addition to pfg-NMR are the potentiostatic polarization method, galvaostatic polarization, and electromotive force method.
1.3.4.2.1 Potentiostatic Polarization
The potentiostatic polarization method, first reported by Dr. Peter Bruce and Dr. Colin Vincent, was developed to measure cationic t+’s in ideal solid polymer electrolytes.86,93
However, this method is also suitable for liquid solutions with diluted concentrations of lithium salt.86,94 In brief, the concept behind this method is to establish an electrochemical steady-state within a cell composed of the electrolyte of interest and two lithium metal electrodes.
Application of a small constant potential on the electrolyte results in a decrease of the initial current value until a steady-state value is reached. In the absence of redox reactions, the current contributed by the anion will diminish in the steady-state, leaving behind current only
contributed by the cations.93 The t+ of the electrolyte can then be calculated by the fraction of steady-state cationic current in the initial total current:86,95
𝑡+ = 𝐼𝑠𝑠(∆𝑉−𝐼0𝑅0)
𝐼0(∆𝑉−𝐼𝑆𝑆𝑅𝑆𝑆)……….equation 1.12
where ISS is the stead-state current, I0 is the initial current, ∆𝑉 is the applied potential, 𝑅0 is the
The potentiostatic method is a relatively quick measurement, but is restricted to dilute samples and binary electrolytes (only one cationic and anionic species).
1.3.4.2.2 Galvanostatic Polarization
In 1995 Dr. John Newman and coworkers established a procedure using galvanostatic polarization for polymer electrolytes with concentrated lithium salt. This method combines three different parameters to calculate the t+: (i) the cell potential after galvanostatic polarization, (ii) salt diffusion coefficient, and (iii) concentration dependence of the potential difference. The cationic t+ can then be calculated through the equation:86,96,97
𝑡+ = 1 − 𝑚𝐹𝑐∞√𝜋𝐷
4(𝑑Φ 𝑑𝑙𝑛 𝑐⁄ )……….equation 1.13
where 𝑐∞ is the bulk salt concentration, F is the Faraday constant, D is the salt diffusion
coefficient, 𝑑Φ⁄𝑑𝑙𝑛 𝑐 is the concentration dependence of the potential Φ and m is the slop of the plot of cell potential as a function of current density and polarization time. Although this method is relatively more accurate than the potentiostatic polarization method and is capable of
measuring concentrated electrolytes, the determination of three separate parameters is often time consuming.
1.3.4.2.3 Electromotive Force Method
Li | LiX(𝑚1) ∥ LiX(𝑚2)| Li……….equation 1.14
where LiX is the lithium salt in the electrolyte, and m1 and m2 are different salt concentrations, commonly expressed in molalities (mol/kg).86 In such concentration cell, the potential difference Etrans is described as
𝐸𝑡𝑟𝑎𝑛𝑠 = −2𝑅𝑇𝐹 𝑡−𝑙𝑛𝑚𝑚2
1……….……….equation 1.15
where R is the ideal gas constant, T is the temperature, F is the Faraday constant, and t- is the anionic transference number for the lithium counterion in the electrolyte.86 Following several measurements of the potential difference at various concentrations, a salt bridge is applied to the concentration cell between the sample solution and reference electrode, reducing the diffusion potential close to zero.98 The resulting potential E is therefore
𝐸 = −2𝑅𝑇𝐹 𝑙𝑛𝑚2
𝑚1……….…….equation 1.16
From the previous two equations t- can be calculated as
𝑡− =d𝐸𝑡𝑟𝑎𝑛𝑠
d𝐸 ……….equation 1.17
t- can then be interpreted as the slope of a plot of Etrans as a function of E at different lithium salt concentrations (Figure 1.25). From determination of t- the cationic t+can then be simply
REFERENCES (1) Carella, C. In Frost & Sullivan London 2013.
(2) Mizushima, K.; Jones, P. C.; Wiseman, P. J.; Goodenough, J. B. Materials Research Bulletin 1980, 15, 783.
(3) Tarascon, J. M.; Armand, M. Nature 2001, 414, 359. (4) O'Dell, J. In Green Car Advisor 2008.
(5) Loveday, E. In Green Car Advisor 2010.
(6) Bulkeley, W. M. In The Wall Street Journal 2005. (7) Newman, J. In Time 2013.
(8) Anthony, S. In ExtremeTech 2014.
(9) Brain, M. http://electronics.howstuffworks.com/everyday-tech/lithium-ion-battery.htm, 2006.
(10) Hammami, A.; Raymond, N.; Armand, M. Science 2003, 301, 635.
(11) Mandal, B. K.; Padhi, A. K.; Shi, Z.; Chakraborty, S.; Filler, R. Journal of Power Sources 2006, 161, 1341.
(12) Cooper, A. In CNN 2013. (13) In BBC News 2014
(14) Stibbe, M. In Forbes 2013.
(15) Wu, L.; Song, Z.; Liu, L.; Guo, X.; Kong, L.; Zhan, H.; Zhou, Y.; Li, Z. Journal of Power Sources 2009, 188, 570.
(16) Granzow, A. Accounts of Chemical Research 1978, 11, 177. (17) Zhang, S. S. Journal of Power Sources 2006, 162, 1379.
(18) Xu, K.; Ding, M. S.; Zhang, S.; Allen, J. L.; Jow, T. R. Journal of The Electrochemical Society 2002, 149, A622.
(20) Ohmi, N.; Nakajima, T.; Ohzawa, Y.; Koh, M.; Yamauchi, A.; Kagawa, M.; Aoyama, H. Journal of Power Sources 2013, 221, 6.
(21) Nagasubramanian, G.; Orendorff, C. J. Journal of Power Sources 2011, 196, 8604.
(22) Smart, M. C.; Ratnakumar, B. V.; Ryan-Mowrey, V. S.; Surampudi, S.; Prakash, G. K. S.; Hu, J.; Cheung, I. Journal of Power Sources 2003, 119-121, 359.
(23) Moller, K.-C.; Hodal, T.; Appel, W. K.; Winter, M.; Besenhard, J. O. Journal of Power Sources 2001, 595.
(24) Galiński, M.; Lewandowski, A.; Stępniak, I. Electrochimica Acta 2006, 51, 5567. (25) Wasserscheid, P.; Keim, W. Angew. Chem. Int. Ed. 2000, 3772.
(26) Sun, J.; Forsyth, M.; MacFarlane, D. R. J. Phys. Chem. B 1998, 8858. (27) Goodenough, J. B.; Kim, Y. Chemistry of Materials 2010, 22, 587.
(28) Sun, J.; Stone, G. M.; Balsara, N. P.; Zuckermann, R. N. Macromolecules 2012, 45, 5151.
(29) Croce, F.; Appetecchi, G. B.; Persi, L.; Scrosati, B. Nature 1998, 394, 456. (30) Niitani, T.; Amaike, M.; Nakano, H.; Dokko, K.; Kanamura, K. Journal of The Electrochemical Society 2009, 156, A577.
(31) Nishimoto, A.; Watanabe, M.; Ikeda, Y.; Kohjiya, S. Electrochimica Acta 1998, 43, 1177.
(32) Hawker, C. J.; Chu, F.; Pomery, P. J.; Hill, D. J. T. Macromolecules 1996, 29, 3831.
(33) Watanabe, M.; Hirakimoto, T.; Mutoh, S.; Nishimoto, A. Solid State Ionics 2002, 148, 399.
(34) Gray, F. M. Polymer Electrolytes The Royal Society of Chemistry Cambridge, 1997.
(35) Appetecchi, G. B.; Croce, F.; Marassi, R.; Persi, L.; Romagnoli, P.; Scrosati, B. Electrochimica Acta 1999, 45, 23.
(37) Sirisopanaporn, C.; Fernicola, A.; Scrosati, B. Journal of Power Sources 2009, 186, 490.
(38) Solvay Solexis: Italy 2002.
(39) Kelly, J. Y., University of North Carolina at Chapel Hill, 2008. (40) Kostjuk, S. V.; Ortega, E.; Ganachaud, F.; Ameduri, B.; Boutevin, B. Macromolecules 2009, 42, 612.
(41) Ebnesajjad, S. Fluoroplastics, Volume 1: Non-Melt Processible Fluoropolymers - The Definitive User's Guide and Data Book; Elsevier Waltham 2000.
(42) Joel, A. K., Durham University, 1992.
(43) Banks, R. E.; Smart, B. E.; Tatlow, J. C. Organofluorine Chemistry: Principles and Commercial Applications; Plenum Press New York 1994.
(44) Lagow, R. J.; Margrave, J. L. Prog. Inorg. Chem. 1979, 26, 161.
(45) Lagow, R. J.; Margrave, J. L. J. Polym. Sci. Polym. Lett. Edn. 1974, 12, 777. (46) Lagow, R. J.; Margrave, J. L. J. Fluorine Chem. 1970, 4, 371.
(47) Ameduri, B.; Boutevin, B. Well-Architectured Fluoropolymers: Synthesis, Properties, and Applications; Elsevier Amsterdam 2004.
(48) Marchionni, G., Guarda, P.A. ; Solvay Solexis: 2005; Vol. European Patent 1 568730 A1.
(49) Lorenzo, R. A. D., University of Toronto 2012.
(50) Bunyard, W. C.; Romack, T. J.; DeSimone, J. M. Macromolecules 1999, 32, 8224.
(51) Du, L.; Kelly, J. Y.; Roberts, G. W.; DeSimone, J. M. J. of Supercritical Fluids
2009, 47, 447.
(52) Kaldonski, T.; Wojdyna, P. P. Journal of KONES Powertrain and Transport
2011, 18, 163.
(53) Fowzy, M. A. PFPE, A Unique Lubricant for a Unique Application Castrol Industrial North America 1998.
(55) Vitale, A.; Quaglio, M.; Cocuzza, M.; Pirri, C. F.; Bongiovanni, R. European Polymer Journal 2012, 48, 1118.
(56) Pantini, G. Clinics in Dermatology, 26, 387.
(57) Gola, M.; Sansotera, M.; Navarrini, W.; Bianchi, C. L.; Gallo Stampino, P.; Latorrata, S.; Dotelli, G. Journal of Power Sources 2014, 258, 351.
(58) Rolland, J. P.; Van Dam, R. M.; Schorzman, D. A.; Quake, S. R.; DeSimone, J. M.; Journal of the American Chemical Society 2004, 126, 2322.
(59) Hampton, M. J., Williams, S.S., Zhou, Z., Nunes, J., Ko, D.-H., Templeton, J.L., Samulski, E.T., DeSimone, J.M. Adv Mater 2008, 2667.
(60) Schulte, V. A.; Hu, Y.; Diez, M.; Bünger, D.; Möller, M.; Lensen, M. C. Biomaterials 2010, 31, 8583.
(61) Stobie, N.; Duffy, B.; Hinder, S. J.; McHale, P.; McCormack, D. E. Colloids and Surfaces B: Biointerfaces 2009, 72, 62.
(62) Kim, J.; Rolland, J. P.; Carbonell, R. G.; DeSimone, J. M. Chemistry of Materials
2010, 22, 2411.
(63) Hu, Z.; Finlay, J. A.; Chen, L.; Betts, D. E.; Hillmyer, M. A.; Callow, M. E.; Callow, J. A.; DeSimone, J. M. Macromolecules 2009, 42, 6999.
(64) Hu, Z.; Chen, L.; Betts, D. E.; Pandya, A.; Hillmyer, M. A.; DeSimone, J. M. Journal of the American Chemical Society 2008, 130, 14244.
(65) Wang, Y.; Pitet, L. M.; Finlay, J. A.; Brewer, L. H.; Cone, G.; Betts, D. E.;
Callow, M. E.; Callow, J. A.; Wendt, D. E.; Hillmyer, M. A.; DeSimonea, J. M. Biofouling 2011, 27, 1139.
(66) Hu, Z. K.; Finlay, J. A.; Chen, L.; Betts, D. E.; Hillmyer, M. A.; Callow, M. E.; Callow, J. A.; DeSimone, J. M. Macromolecules 2009, 42, 6999.
(67) Sichina, W. J.; Perkin Elmer Instruments. (68) Gregorova, A.; InTech: 2013.
(69) Colby College: http://www.colby.edu/chemistry/PChem/lab/DiffScanningCal.pdf, 2007.