Energy &
Environmental
Science
rsc.li/ees ISSN 1754-5706 REVIEW ARTICLEYuekun Lai, Zhiqun Lin et al.
Graphene aerogels for efficient energy storage and conversion Volume 11 Number 4 April 2018 Pages 719-1000
Energy &
Environmental
Science
This is an Accepted Manuscript, which has been through the Royal Society of Chemistry peer review process and has been accepted for publication.
Accepted Manuscripts are published online shortly after acceptance, before technical editing, formatting and proof reading. Using this free service, authors can make their results available to the community, in citable form, before we publish the edited article. We will replace this Accepted Manuscript with the edited and formatted Advance Article as soon as it is available.
You can find more information about Accepted Manuscripts in the
Information for Authors.
Please note that technical editing may introduce minor changes to the text and/or graphics, which may alter content. The journal’s standard
Terms & Conditions and the Ethical guidelines still apply. In no event shall the Royal Society of Chemistry be held responsible for any errors or omissions in this Accepted Manuscript or any consequences arising from the use of any information it contains.
Accepted Manuscript
This article can be cited before page numbers have been issued, to do this please use: S. Jin, M. Wu, R. G. Gordon, M. J. Aziz and D. Kwabi, Energy Environ. Sci., 2020, DOI: 10.1039/D0EE01834A.
CO2 emission primarily from fossil fuel combustion is causing climate change at an alarming
rate. Carbon capture and sequestration (CCS) has attracted R&D investment due to its potential
to remove CO2 from combustion exhaust. Although pilot-scale amine-based CCS at fossil-fired
power plants has been demonstrated, the required heat input and the associated amine degradation and evaporative losses at elevated temperature may hinder its wide application.
Here we present an electrochemically driven CO2 separation approach that relies on a solution
pH swing driven by the proton-coupled electron transfer (PCET) of small molecules, and requires electrical but no thermal input. Electrochemical reduction of these molecules
de-acidifies an aqueous solution, which then absorbs CO2; subsequent electrochemical oxidation of
the reduced molecules acidifies the solution, triggering the release of pure CO2 gas. Our analysis
suggests the minimum electrical work input of this approach is 16-75 kJ/molCO2, depending on
the throughput, for both CO2 separation from air and a typical flue gas with 0.1 bar CO2. We
demonstrate this approach experimentally using a flow cell with an aqueous-soluble
phenazine-based electrolyte that undergoes PCET. The resulting energy cost of 47 kJ/molCO2 in the
low-current-density limit is compared to other methods.
Energy
&
Environmental
Science
Accepted
Manuscript
1 pH Swing Cycle for CO2 Capture Electrochemically Driven through Proton-Coupled
2 Electron Transfer
3
4 Shijian Jin†, Min Wu†, Roy Gordon‡, Michael J. Aziz†* and David G. Kwabi†§ 5
6 † John A. Paulson School of Engineering and Applied Sciences, Harvard University, Cambridge,
7 Massachusetts, 02138, United States
8
9 ‡Department of Chemistry and Chemical Biology, Harvard University, Cambridge,
10 Massachusetts 02138, United States
11
12 *maziz [at] harvard [dot] edu
13 §Present address: Department of Mechanical Engineering, University of Michigan, Ann Arbor MI
14 48109 USA. dkwabi [at] umich [dot] edu
15 16
17 Abstract
18
19 We perform a thermodynamic analysis of the energetic cost of CO2 separation from flue gas
20 (0.1 bar CO2(g)) and air (400 ppm CO2) using a pH swing created by electrochemical redox 21 reactions involving proton-coupled electron transfer from molecular species in aqueous electrolyte. 22 In this scheme, electrochemical reduction of these molecules results in the formation of alkaline 23 solution, into which CO2 is absorbed; subsequent electrochemical oxidation of the reduced 24 molecules results in the acidification of the solution, triggering the release of pure CO2 gas. We 25 examined the effect of buffering from the CO2-carbonate system on the solution pH during the 26 cycle, and thereby on the open-circuit potential of an electrochemical cell in an idealized four-27 process CO2 capture-release cycle. The minimum work input varies from 16 to 75 kJ/molCO2 as 28 throughput increases, for both flue gas and direct air capture, with the potential to go substantially 29 lower if CO2 capture or release is performed simultaneously with electrochemical reduction or 30 oxidation. We discuss the properties required of molecules that would be suitable for such a cycle. 31 We also demonstrate multiple experimental cycles of an electrochemical CO2 capture and release 32 system using 0.078 M sodium 3,3'-(phenazine-2,3-diylbis(oxy))bis(propane-1-sulfonate) as the 33 proton carrier in an aqueous flow cell. CO2 capture and release are both performed at 0.465 bar at 34 a variety of current densities. When extrapolated to infinitesimal current density we obtain an 35 experimental cycle work of 47.0 kJ/molCO2. This result suggests that, in the presence of a 0.465 36 bar/1.0 bar inlet/outlet pressure ratio, a 1.9 kJ/molCO2 thermodynamic penalty should add to the
37 measured value, yielding an energy cost of 48.9 kJ/molCO2 in the low-current-density limit. This
Energy
&
Environmental
Science
Accepted
Manuscript
38 result is within a factor of two of the ideal cycle work of 34 kJ/molCO2 for capturing at 0.465 bar 39 and releasing at 1.0 bar. The ideal cycle work and experimental cycle work values are compared 40 with those for other electrochemical and thermal CO2 separation methods.
41
42 Introduction 43
44 Accumulating CO2 emissions from the burning of fossil fuels1 are resulting in a historically 45 unprecedented rate of climate change. Consequently, there are increasing efforts worldwide to 46 reduce societal reliance on fossil fuel-based energy and to switch to carbon-free sources such as 47 nuclear, solar, wind and geothermal.2 According to the Intergovernmental Panel on Climate 48 Change, average atmospheric CO2 concentrations have to stay below roughly 500 ppm in order to 49 avoid severe consequences of global warming (greater than 2 °C above pre-industrial era levels) 50 and irreversibly deleterious changes to natural habitats and ecosystems that would threaten the 51 viability of human civilization.3 Given, however, that the global rate of transition to low-carbon 52 sources is presently not nearly fast enough to avoid this threshold, other approaches are urgently 53 required to deal with the problem of rising CO2 concentrations.
54
55 Among the most promising of these is carbon capture and sequestration (CCS), in which CO2
56 is separated from a point source4 (e.g. flue gas from a coal or natural gas power plant), compressed, 57 and sequestered away from the atmosphere. A variant on this idea is direct air capture (DAC),5 in 58 which CO2 is captured directly from ambient air, compressed and sequestered. These strategies 59 recognize the continued use of fossil fuels while combating atmospheric CO2 accumulation. In 60 principle, the pure CO2 obtained after separation can be converted back into chemical fuels with 61 carbon-free energy, thus providing fuels without added CO2 emissions; this is an active research
62 area.
63
64 CO2 separation from mixed gases is the most energetically demanding step of CCS, and much
65 effort has gone into developing separation techniques that expend as little energy as possible per 66 unit of CO2 captured. Most well-developed means for doing so are “temperature-swing” cycles 67 that involve contacting CO2 with a strongly basic sorbent in an absorption process, and then heating
68 the CO2-rich sorbent to release pure CO2 and regenerate the sorbent. The overall heat input required
Energy
&
Environmental
Science
Accepted
Manuscript
69 for sorbent regeneration in temperature-swing cycles, however, is high (> 100 kJ/molCO2) as
70 compared to the minimum thermodynamic free energy requirement for carbon capture from air
71 (20 kJ/molCO2) or flue gas with 0.1 bar CO2 (6 kJ/molCO2).6 It is worth noting that CCS from flue 72 gas with a monoethanolamine (MEA)-based liquid sorbent would require roughly 30% of the heat
73 energy produced by coal-powered plants from combustion to be consumed by carbon capture,4
74 thereby making it unavailable for electricity production. Although the energy consumption of 75 amine-based technologies has been improved with functionalized solvents,7 amine blends,8 water-76 lean systems7, 9, 10 etc., and several power plants with more than 1000 tonne CO
2/day uptake 77 capacity have been demonstrated for post-combustion capture,11, 12 other limitations such as 78 sorbent degradation, evaporative losses, toxicity, and corrosivity raise concerns for wide 79 application.9 As a result, other CO
2 capture sorbents and strategies are actively being explored both 80 in fundamental research and industry.
81
82 The use of hydroxide (OH-) in alkaline aqueous solutions to capture CO
2, in the reactions 𝑂𝐻― 83 +𝐶𝑂2→𝐻𝐶𝑂3― and, subsequently, 𝐻𝐶𝑂3― + 𝑂𝐻―→𝐶𝑂23― + 𝐻2𝑂, has received renewed 84 interest in recent years as part of a viable separation approach. DAC using strongly alkaline (pH > 85 14) solution to absorb CO2 in a high-surface-area contactor, followed by a chemical regeneration 86 cycle that uses thermal energy to subsequently release it from solid carbonate precipitates,13, 14 has 87 begun commercialization. This process has an energetic cost that is comparable to that of many 88 temperature-swing-based processes, but its potentially low financial cost ($94 - $232/tonneCO2) for 89 DAC makes practical application more feasible.14
90
91 Developing simple and low-cost CCS approaches that use alkaline solutions thus represents a
92 substantial opportunity in emissions mitigation. In this paper, we study an electrochemically 93 mediated CO2 separation approach that uses a large electrochemically-induced swing in solution 94 pH to absorb and release CO2 and requires electrical but no thermal energy input.15 This approach 95 relies on the use of small molecules that undergo proton-coupled electron transfer (PCET) in 96 aqueous solution. Electrochemical reduction/oxidation (“redox”) of these molecules results in 97 proton uptake/release, respectively,16, 17 resulting in changes in solution pH18 which, if large
98 enough, can cause CO2 to be strongly absorbed at high pH and released at low pH.19, 20 The
Energy
&
Environmental
Science
Accepted
Manuscript
99 maximum achievable pH increases with the pKa of the reduced form of the PCET-active redox 100 couple, and its solubility.
101
102 There has been extensive research into organic molecules capable of PCET, in part because it
103 is pivotal in many biological energy-conversion processes such as respiration and
104 photosynthesis.21 Quinone-based molecules that undergo 2H+, 2e- PCET with fast kinetics are 105 particularly ubiquitous in the field of aqueous organic redox-flow batteries (RFBs).22-31 One major 106 drawback in using quinones as reactants for CO2 separation, however, is that they typically have 107 pKa values that are < 13.0, and solubilities < 1.0 M. 1,2-benzoquinone-3,5-disulfonic acid (or its 108 reduced form: tiron) is a rare exception in the latter category, with a reported solubility of > 2.0 M 109 in 1 M sulfuric acid, however its chemical instability in water32 renders it unattractive for 110 electrochemical CO2 separation.
111
112 Aza-aromatic redox-active compounds24 are potentially more promising in terms of both high 113 solubility and pKa. Although it does not participate in PCET for most of the 0 – 14 pH range,
114 quinoxaline has been shown to have a solubility above 4.0 M in water and in weakly alkaline
115 aqueous solution.33 Some phenazines also participate in 2H+, 2e- PCET up to at least pH 14. Wang
116 et al. have presented Pourbaix diagrams of 2-hydroxyphenazine (HP),
2-amino-3-117 hydroxyphenazine (AHP), and benzo[a]hydroxyphenazine-7/8-carboxylic acid (BHPC) with
118 slopes of 57.9, 65.8 and 61 mV/pH, respectively, in 7 14 pH range.34 However, although 119 these molecules have high solubility (1.7 M for HP, 0.43 M for AHP and 1.55 M for BHPC) at pH
120 14, their low solubility in neutral solution (0.44 mM for HP, 0.57 mM for AHP and 16 mM for
121 BHPC) prevents them from swinging the pH down to values <5 needed for an effective capture-122 release cycle. Phenazine dihydroxysulfonic acid (DHPS) has high solubility (1.8 M), and it is 123 reasonably chemically stable (i.e. decomposing at < 1 %/day).35 We discuss and criticize a CO
2 124 capture/release system using DHPS in the Discussion section.
125
126 In this paper we carry out a thermodynamic analysis of the energetic cost of this 127 electrochemical process and calculate the minimum required electrical energy input per mole of 128 CO2 for an ideal four-process cycle based on the potential difference between applied reduction 129 and oxidation potentials vs. pH. The results show the ideal cycle work input for this scheme is 16 130 – 75 kJ/molCO2, depending on the separation throughput per cycle, for capture from both flue gas
Energy
&
Environmental
Science
Accepted
Manuscript
131 and atmosphere. PCET with organic molecules that undergo kinetically rapid redox reactions is a 132 promising electrochemical basis for practicable CCS, as it may both reduce energetic losses and 133 lower overall costs per ton of CO2 separated, due to the potential low cost of these chemicals. 134
135 Experimentally, we demonstrate an electrochemical CO2 capture and release system using 136 0.078 M sodium 3,3’-(phenazine-2,3-diylbis(oxy))bis(propane-1-sulfonate) (DSPZ) as the proton 137 carrier in an aqueous flow cell. Multiple continuous cycles of CO2 absorption and desorption at a 138 steady 0.465 bar CO2 partial pressure were performed at current densities of 40 to 150 mA/cm2, 139 and the net electrical work input of the cycle at each current density was measured. The electrical 140 work input extrapolated to infinitesimal current, where ohmic, electron transfer and mass transport 141 overpotentials should be eliminated, was 47.0 kJ/molCO2. From these results, we estimate that, in 142 the low-current-density limit, the cycle work for capturing from a CO2 partial pressure of 0.465 143 bar and releasing into 1 bar CO2 to be our measured energy cost of 47.0 kJ/molCO2 plus the 144 thermodynamic minimum work of 1.9 kJ/molCO2, i.e. 48.9 kJ/molCO2, for concentrating the CO2. 145 This value may be compared with the ideal cycle work of 34 kJ/molCO2 for the latter conditions. 146 The results offer promise for further development and provide guidance on the design of future 147 low energy electrochemical CCS devices. We also demonstrate, for the first time, a stable and 148 multi-cycle electrochemical flow cell CCS device.
149
150 Thermodynamic Analysis 151
152 In order to effect large changes in solution pH using PCET in aqueous media containing CO2, 153 buffering from inorganic carbon species must be overcome. Thus, we first examine the dependence 154 of pH on the constituents of dissolved inorganic carbon (DIC) species present in solution, namely 155 aqueous CO2 (CO2(aq)), bicarbonate (HCO3-) and carbonate (CO32-)36:
156
157 DIC = [CO2(aq)]+
[
HCO3―]
+[
CO23―]
. eq. 1 158159 The relative ratios of these species at equilibrium is dictated by the reactions between aqueous CO2
160 and water:
Energy
&
Environmental
Science
Accepted
Manuscript
161 CO2(aq) + H2OK1 HCO― eq. 2 3 + H+ K2 CO2― 3 + 2H+ 162
163 where K1 and K2 are the first and second dissociation constants of carbonic acid (H2CO3), 164 respectively, and defined as the following equilibrium constants:
165 166
K
1=
eq. 3 [HCO3―][H+] [CO2(aq)];
167K
2=
eq. 4 [CO23―][H+] [HCO― 3 ].
168169 For a solution of zero salinity, K1 and K2 are 1.1 × 10⁻⁶ M and 4.1 × 10⁻¹⁰ M,37 resulting in the 170 first and second pKa for carbonic acid being 6.0 and 9.4, respectively. Thus, in acidic solutions of 171 pH < 6 total DIC is composed primarily of dissolved CO2(aq), in basic solutions of pH > 9 total 172 DIC is composed primarily of carbonate anions, and for the intermediate pH range total DIC is 173 composed primarily of bicarbonate anions.36 Because CO
2(aq), being uncharged, is the only form 174 that exchanges with the atmosphere, increasing the pH of a solution drives down the activity of 175 CO2(aq), leading to net dissolution of CO2(g) as CO2(aq) and conversion to bicarbonate and/or 176 carbonate. Correspondingly, decreasing the pH raises the activity of CO2(aq), leading to outgassing. 177 This provides a mechanism for selectively absorbing CO2 from a mixture of gases, and then 178 releasing a pure stream at a separate point for sequestration. Given that certain 179 bicarbonate/carbonate compounds have exceptionally high solubilities (> 3 M at room temperature) 180 in water, this strategy affords a potential pathway for high-throughput separation of CO2 from air 181 or flue gas. Additionally, the fact that the entire process takes place in the liquid phase offers a 182 potentially simpler and lower-cost CCS route as compared to schemes in which, having absorbed 183 CO2 using alkaline solution, precipitation and heating of solid carbonates is required to release 184 gaseous CO2.13, 14, 38
185
186 We envision a thermodynamic cycle comprising a series of alternating electrochemical and
187 gas-liquid exchange processes: (1) electrochemical acidification of an electrolyte at constant DIC 188 concentration, resulting in supersaturation of aqueous CO2; (2) outgassing of pure CO2 gas at the
189 collection stream until gas-liquid equilibrium is reached; (3) electrochemical de-acidification of
Energy
&
Environmental
Science
Accepted
Manuscript
190 the electrolyte, resulting in strongly alkaline electrolyte; and (4) invasion of CO2 from air/flue gas 191 into the alkaline electrolyte. During each process, the constituents of DIC and pH can be described 192 based on CO2-carbonate and water dissociation equilibria, as well as the principle of charge 193 conservation. Based on the definition of DIC set forth in eq. 1, the concentration of each 194 component of DIC as a function of total DIC and [H+] is given by36
195 196 [CO2(aq)]= ;eq. 5 DIC 1 + K1 [H +]+ K1K2 [H +]2 197
[
HCO3―]
= eq. 6 DIC 1 +[H +K1]+ K2 [H +] ; 198[
CO23―]
= eq. 7 DIC 1 +[H +K2]+[H +] 2 K1K2 .199 An additional constraint arises from the water dissociation equilibrium 𝐻2𝑂
𝐾𝑤
𝐻+ +𝑂𝐻―
200 resulting in
201
[
H+][
OH―]
= 10―14 M2. eq. 8202 The total alkalinity (TA) of the solution under consideration is defined as36
203 TA ≡
[
OH―]
+[
HCO3―]
+ 2[
CO23―]
―[
H+]
. eq. 9204 Given the ionic species present, and assuming the electrolyte salt comprises cationic and anionic 205 species S+ and S-, respectively, results in:
206
[
S+]
―[
𝑆―]
= TA. eq. 10207 Equation 10 follows from imposing a charge neutrality constraint in solution. It is important to 208 note that PCET, involving the transfer of protons between a small molecule Q and solution, may 209 directly change the solution TA. To understand this, consider the case of an electrochemical redox 210 reaction such as 𝑄+ 𝑒― +𝑥𝐻+ ↔𝑄𝐻𝑥𝑥 ―1 where x is the number of protons transferred per 211 electron. To the extent that the satisfaction of charge neutrality following the reduction of Q is not 212 fully accounted for by a change in DIC, [H+] or [OH-] content of the solution, it would result in a 213 net increase in TA – i.e. either via a transfer of S- out of the solution or a transfer of S+ into it. 214 Likewise, oxidation of 𝑄𝐻𝑥𝑥 ―1 might yield a net decrease in TA. Changes in TA cause changes
215 in pH; we stress, however, that TA and pH are not linearly related to each other: electrochemically
Energy
&
Environmental
Science
Accepted
Manuscript
216 induced perturbations to TA affect pH only subject to equilibria represented by equations 5–9 217 being satisfied. In other words, PCET provides a driving force for pH swing through changing TA,
218 but actual changes in pH depend on buffering from the CO2-carbonate equilibrium.
219
220 We determine the minimum work required to separate CO2 from a mixed gas stream using an
221 electrically-driven pH-swing cycle involving these chemical and electrochemical processes. The 222 four processes described above are represented schematically in Figure 1, in which process 1 2 223 and 3 4 are constant DIC, electrochemical processes – associated with electrical energy 224 input/output - whereas processes 2 3 and 4 1 involve gas-liquid exchange of CO2 at open 225 circuit potential and constant TA. All processes are assumed to be isothermal.
226
227 Figure 1. Schematic of electrochemical CO2 separation cycle, showing flow of liquid electrolyte (in blue lines) 228 and gas (dashed red lines) between the electrochemical cell and gas-liquid exchange chambers, with various
229 states numbered. Processes between numbered states are: electrochemical acidification (1 2), CO2 outgassing 230 (2 3), electrochemical de-acidification (3 4) and CO2 invasion (4 1).
231
232 We first perform a preliminary calculation to determine the equilibrium TA at State 1, i.e. after 233 CO2 invasion and before electrochemical acidification, for given values of DIC and CO2 partial 234 pressure. Figure 2 shows the result of this analysis, in which solutions were found to the system 235 of equations 5–9 for two initial CO2 partial pressures: 0.1 bar and 400 ppm CO2(g), which 236 correspond to the CO2 concentration of flue gas from a typical coal power plant and atmospheric
Energy
&
Environmental
Science
Accepted
Manuscript
237 CO2, respectively. [CO2(aq)] is assumed to be fixed based on a Henry’s Law constant of 238 35 mM/bar at room temperature. The results show that for both conditions, TA has an almost linear 239 relationship to DIC, with DIC = 0.86 × TA at 0.1 bar CO2(g), and 0.53 × TA at 400 ppm CO2(g). 240 Solution pH also increases with DIC, settling close to 8.6 in the limit of high DIC at 0.1 bar CO2(g) 241 (Figure 2a) and 9.8 at 400 ppm CO2 (Figure 2b). An important reference point for these results is 242 seawater in equilibrium with atmospheric CO2, which mainly comprises HCO3- and is known to 243 have a natural pH of about 8.1 for a DIC of ~ 2 mM.36 Results in Figure 2b are consistent with 244 this expectation, as at a DIC of 2 mM the solution pH is 8.1.
245
246 Figure 2. DIC (black) and pH (red) as functions of TA at CO2 partial pressures of (a) 0.1 bar and (b) 400 ppm. 247
248 We next consider the minimum concentration of PCET-active moleculesrequired for process
249 12 i.e. electrochemical acidification of the electrolyte at a fixed DIC. Figure 3 shows the 250 minimum concentration of a hypothetical small molecule capable of concerted 2H+, 2e- PCET that 251 is required to convert all DIC to CO2(aq). CO2 concentrations at the CO2-rich gas inlet of 0.1 bar
252 and 400 ppm were considered, and the TA at State 1 was calculated based on the relationship
253 between DIC and TA shown in Figure 2. Conversion of all carbonate/bicarbonate was deemed
254 complete at the point where 99% of DIC is composed of CO2(aq), after electrochemical 255 acidification via QH2 oxidation. For both inlet conditions, a linear relationship between DIC and 256 minimum concentration of QH2, or [QH2]min, was obtained, with [QH2]min equal to 0.57 × 𝐷𝐼𝐶 257 for the inlet with 0.1 bar CO2, and 0.93 ×𝐷𝐼𝐶 for that with 400 ppm CO2, for DIC values in the
258 range between 0 and 2.5 M.
a
b
Energy
&
Environmental
Science
Accepted
Manuscript
259
260 Figure 3. Minimum concentration of QH2required to convert 99% of all DIC to CO2(aq). 261
262 We now calculate the minimum work input required to separate CO2 in the ideal cycle defined 263 above. As an example of a desirable implementation, we assume an inlet CO2 partial pressure of 264 0.1 bar and a starting [QH2] of 1.4 M, which translates to a maximum convertible DIC of 2.46 M. 265 The minimum work input is sensitive to two important parameters: the ratio of partial pressures of 266 CO2 at the exit to inlet stream, which we term the ‘exit/inlet pressure ratio’, and the CO2 267 supersaturation at State 2, the start of outgassing. We define CO2 supersaturation here as the ratio 268 of [CO2(aq)] at the start of outgassing compared to equilibrium value of [CO2(aq)] at the exit. As 269 the exit/inlet pressure ratio increases, the work of separation increases. CO2 supersaturation at 270 State 2, which we denote hereafter as ‘outgassing overpressure’, is proportional to CO2 separation 271 throughput as, for a given exit/inlet pressure ratio, it is a measure of how much dissolved CO2 can 272 be released in a single cycle. For the implementation under consideration, an exit/inlet pressure 273 ratio of 10 was assumed (i.e. 1 bar of pure CO2(g) at the exit stream, for 0.1 bar inlet partial 274 pressure), resulting in an outgassing overpressure of 69. Figure 4a shows the pH of the solution 275 as a function of Q concentration during electrochemical acidification, going from initial pH of 8.7 276 to 4.3 when complete conversion is achieved.
277
Energy
&
Environmental
Science
Accepted
Manuscript
278
279 Figure 4. pH as a function of Q, QH2, and CO2(aq) concentrations for an ideal CO2 separation cycle with inlet 280 and outlet CO2(g) of 0.1 and 1 bar, respectively, during (a) electrochemical acidification (process 1 2, in red) 281 (b) CO2 outgassing at 1 bar CO2(g) (process 2 3, in green) (c) electrochemical de-acidification (process 3 282 4, in blue) and (d) CO2 invasion (process 4 1, in magenta), at the end of which aqueous CO2 (CO2(aq)) is 283 assumed to be in equilibrium with 0.1 bar CO2 gas. A starting value of [QH2] of 1.4 M and a DIC value at State 284 1 of 2.46 M are assumed.
285
286 For the outgassing process 23 (Figure 4a), equations 5–9 are solved subject to the constraint 287 that TA is fixed and, that at the end of the process, [CO2(aq)] relaxes to its equilibrium value at 1 288 bar of 35 mM. After this, process 3 4 (electrochemical de-acidification) is evaluated with DIC 289 fixed at its value at State 3, using parameters from State 3 as inputs (Figure 4c); the pH goes from 290 6 to ~14.5 as the concentration of QH2 increases. CO2 invasion (Figure 4d) then occurs, 291 completing the cycle and restoring State 1. The relationship between DIC and pH throughout the 292 cycle is shown in Figure 5, whereas that between pH and [CO2(aq)] is shown in Figure S1. For 293 comparison, an ideal cycle assuming a more moderate reactant solubility (i.e. the lower of Q and 294 QH2 solubilities) of 0.1 M (resulting in DIC at State 1 of 0.175 M) is shown in Figure S2. An
a
b
c
d
Energy
&
Environmental
Science
Accepted
Manuscript
295 important consequence of the lower solubility is that the pH after electrochemical de-acidification 296 (process 3 4) is 13, rather than 14.5; this is a direct result of the lesser degree of de-acidification 297 afforded by the removal of 0.2 M H+ from solution, as opposed to 2.8 M H+ (i.e. assuming 2H+,2e- 298 redox processes in both the 0.1 M and 1.4 M solubility cases). As will be discussed presently, the 299 pH attained after the deacidification process 3 4 is an important metric that constrains the 300 selection of viable molecules for electrochemical CCS. It is also important to note that based on 301 the relationship between DIC value and minimum [QH2] required for full acidification shown in 302 Figure 3, the concentration of QH2 at State 1 constrains combinations of exit/inlet pressure ratio 303 and outgassing overpressure that may be used in an ideal cycle. An illustration of this is given in 304 Figure S3, which shows lines of constant [QH2] for different exit/inlet pressure ratios and 305 outgassing overpressures. As expected, higher outgassing overpressures and exit/inlet pressure 306 ratios require higher concentrations of starting [QH2] to run a cycle.
307
308 In calculating the energetic cost/mol CO2 separated, we note that only processes 1 2 and 3 309 4 involve work inputs/outputs to or from the electrochemical cell, respectively. Using the Nernst 310 equation and assuming dilute solutions, we relate the pH during each of those processes to the 311 redox potential ( ) of the electrode at which conversion between the pairs of the Q/QH𝐸𝑅 2 redox 312 couple occurs: 𝐸𝑅= 𝐸0―(59mV × pH) where is the redox potential under standard conditions, 𝐸0
313 in which pH = 0.
Energy
&
Environmental
Science
Accepted
Manuscript
314
315 Figure 5. DIC vs. pH during the 4-process cycle (solid lines) described in Figure 4. At each numbered state,
316 DIC, [CO2(aq)], and equilibrium CO2(g) corresponding to the value of [CO2(aq)] are reported. The orange and 317 cyan dashed lines refer to DIC vs. pH during two-stage acidification and de-acidification, respectively, in which
318 electrochemical acidification and de-acidification are each performed in two stages: acidification at constant
319 DIC up to [CO2(aq)] = 35 mM, followed by outgassing and further acidification in tandem at constant [CO2(aq)] 320 until [Q] reaches 1.4 M; and de-acidification at constant DIC up to [CO2(aq)] = 3.5 mM, followed by invasion 321 and further de-acidification in tandem at constant [CO2(aq)] until [QH2] reaches 1.4 M.
322
323 Figure 6 shows the result of this calculation for electrochemical acidification and de-324 acidification, where the area between the potential profiles represents the net electrical energy 325 input. Dividing this area by the DIC released, i.e., the absolute difference in DIC between states 1 326 and 3, yields the overall work input per mole of CO2 captured, 𝑤, which may be represented as
327 follows:
328 𝑤= ∆𝐷𝐼𝐶∮2𝐹 𝐸𝑑𝑞
329 Here, F is Faraday’s constant of 96,485 C/mol, ΔDIC represents the difference in DIC before and 330 after CO2 outgassing, E is redox potential, and the factor of 2 results from the assumption that each 331 Q/QH2species undergoes a 2-electron redox process. In the implementation under consideration, 332 the net electrical work input is 50 kJ/molCO2.
eq. 1
Energy
&
Environmental
Science
Accepted
Manuscript
333
334 Figure 6.Redox potential as a function of Q concentration during electrochemical acidification (red line, process
335 1 2) and de-acidification (blue line, process 3 4) for ideal CO2 separation cycle of Figure 5. The orange 336 and cyan dashed lines refer to redox potential vs. Q concentration during two-stage acidification and
de-337 acidification described in Figure 5, respectively.
338
339 Following a program similar to that sketched out above, Figure 7 shows the ideal cycle work 340 input required for CO2 separation from inlet streams with 0.1 bar CO2 (Figure 7a) and 400 ppm 341 CO2 (Figure 7b), for exit/inlet pressure ratios that result in CO2 release around 1 bar at a variety
342 of outgassing overpressures. Ideal cycle work is compared to the thermodynamic minimum work
343 of separation required to provide the increase in CO2 exergy, which, is directly related to the partial 344 pressures of CO2 at the inlet and exit streams4, 6: 𝑅𝑇ln(𝑝3/𝑝1) , where R is the universal gas
345 constant of 8.314 J/mol K and temperature T is assumed to be 293.15 K (20 °C). For a given 346 exit/inlet pressure ratio, the ideal cycle work input increases with outgassing overpressure, up to ~ 347 50 and 75 kJ/molCO2 for outgassing overpressures of 100 for inlets of 0.1 bar and 400 ppm CO2(g), 348 respectively. This is expected as a consequence of the fact that higher CO2 super-/undersaturation 349 during the outgassing and invasion processes, respectively, cause increasingly greater exergetic 350 losses; these losses contribute to the difference in average pH, and thus redox potential, of the
351 electrolyte during electrochemical acidification and de-acidification (Figure 6).
Energy
&
Environmental
Science
Accepted
Manuscript
352
353 In order to reduce exergetic losses – and thereby reduce the ideal cycle work input – one may 354 consider performing CO2 invasion and outgassing simultaneously with electrochemical 355 acidification and de-acidification, respectively; this way, extremes in solution pH, and potential, 356 are avoided. Exemplary applications of this strategy during electrochemical de-acidification and 357 acidification are presented by the dashed lines in Figure 5 and Figure 6, where, for the cycle 358 outlined in Figure 4 (inlet 0.1 bar, exit 1.0 bar), processes 1 2 and 2 3 are combined into one 359 two-stage acidification process: electrochemical acidification at constant DIC until [CO2(aq)] 360 reaches its equilibrium value at 1 bar CO2(g) of 35 mM, followed by outgassing at constant 361 [CO2(aq)] until [Q] reaches 1.4 M. This results in a decrease in the ideal cycle work input from 50 362 to 42 kJ/molCO2. A similar approach can be applied to processes 3 4 and 4 1, combining them 363 into two-stage electrochemical de-acidification at constant DIC until [CO2(aq)] is 3.5 mM, 364 followed by CO2 invasion at constant [CO2(aq)] until [QH2] reaches 1.4 M. As large exergetic 365 losses during CO2 invasion are avoided, this results in a reduction in the ideal cycle work from 50 366 kJ/molCO2 to 14 kJ/molCO2. Combining both strategies in one two-process cycle that features zero 367 exergetic losses results in an ideal cycle work input of 5.7 kJ/molCO2, which is equal to the 368 thermodynamic minimum work input. In practice, however, this strategy would come at the cost 369 of lower CO2 separation throughput, as CO2 outgassing/invasion kinetics increase with 370 lower/higher pH values, respectively.39 The use of homogeneous catalysts such as carbonic
371 anhydrase40-42 to speed up CO
2 invasion/outgassing kinetics may be one way of making such a
372 cycle practical.
Energy
&
Environmental
Science
Accepted
Manuscript
373
374 Figure 7. Ideal cycle work as a function of the exit/inlet pressure ratio, p3/p1, for various values of the outgassing 375 overpressure, p2/p3, for inlet streams of (a) 0.1 bar CO2 and (b) 400 ppm CO2. Exit/inlet pressure ratios around 376 2500 are plotted as this is relevant to DAC, where CO2 is separated from 400 ppm to 1 bar. Both measures are 377 compared against the minimum work of separation at each exit/inlet pressure ratio.
378
379 It is worth noting that CO2 separation can, in principle, be run at arbitrarily high exit/inlet 380 pressure ratios, and thus reach higher exit stream CO2 partial pressures than indicated in Figure 7. 381 However, as already illustrated in Figure S3, one would need increasingly higher concentrations 382 of the PCET-active molecule, the solubility of which is constrained in reality (discussed in more 383 detail below). Figure S4 illustrates such a high-pressure exit stream case, where ideal cycle work 384 is plotted vs a series of exit/inlet pressure ratios, the highest of which yield CO2 separation from 385 either 0.1 bar or 400 ppm to 150 bar i.e. approaching typical CO2 pipeline pressures. Assuming an 386 upper limit in QH2 solubility of 10 M, our model predicts maximum achievable outgassing 387 overpressures of approximately 3 and 2 for flue gas (Figure S4a) and DAC (Figure S4b), at work 388 inputs of 40 and 70 kJ/molCO2, respectively.
389
390 Several factors dictate the practical feasibility and optimal operation of an electrochemical CO2 391 separation cycle based on the above scheme. With regard to a chosen redox pair Q/QH2, high 392 chemical stability in aqueous solution and fast redox kinetics are desirable for stable long-term 393 operation and low activation losses. And, especially for CCS schemes in which oxygen composes 394 a large fraction of the inlet gas composition (as in DAC), a high redox potential would be necessary 395 to reduce or even eliminate the thermodynamic susceptibility of QH2 to reversible chemical
a
b
Energy
&
Environmental
Science
Accepted
Manuscript
396 oxidation by O2, which would cause an efficiency loss and possibly a cell electrolyte imbalance as
397 well.
398
399 The most important attribute of Q, however, has to do with the highest pH it can effect upon 400 being reduced during electrochemical de-acidification, as this determines the maximum value of 401 DIC that can be deployed in a full CCS cycle and thus, the maximum CO2 separation throughput 402 per cycle. Higher values of DIC entail higher outgassing overpressures, which will require higher 403 pH values to be achieved after electrochemical de-acidification. A DIC of 2.46 M enables an 404 overpressure of ~70 given an exit pressure of 1 bar - i.e. 70 ~ 2.46 M/0.035 M – but a final pH 405 after de-acidification of 14.5 is required (Figure 4c). However, a DIC of 0.175 M enables an 406 overpressure of 5 (0.175 M/0.035 M), but requires a final pH upon de-acidification of only 13 407 (Figure S2c). In the ideal cycle under consideration, the hypothetical redox pair is considered 408 capable of concerted 2H+, 2e- PCET at all pH values, however in real aqueous solutions, PCET 409 would be strongly affected by the affinity of the reduced reactant for protons. A common measure 410 of this proton affinity is the pKa of the protonated form of the reduced reactant, which is calculated 411 based on the equilibrium between its protonated and deprotonated variants. A simplified reaction 412 equation representing this equilibrium is:
413 𝑄𝐻2↔𝑄2― +2𝐻+ eq. 12
414 Here, the equilibrium constant for this reaction is 𝐾𝑎=
[
Q2―][
H+]
2 [QH2]; and the pKa is 415 defined as the logarithmic constant, ―log10𝐾𝑎. As this equilibrium is highly sensitive to solution 416 acidity, increasingly basic solutions will favor the formation of the Q2 rather than QH2, in which417 case reduction of Qwill not result in solution de-acidification as assumed. Based on the pKa values 418 and the water dissociation equilibrium, as well as the conservation of the total concentration of the 419 molecule in all redox states, the ideal relationship between pKa, Qconcentration (i.e. concentration 420 of the oxidized form of the molecule) and final pH was derived, and is depicted in Figure S5 (see 421 SI section: Estimation of Final pH after Electrochemical De-acidification). As expected, the final 422 pH scales strongly with pKa, but is limited at low Q/QH2solubilities. As an illustration, consider 423 a solution of Qwith pKa 15 – at aconcentration of 50 mM, it will reach only pH 13 (equivalent to 424 100 mM OH) upon bulk electrolytic reduction, but will achieve a pH of 14.7 for a Q concentration
425 of 4.0 M. Finding redox-active species with a combination of high solubility and high pKa is
Energy
&
Environmental
Science
Accepted
Manuscript
426 therefore critical for reaching high DIC values in the electrochemical cycle, and thereby enabling 427 high-throughput CO2 separation.
428
429 Although DIC values greater than 3 M can, in principle, be attained in aqueous solution (room-430 temperature solubilities of NaHCO3, Na2CO3, KHCO3 and K2CO3 in water are 1.14, 3.2, 3.3 and 431 8.1 M, respectively43, 44), solubilities of molecules capable of undergoing PCET across a wide pH 432 range are typically lower, and thus limit DIC values that can be utilized in an electrochemical CCS 433 cycle. Molecules with high reduction potential, high value of pKa, high solubility and high 434 chemical and electrochemical stability are necessary for practical electrochemical CCS devices. 435
436 Besides the choice of molecules, another critical question bearing on the practical 437 implementation of this scheme relates to the nature of the electrochemical cell, and how it is 438 integrated with CO2 capture and release. Maximizing the overall energy efficiency of the system 439 would require minimizing charge transport losses by using thin membranes with high perm-440 selectivity, minimizing activation losses by using catalytically active high-surface-area electrodes 441 and redox-active species with fast kinetics, and minimizing mass transport/fluid pumping losses 442 by using carefully engineered electrode pore structures 45, 46 and flow fields.47-51 In Figure 1 it is 443 assumed that these processes occur in steady-state: the electrolyte flows between an air contactor 444 38, 52 at the inlet, where CO
2 absorption occurs at high pH; an electrochemical cell where 445 acidification/deacidification take place; and the exit, where CO2 is released at low pH. In order to 446 maintain this pH differential across the cell membrane, it would be critical to have an ion-selective 447 membrane that would strongly suppress the permeation of any ions that affect the solution TA (i.e. 448 ions on the right hand side of eq.9). A combination of an anion exchange membrane (AEM) and a
449 cation exchange membrane (CEM) may be necessary to maintain a steady-state pH differential
450 over a long period of time (Figure S7), as demonstrated for electrochemical water desalination by 451 Desai et al.53 In the next section, we demonstrate an electrochemical CCS flow cell using a DSPZ
452 electrolyte. An inexpensive sulfonated hydrocarbon based CEM Fumatech E-620(K) was used as
453 the membrane. 454 455 Experiment 456
Energy
&
Environmental
Science
Accepted
Manuscript
457 We designed DSPZ to serve as the proton carrier because of its facile synthesis, high stability
458 and quasi-reversible redox activity in a wide range of pH. DSPZ was synthesized through two
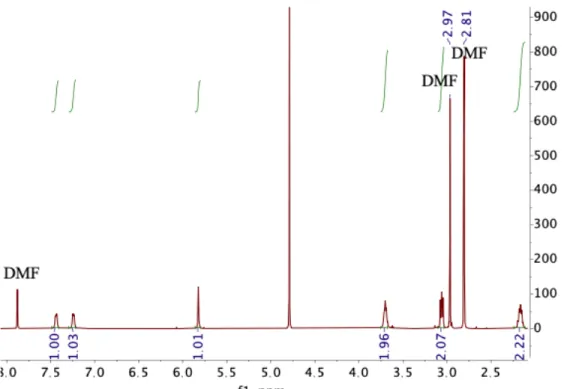
459 simple steps using inexpensive materials and solvents with an overall yield of 67% as shown in 460 Figure 8a. The nuclear magnetic resonance spectrum of DSPZ is in Figure S7. The solubility
461 values of DSPZ in 1 M KCl (pH = 5.9) and 1 M KOH (pH = 14) were determined by UV-vis
462 spectroscopy, and the values were both 0.73 M. (Figure S8)
463
464 Figure 8. Synthesis and electrochemical properties of DSPZ. (a) Synthetic scheme of DSPZ. (b) CV of 5 mM
465 DSPZ at pH 3, 9 and 14 buffered 1 M KCl solutions. We attribute the small peaks near 0.2 V and 0.05 V vs.
466 SHE in the pH 3 and 14 voltammograms, respectively, to a small amount of impurities. (c) Five cycles of
467 galvanostatic deacidification and acidification at 50 mA/cm2 of the flow cell that comprised 7 mL 0.1 M DSPZ 468 in 1 M KCl as negolytes (negative electrolyte) and 25 mL 0.1 M K4Fe(CN)6 0.04 M K3Fe(CN)6 in 1 M KCl as 469 posolyte (positive electrolyte). Potentiostatic holds at 1.65 V and 0.2 V were applied at the end of deacidification
470 and acidification, respectively, to ensure high capacity utilization. (d) Reversible pH swings during the five
471 cycles in (c).
472
473 Figure 8b shows that DSPZ undergoes quasi-reversible electrochemistry at pH 3, 9 and 14, 474 and the reduction potentials at these pH values are 0.05, 0.18 and 0.61 V vs. SHE, respectively. 475 These results suggest a fitted slope of 59.5 mV/pH, indicating 2H+, 2e- process throughout most 476 of the pH range from 3 to 14. Its high solubility and wide functional pH range for PCET means
477 that DSPZ satisfies our need for electrochemical CO2 capture and release using a pH swing cycle.
Energy
&
Environmental
Science
Accepted
Manuscript
478
479 Figure 9. Scheme of Fe(CN)6 (posolyte) | DSPZ (negolyte) flow cell for CO2 capture/release experiments. The 480 blue arrows indicate gas flow.
481
482 To fully understand the pH evolution during deacidification and acidification, we constructed 483 a flow cell capacity-limited by a negolyte of volume 7 mL with 0.1 M DSPZ. Both negolyte and 484 posolyte were purged with and blanketed by nitrogen before and throughout the experiments, 485 respectively, to avoid oxidation of reduced DSPZ by atmospheric oxygen. A schematic of the flow 486 cell is shown in Figure 9. We performed galvanostatic deacidification/acidification at 50 mA/cm2, 487 with potential holds at 1.65 V and 0.2 V at the end of each deacidification or acidification half 488 cycle until current dropped to 10 mA/cm2 in order to utilize the full capacity (Figure 8c). The pH 489 of the DSPZ negolyte was simultaneously recorded during deacidification/acidification cycles 490 using a pH probe immersed in the negolyte solution (Figure 8d).27, 28 In order to understand the 491 electrochemistry of DSPZ in slightly acidic conditions, the initial pH was adjusted to 4.0 by adding 492 a small amount of HCl solution. In the first full cycle, the pH increased from 4.0 to 13.4 during 493 deacidification and returned from pH 13.4 to 7.5 during acidification, and the pH continued to 494 cycle reversibly over the remaining four cycles. These results show that the electrochemical 495 reactions of 0.1 M of DSPZ can swing the pH to > 13 as predicted by Figure S5, and the molecules 496 can be cycled over a wide pH range of 4.0 to 13.4. The slight increase in pH over time at the end 497 of acidification was likely caused by residual oxygen in our system, as evident by the < 100% 498 coulombic efficiency of the first cycle.27 The close to 100% capacity utilization and the degree of 499 pH change once again confirmed the 2H+/2e- redox process of DSPZ, which makes it a suitable
500 proton carrier for electrochemical CO2 capture/release using a pH swing cycle.
Energy
&
Environmental
Science
Accepted
Manuscript
501
502 To further explore the possibility of using DSPZ flow cell for CO2 capture/release and compare 503 to the ideal cycle shown in Figure S2, we performed cycling of DSPZ in a steady mixed N2/CO2 504 environment with CO2 partial pressure of 0.465 bar. The scheme of the setup is shown in Figure 505 9. The inlet CO2 and N2 flow rates were controlled by mass flow controllers connected to each gas 506 cylinder, and the two gases were mixed before entering the electrolyte chamber. At the gas outlet, 507 the total gas flow rate and CO2 partial pressure were measured using a digital flowmeter and a CO2 508 sensor, respectively. The product of CO2 partial pressure and the total flow rate gives the CO2 flow
509 rate. 510
a
b
c
d
e
f
Energy
&
Environmental
Science
Accepted
Manuscript
511
512 Figure 10. One full CO2 capture and release cycle with DSPZ based flow cell. Electrolytes comprised 7 mL 513 0.078 M DSPZ in 1 M KCl (negolyte, capacity limiting side, theoretical capacity = 105.4 C) and 40 mL of 0.1
514 M K4Fe(CN)6 and 0.1 M K3Fe(CN)6 in 1M KCl (posolyte, non-capacity limiting side) (a) Voltage profile. (b) 515 Current density. (c) Estimated total alkalinity. (d) pH. (e) CO2 partial pressure. The black dashed line indicates 516 the 0.465 bar baseline. (f) Total gas flow rate.
517
518 Figure 10 presents time series data over a full CO2 capture and release cycle. The cell voltage 519 profile, current density and pH were collected by the potentiostat while the CO2 partial pressure 520 and the total gas flow rate were simultaneously recorded by the CO2 sensor and the flowmeter at 521 the gas outlet. The initial CO2 partial pressure was set to be 0.465 bar and the gas flow rate was 522 set to be 10 mL/min (Figure 10f). In this cycle, deacidification at 50 mA/cm2 started ~ 20 minutes 523 after the start of the experiment (Figure 10b). Both the cell voltage (Figure 10a), and negolyte pH 524 (Figure 10d) increased due to the PCET reaction. We also estimated the increase in negolyte TA 525 during deacidification assuming only K+ ions crossed the CEM (Figure 10c). When the cell 526 voltage reached 1.65 V, the cell was turned to potentiostatic mode in order to continue deacidifying 527 the electrolyte until the current dropped to 10 mA/cm2, to enhance capacity utilization. A capacity 528 utilization of 97.9% was achieved with this method. CO2 absorption occurred simultaneously with 529 deacidification, signified by a drop in outlet CO2 partial pressure (Figure 10e) and a pH drop as 530 CO2 reacts with OH- to form CO32-/HCO3-. The absorption period lasted ~40 minutes beyond the 531 end of charging process, presumably due to sluggish CO2 absorption kinetics at low pH; it ended 532 80 minutes after the start of the experiment, as indicated by the recovered CO2 partial pressure at 533 0.465 bar and a steady pH value. The volume of absorbed CO2 was obtained by integrating over 534 time the product of CO2 partial pressure, which can be translated to CO2 percentage assuming 1 bar 535 of total pressure, and the total gas flow rate, and subtracting the integration of the product of 536 baseline CO2 partial pressure and the total gas flow rate, i.e.
537 𝑄𝐶𝑂2= ∑ eq. 13 𝑡𝑓 𝑛=𝑡𝑖
(
𝑝𝐶𝑂 𝑏𝑎𝑠𝑒 2 ― 𝑝𝐶𝑂𝑛2)
𝑉𝑛∆𝑡 538539 where QCO2 is the amount of CO2 absorbed, ti is the start time, tf is the final time, pCO2base is the 540 baseline CO2 partial pressure, pCO2n is the measured CO2 partial pressure (in bar) at the nth data 541 recording time tn, V̇n is the total gas flow rate at time tn and Δt is the time difference between 542 successive measurements. The absorbed volume of CO2 was calculated to be 26.6 mL or, assuming
Energy
&
Environmental
Science
Accepted
Manuscript
543 T = 293.15 K, P = 1 bar and ideal gas behavior resulting in a DIC increase during CO2 invasion of 544 0.158 M (1.11 mmol CO2 in 7 mL solution). Adding this ΔDIC to the existing DIC (0.073 M) 545 before the deacidification, which can be calculated using the pH and pCO2 before deacidification, 546 the total DIC is 0.231 M at the end of the deacidification process. The measurement implies that 547 the TA concentration at the end of CO2 invasion is 0.216 M. During the deacidification process, 548 each DSPZ molecule gains two electrons and two protons, and, under ideal conditions, two 549 potassium ions will cross over from the posolyte to balance the charge, resulting a net increase in 550 [S+] that is twice the DSPZ concentration (eq. 10). The total DSPZ concentration is 0.078 M, so 551 the expected ΔTA value is 0.156 M, resulting in a final expected TA of 0.213 M (after adding 552 existing TA of 0.057 M) at the end of the deacidification process. The measured TA of 0.216 M is 553 within 2% of the expected value for a TA of 0.213 M, suggesting that crossover of non-554 conservative ions (H+, OH- and non-CO
2 DIC) is negligible during deacidification/capture. The 555 steady-state pH at the end of the absorption period was 7.0 (Figure 10d), which is similar to the 556 predicted value of 7.1 for 0.465 bar at TA of 0.213 M, considering the 0.25 error bar of the pH 557 probe. The similarity between theory and experimental results is reassuring. Acidification began 558 after the completion of the absorption period around 83 minutes after the start of the experiment. 559 The pH first dropped to 6.1 because of PCET releasing protons into solution and then increased to 560 6.5 because of DIC turning into gaseous CO2. pH, CO2 partial pressure and flow rate measurements 561 all show that the previously absorbed ΔDIC turned completely to gaseous CO2 ~40 minutes after 562 the start of acidification (Figure 10d, e and f). The desorbed CO2 amount, calculated using the 563 negative of the right-hand side of eq.13 , was 26.3 mL, which is within 2% of the absorbed amount. 564 The net electrical work of the full cycle is calculated by subtracting the work returned during 565 acidification from the work input during deacidification, i.e.
566 𝑤𝑐𝑦𝑐𝑙𝑒=𝑤𝑑𝑒𝑎𝑐𝑖𝑑𝑖𝑓𝑖𝑐𝑎𝑡𝑖𝑜𝑛― 𝑤𝑎𝑐𝑖𝑑𝑖𝑓𝑖𝑐𝑎𝑡𝑖𝑜𝑛eq. 14
567
568 where wdeacidification/acidification can be calculated by:
569 𝑤𝑑𝑒𝑎𝑐𝑖𝑑𝑖𝑓𝑖𝑐𝑎𝑡𝑖𝑜𝑛/𝑎𝑐𝑖𝑑𝑖𝑓𝑖𝑐𝑎𝑡𝑖𝑜𝑛= ∑ eq. 15
𝑡𝑓
𝑛=𝑡𝑖|𝑉
𝑛𝑗𝑛𝐴|∆𝑡
570 where Vn is the cell voltage at the nth data recording time t
n, jn is the current density at time tn and 571 A is the active geometric area of 5 cm2. We take the absolute value, recognizing the direction of 572 the work interactions through the minus sign in eq. 14. Work returned during acidification can be 573 calculated similarly. In this cycle, wdeacidification is 0.14 kJ and wacidification 0.063 kJ, so the cycle work
Energy
&
Environmental
Science
Accepted
Manuscript
574 is 0.08 kJ. Considering 1.11 mmol absorbed/desorbed CO2, the total work per mole is 72.1 575 kJ/molCO2. This energy is high because the ohmic, electron transfer and mass transport 576 overpotentials are high at this current density of 50 mA/cm2. 54
577
a
b
c
d
e
578Energy
&
Environmental
Science
Accepted
Manuscript
579 Figure 11. Thirty full CO2 capture and release cycles with a DSPZ-based flow cell at 40to 150 mA/cm2. 580 Electrolytes comprised 7 mL 0.078 M DSPZ in 1 M KCl (negolyte, capacity limiting side, theoretical capacity
581 = 105.4 C ) and 40 mL of 0.1 M K4Fe(CN)6 and 0.1 M K3Fe(CN)6 in 1M KCl (posolyte, non-capacity limiting 582 side) (a) Voltage profile. (b) Current density. (c) pH. (d) CO2 partial pressure. The black dashed line indicates 583 the 0.465 bar baseline. (e) Total gas flow rate.
584
585 In order to understand how the CO2 capture capacity and net electrical work depend on current 586 density, we performed the same experiment at different current densities. Figure 11 shows five 587 cycles each, at current densities of 40, 50, 75, 100, 125 and 150 mA/cm2, performed using the 588 same cell and electrolyte compositions as for the one-cycle experiment reported in Figure 10. 589 Across different current densities, the amount of absorbed/desorbed CO2 remained the same, at an
590 average value of 26.7 mL or, with the same assumptions as above, 0.159 M ΔDIC (1.11 mmol
591 CO2, Figure 12a). The same amount of absorbed CO2 is reasonable because the cell capacity and 592 estimated TA after deacidification remained the same, regardless of current density, and a 593 potentiostatic hold was applied at the end of each half cycle in order for the measured capacity to 594 approach the theoretical value. The energy consumption, however, is a different story because 595 ohmic, electron transfer and mass transport overpotentials increase monotonically with increasing 596 current density. Figure 12b reports the dependence upon current density of the electrical work 597 consumed and returned by the system; their difference is the net electrical work wcycle. For the 598 cycles under 0.465 bar CO2, a linear extrapolation to 0 mA/cm2, where ohmic and mass-transport 599 overpotentials are expected to be negligible, suggests that the minimum electrical work input 600 would be 47.0 kJ/molCO2. Five cycles at each current density were also performed using the same 601 cell with N2 but no CO2 in the headspace, and the resulting intercept shows that the minimum 602 electrical work input is 32.0 kJ/molCO2.
Energy
&
Environmental
Science
Accepted
Manuscript
603
a
b
604
605 Figure 12. (a) Average of CO2 captured and released at different current densities. (b) Gross electrical work 606 consumed by device (wdeacidification) during de-acidification, work returned (wacidification) during acidification, and 607 net work (wcycle) per mole of CO2vs. current density. The work components of cycling under CO2 and N2 are 608 compared.
609
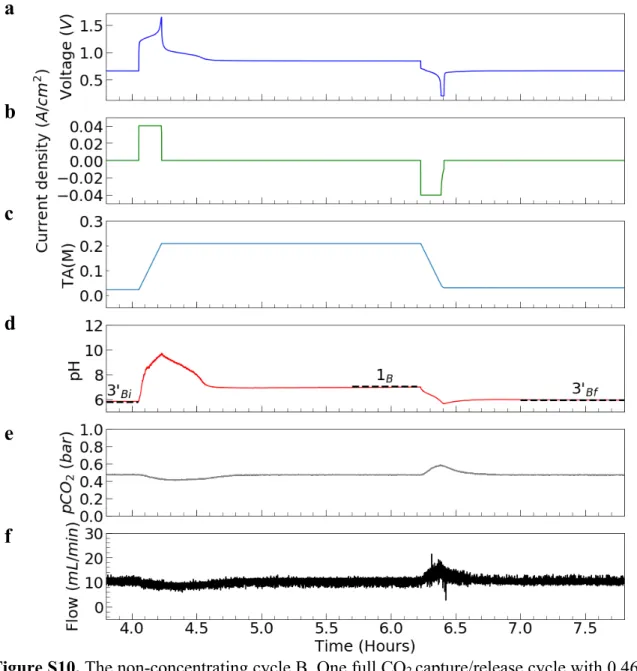
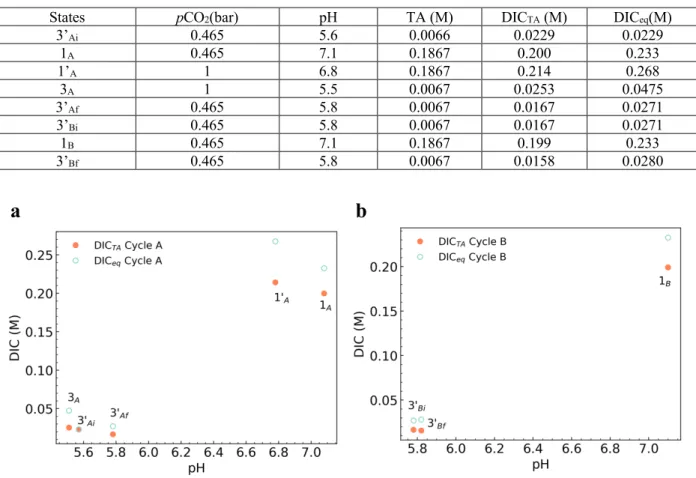
610 Figure S9 demonstrates a CO2 capture/release cycle in which CO2 is concentrated from an 611 inlet of 0.465 bar CO2(g) to an exit of 1 bar using a flow cell with 0.09 M DSPZ negolyte. Because 612 of transient changes in pCO2 and gas flow rate, uncertainties accumulate in calculating the amount 613 of CO2 absorbed/released based on eq. 13. Instead, we estimated DIC values based on pH values, 614 TA and equations 5 - 10. At 40 mA/cm2, the work input associated with this CO
2 separation cycle 615 is between 79.3 and 84.2 kJ/molCO2 (See SI section: CO2 Capture from 0.465 bar and Release to 1
616 bar).
617
618 Discussion 619
620 We interpret the value 47.0 kJ/molCO2 (Figure 12b) as being caused by electrode kinetic losses 621 and exergetic losses that do not disappear when extrapolated to zero current density. The former 622 may mainly comprise activation overpotentials for electrochemical processes that often cause 623 nonlinear behavior at low current density, e.g. in fuel cells.55 In our case, the work input associated 624 with activation overpotentials is equivalent to the minimum electrical work input for cycling under
625 N2 demonstrated in Figure 12b, i.e., 32.0 kJ/molCO2 because the same cell build and electrolyte
Energy
&
Environmental
Science
Accepted
Manuscript
626 composition were used. This value is twice the amount of our estimate of 15.7 kJ/molCO2, 627 calculated from the reported kinetic constants and transfer coefficients for a similar phenazine and 628 ferrocyanide. (see SI section: Estimate of Activation Overpotential). We interpret the 15 kJ/molCO2 629 gap between the measured minimum electrical work input in 0.465 bar CO2 of 47.0 kJ/molCO2 and 630 that in N2 of 32.0 kJ/molCO2 as comprising exergetic losses caused by finite CO2 631 absorption/desorption kinetics. Due to the behavior observed in Figure 11a,b,d and Figure 12a, 632 we do not believe these exergetic losses varied significantly within the range of current densities 633 accessed in our experiments. The next paragraph discusses the exergetic losses in detail. We expect 634 an additional thermodynamic energy cost of 1.9 kJ/molCO2 when a 0.465 bar/1.0 bar inlet/outlet 635 pressure ratio exists. Therefore, when a 0.465 bar CO2 source is concentrated to 1 bar using this 636 cycle, the estimated experimental cycle work would be 48.9 kJ/molCO2. This value may be 637 compared with the ideal cycle work predicted by our thermodynamic analysis of the four-process 638 cycle, i.e. 34 kJ/molCO2 for absorption from 0.465 bar and release to 1.0 bar (See SI section: 639 Estimate of CO2 Kinetics Losses).
640
641 The above calculation yielding 34 kJ/molCO2, however, assumes a four-process CO2 separation 642 cycle, whereas the experimental situation is arguably closer to the two-process cycle, in which 643 CO2 release/invasion and acidification/de-acidification occur simultaneously. The two-process 644 ideal cycle work would be the same as the thermodynamic minimum work, i.e. 0 kJ/molCO2 for the 645 case of capturing from and releasing to the same environment, and 1.9 kJ/molCO2 for capturing 646 from 0.465 bar and releasing to 1 bar. It does not include exergetic losses that occur during an 647 actual experimental cycle. We may estimate the minimum electrochemical work input for given, 648 finite CO2 capture/release kinetics, as the sum of the thermodynamic minimum work and the 649 exergetic losses during the two thermodynamically irreversible processes of CO2 release and 650 invasion in the experimental cycle, which we call the CO2 kinetic losses. We estimated those 651 exergetic losses based on the average partial pressures of CO2 in the cell headspace during 652 CO2 release and invasion in Figure 11d (see SI section: Estimate of CO2 Kinetics Losses), and 653 obtained a value of 10.3 kJ/molCO2. The gap between the estimated 10.3 kJ/molCO2 and the 654 measured 15 kJ/molCO2 may be caused by uncertainties in the CO2 kinetic loss calculation 655 described in the SI (see SI section: Estimate of CO2 Kinetics Losses) or other irreversible processes
656 not captured by the calculation.
Energy
&
Environmental
Science
Accepted
Manuscript
657
658 The predicted ideal cycle work for CO2 separation in the four-process cycle (16 – 75 kJ/molCO2) 659 and the experiment-based electrical work estimate (48.9 kJ/molCO2) appear competitive with other 660 proposed methods (Table 1), particularly those in which alkaline solution is created by splitting 661 or dissociating water.56-61 As water splitting requires work input, theoretical minimum electrical 662 energy inputs for CO2 separation using these methods range between 119 and 237 kJ/molCO2 663 (depending on pH at absorption). Because water splitting is also kinetically demanding, requiring 664 catalysts based on precious metals such as Pt and Ru, electrical work requirements for 665 experimentally demonstrated absorptive CO2 capture using OH- obtained by reactions following 666 from water splitting are as high as 587 kJ/molCO2..60 Dissociating H2O into H+ and OH- and using 667 the latter for absorptive CO2 capture has a lower minimum electrical energy cost, but 668 experimentally demonstrated work inputs have been fairly high, with 405 and 300 kJ/molCO2 669 reported in the literature.56,61 Much lower work inputs have been reported with capture schemes in 670 which redox reactions involving an organic62-64 or inorganic 65 redox couple trigger capture and 671 release of CO2. The lowest such work inputs for complete electrochemical CO2 capture-release 672 cycles are 56 kJ/molCO2 and 100 kJ/molCO2 for capturing CO2 via direct binding to a reduced 673 quinone64 or an electrochemically regenerated amine65, respectively. In the former type of cycle, 674 CO2 is absorbed by direct binding to a reduced quinone, followed by its release upon 675 electrochemical oxidation; in the latter cycle, termed electrochemically mediated amine 676 regeneration (EMAR), CO2 binds to an amine, and is displaced upon oxidation of copper, as Cu2+ 677 binds more strongly to the amine than does CO2. In implementations of both cycles,64, 65 however, 678 CO2 release occurred to a partial pressure of ~ 0 bar CO2, which precludes direct comparison of 679 the measured work input to a positive ideal cycle/thermodynamic minimum work input. 680 Nevertheless, the lowest work input we obtain is 60 kJ/molCO2 at 40 mA/cm2 (Figure 12), which 681 is competitive with direct binding and EMAR. 64, 65
682
683 Table 1. Summary of thermodynamic minimum/ideal cycle and experimentally demonstrated 684 work inputs for CO2 separation for a variety of electrochemical and thermal methods. Where no 685 method is specified, or the method is not specified in sufficient detail to derive minimum work for 686 an ideal cycle, work input is the thermodynamic minimum given by the exit/inlet pressure ratio,
687 reported in italics. Otherwise, the ideal cycle work/heat input is specified. Experimental work
Energy
&
Environmental
Science
Accepted
Manuscript
688 inputs with “th” subscript denote thermal energy inputs, whereas “e” subscript denotes electrical
689 work input.
Method Exit/inlet
Pressure Ratio
Thermodynamic minimum or Ideal Cycle (kJ/molCO2)
Experimental (kJ/molCO2)
10 5.6
2500 19
Fuel cell concentrator60 2500 119-2371a 469-587
e1b
Salt splitting56 N/A2a 1602b 405
e Direct binding64 0 ∞ 56 e4 EMAR65 6.7 153 100 e Bipolar membrane electrodialysis61 2600 205a 150 – 325 e5b Quinone PCET66 0 ∞ 600 e6 10 16 -75 This work 2500 30 -75 1 07a 64 e7b 2.2 1.98a 79.4-84.2 e8b
Traditional amine ab-/desorption 67
8.3 5.49 132-150
th
Shell Cansolv11 11.0 5.710 103
th
Non-aqueous solvent amine process10
7.511a 6.111b 11211c
Concentrated KOH14 375,000 3112a 230
th12b 690
691 1aThis technique captures CO2 into an end state that is not pure gaseous CO2. As it is based on the operation of an 692 H2-O2 fuel cell, the theoretical energy input is that required to split water, which is 119 kJ/molH2O and thus 119 693 kJ/molCO2 where CO2 is captured as HCO3-, but 237 kJ/molCO2 where CO2 is captured as CO32-. We do not consider 694 HCO3- as a viable end state for capture; however it may be converted to solid carbonates in a process such as the 695 Calera process 68. 1bThese numbers were added to the value of 350 kJ/molCO2 stated in the publication in order to 696 obtain a fair comparison value of the experimental energetic cost for DAC.
697 2a Exit/inlet pressure ratio is undefined because CO
2 is captured as Na2CO3. 2bCalculated assuming cell operates in 698 steady-state (hydrogen oxidation reaction at pH 0, water reduction at pH 14), and that 100% of H2 gas generated at 699 the cathode is recovered and fed into the anode.
700 3Calculatedfor a pressure ratio of 6.7 (15% CO
2 at the inlet, 1 atm CO2 at the exit), including changes to open-circuit
701 potential from CO2 binding to amine.