R E S E A R C H A R T I C L E
Open Access
Peak oxygen uptake and breathing pattern
in COPD patients
–
a four-year longitudinal
study
Bente Frisk
1,2*, Jon A. Hardie
2, Birgitte Espehaug
1, Liv I. Strand
3,4, Rolf Moe-Nilssen
3, Tomas M. L. Eagan
2,5,
Per S. Bakke
2and Einar Thorsen
2,6Abstract
Background:Activities of daily living in patients with chronic obstructive pulmonary disease (COPD) are limited by exertional dyspnea and reduced exercise capacity. The aims of the study were to examine longitudinal changes in peak oxygen uptake (V̇O2peak), peak minute ventilation (V̇Epeak) and breathing pattern over four years in a group of COPD patients, and to examine potential explanatory variables of change.
Methods:This longitudinal study included 63 COPD patients, aged 44-75 years, with a mean forced expiratory volume in one second (FEV1) at baseline of 51 % of predicted (SD = 14). The patients performed two
cardiopulmonary exercise tests (CPETs) on treadmill 4.5 years apart. The relationship between changes in V̇O2peak and V̇Epeakand possible explanatory variables, including dynamic lung volumes and inspiratory capacity (IC), were analysed by multivariate linear regression analysis. The breathing pattern in terms of the relationship between minute ventilation (V̇E) and tidal volume (VT) was described by a quadratic equation, VT= a + b∙V̇E+ c∙V̇E2, for each test. The VTmaxwas calculated from the individual quadratic relationships, and was the point where the first derivative of the quadratic equation was zero. The mean changes in the curve parameters (CPET2 minus CPET1) and VTmaxwere analysed by bivariate and multivariate linear regression analyses with age, sex, height, changes in weight, lung function, IC and inspiratory reserve volume as possible explanatory variables.
Results:Significant reductions in V̇O2peak(p< 0.001) and V̇Epeak(p< 0.001) were related to a decrease in resting IC and in FEV1. Persistent smoking contributed to the reduction in V̇O2peak. The breathing pattern changed towards a lower VTat a given V̇Eand was related to the reduction in FEV1.
Conclusion:Increasing static hyperinflation and increasing airway obstruction were related to a reduction in exercise capacity. The breathing pattern changed towards more shallow breathing, and was related to increasing airway obstruction.
Background
Activities of daily living in patients with chronic obstructive pulmonary disease (COPD) are limited by exertional dyspnea and reduced exercise capacity [1, 2]. Exertional dyspnea appears to be related to the increased work of breathing associated with a restriction of tidal
volume (VT) expansion [3]. A reduction in exercise
cap-acity measured as peak oxygen uptake (V̇O2peak) has
been found to be related to ventilatory limitations [4, 5], pulmonary gas exchange abnormalities [6], peripheral muscle dysfunction [7, 8] or any combination of these factors. COPD is a progressive disease with an increased rate of decline in forced expiratory volume in one
sec-ond (FEV1) [9, 10]. However, the relationship between
FEV1and V̇O2peakis considered weak, and lung function
by itself is a poor predictor of exercise capacity [11].
Studies of longitudinal changes in V̇O2peak, peak
minute ventilation (V̇Epeak) and breathing pattern in
COPD are scarce. As far as we know, the longitudinal
change in V̇O2peakhas only been examined in one
previ-ous study [12]. A reduction in V̇O2peak over five years
* Correspondence:[email protected]
1Centre for Evidence-Based Practice, Bergen University College, Bergen,
Norway
2Department of Clinical Science, University of Bergen, Bergen, Norway
Full list of author information is available at the end of the article
was found to be related to a reduction in maximal tidal volume (VTmax) and V̇Epeak, and the decrease in V̇O2peak
was associated with the decrease in FEV1. However, only
male Japanese patients were included in that study and the breathing pattern was not examined. We are not aware of any studies that have examined the longitudinal
changes in V̇O2peak and breathing pattern in COPD
pa-tients of Caucasian origin including both genders. The breathing pattern in terms of the relationship
between minute ventilation (V̇E) and VT during
incre-mental exercise has been described by Gallagher [13]. In the first phase, there is an almost linear relationship
be-tween V̇E and VT. In the second phase, the increase in
V̇E is mainly caused by an increase in breathing
fre-quency (Bf), and a smaller increase in VT. In the third
phase, the increase in V̇E is caused by an increase in Bf
only, and by the end of this phase, there can be a fall in
VT. Different methods have been suggested to describe
this relationship like the plateau of VTand its inflection
point [14], VTmaxand VTat a V̇Eof 30 L/min [15], VTat
given fractions of V̇Epeak[16] and the Hey plot [17]. We
have found that the V̇E-VT relationship can be
satisfac-torily described by a quadratic model in COPD patients exercising on treadmill [18]. A quadratic model includes all available data from the exercise test. However, longi-tudinal changes in the breathing pattern as described by this method have not been examined.
The aims of the present study were to examine changes in exercise and ventilatory capacity and breath-ing pattern over four years in COPD patients, and to examine the relationship with variables that potentially contribute to explain the changes. We hypothesized that V̇O2peakand V̇Epeak would deteriorate during the
obser-vation period, that breathing pattern would be shallower
with a lower VTmax, and that the changes were related to
lung hyperinflation and airway obstruction.
Methods
Subjects
The current study included 63 patients from the Bergen COPD Cohort Study (BCCS) who performed two cardiopulmonary exercise tests (CPETs) with an average follow-up time of 4.5 years (range 3-6 years). The BCCS
was a three year follow-up study (2006–2010) and
inclu-sion and excluinclu-sion criteria have been previously
published [19]. Summarised, all patients had a smoking
history of≥10 pack-years, a post- bronchodilation FEV1
to forced vital capacity (FVC) ratio < 0.7 and a
post-bronchodilator FEV1< 80 % of predicted value according
to Norwegian reference values [20]. All subjects in BCCS were informed of the opportunity to participate in pulmonary rehabilitation but were not otherwise actively selected or recruited for rehabilitation. There were no restrictions to treatment in the study period.
A total of 89 patients were enrolled to a 7- week pulmonary rehabilitation program, including a total of 17 sessions, during the first two years of follow-up in
2006–2008. The first CPET was performed at start of
the program. The patients were invited to a second CPET in 2011/2012. At that time 26 of the 89 patients were deceased or disabled. The 63 included patients had clinically stable COPD in stages II-IV according to the Global Initiative for Chronic Obstructive Lung Disease
(GOLD) (GOLD 2007) [21] and age between 44–75
years. Exclusion criteria for exercise testing were major cardiovascular disorders, a partial pressure of oxygen in arterial blood less than 8 kPa at rest, or exacerbations that required medical treatment during the last four weeks prior to testing.
Ethics
The Western Norway Regional Research Ethics Commit-tee approved the study. Participation in the study was voluntary. Written and oral information was given and written consent was obtained prior to inclusion.
Spirometry
Spirometry was conducted on a Viasys Masterscope (Viasys, Hoechberg, Germany) before the CPETs accord-ing to the ATS/ERS Standardization of Lung Function
Testing [22]. FEV1 and FVC were taken as the highest
values from at least three satisfactory expiratory manoeuvers. The spirometer was calibrated before each
test with a 3-L calibration syringe. The changes in FEV1
(ΔFEV1) and FVC (ΔFVC) were calculated as FEV1 or
FVC at CPET2 minus FEV1or FVC at CPET1.
Cardiopulmonary exercise test
The patients completed two incremental CPETs to their symptom-limited maximum on a treadmill (Woodway, model: PPS 55 med Weiss, Weil am Rhein, Germany). The exercise protocol was a modified Bruce protocol [23, 24]. The test started with rest in the standing position for 2 min. The warm-up phase lasted for 1 min
with a walking speed of 1.5 km h−1. The protocol has 20
stages, all lasting for one minute. The first stage was at 1.5 km/h with an inclination of 0 %. In stage 2, the speed was the same as in stage 1 with an inclination of 5 %.
From stage 3–5, the speed increased with 0.6 km/h and
the inclination was 9, 10 and 11 %, respectively. From
stage 6–13, the speed increased with 0.6–0.7 km/h and
the inclination with 1 %. From stage 13–14, the speed
increased with 0.4 km/h, and the inclination increased
with 1 %. Finally, from stage 15–20, the speed was
Blood pressure, electrocardiography (GE healthcare, Car-dio Soft EKG, Freiburg, Germany) and pulse oximetry were monitored at rest, continuously during the test and for 3 min into the recovery phase. A tight-fitting oronasal mask was adjusted to each patient and checked for leaks before starting the exercise. The integrated exercise testing system
(Care Fusion, Vmax Spectra 229, Hochberg, Germany) was
calibrated every morning and immediately before each test. The VT, Bf, oxygen uptake (V̇O2), carbon dioxide output
(V̇CO2), and heart rate (HR) were measured on a breath by
breath basis and averaged over 20 s intervals. V̇E and VT
were corrected to the body temperature pressure saturated
(BTPS) condition, and V̇O2 and V̇CO2 to the standard
temperature pressure dry (STPD) condition.
The patients graded their level of dyspnea and leg dis-comfort by Borg CR10 Scale [25]. In order to measure dynamic hyperinflation during exercise, serial measure-ments of inspiratory capacity (IC) were performed [5]. Measurements were taken at rest, every second minute during exercise and at peak exercise. The change in IC
(ΔIC) during each of the CPETs was calculated as IC at
rest minus IC at peak exercise. The change in dynamic
hyperinflation between the CPETs (ΔICdynamic) was
calculated as ΔIC at CPET2 minus ΔIC at CPET1. The
difference in IC at rest (ΔICrest) was calculated as IC at
rest at CPET2 minus IC at rest at CPET1. The differ-ences in V̇O2peak (ΔV̇O2peak) and V̇Epeak (ΔV̇Epeak) were
calculated in the same way. Inspiratory reserve volume (IRV) was calculated for each of the two CPETs as the difference between IC at the end of the test minus the
maximal VT. The difference in IRV (ΔIRV) was
calcu-lated as IRV at CPET2 minus IRV at CPET1. The
estimated MVV was calculated as FEV1× 35 [26].
Self-reported physical activity was recorded at baseline and after one and three years in the BCCS [27]. Two questions were related to spare time physical activity, one for strenuous and one for light physical activity. The delineation between strenuous and light was whether the activity resulted in breathlessness and sweating or not. The response categories were none, less than 1 h per week, 1-2 h per week and three or more hours per week. These questions are previously validated [28, 29]. Data on exacerbations and smoking habits were recorded at the time for the CPETs.
Statistical analyses
Descriptive statistics were used to characterize the study population (mean, standard deviation (SD), median and percent). Independent samples t-tests for continuous variables and Pearson chi square- tests for categorical
variables were used to compare patients’characteristics
and CPET responses to patients who only performed one CPET with those that completed both. Paired samples t-tests were used to analyze the longitudinal
change in pulmonary function, exercise capacity and breathing pattern in the patients who completed both CPETs. Pearson correlation coefficient was used to calculate the linear relationship between the yearly
change in V̇O2peakand FEV1. The relationships between
ΔV̇O2peakorΔV̇Epeakand potential explanatory variables
were analysed by bivariate (unadjusted) and multivariate (adjusted) linear regression analyses. Investigated vari-ables were age, sex, height, baseline V̇O2peakor baseline
V̇Epeak, smoking during follow-up, ΔFEV1, ΔFVC,
Δweight,ΔICrest,ΔICdynamic, self-reported physical
activ-ity, exacerbations and time between the tests.ΔFVC was
not included in the multivariate regression analysis,
because it is an intermediary variable with ΔFEV1 and
the outcome variable.
A quadratic model (VT= a + b∙V̇E+ c∙V̇E2) was used to
describe the relationship between V̇E and VT during
incremental exercise.The goodness-of-fit for the
individ-ual patient specific regression analysis was evaluated by
the adjusted coefficient of determination (adjusted R2)
and the F statistic. For the latter a p-value < 0.05 was
required for inclusion of the patient in further analysis. These analyses were done for each individual patient in CPET1 and CPET2.
The mean values for the curve parameters the constant (intercept) (a), the linear coefficient (slope) (b) and the quadratic coefficient (curvature) (c) were
calcu-lated. VTmax was calculated from the individual
quad-ratic relationships, and was the point where the first derivative of the quadratic equation was zero. The mean change (CPET2 minus CPET1) in the curve parameters
and the change in VTmax (ΔVTmax) were analysed by
bivariate and multivariate linear regression analysis with
age, sex, height, Δweight, ΔFEV1, ΔIRV, ΔICrest, and
ΔICdynamicas explanatory variables.
Estimated regression coefficients are presented with
95 % confidence intervals and p-values. The significance
level was set at 0.05. The data analyses were performed using IBM SPSS Statistics 21 (SPSS Inc. Chicago, Illinois, USA).
Results
The baseline characteristics of the study population and the peak responses to the incremental exercise test at
baseline are shown in Table 1. The patients’ mean age
(SD) was 61 (6) years, 56 % were males and mean FEV1
in percent of predicted values was 51 (14) %. The 26 patients who only performed the first CPET were older, had lower lung function and lower peak responses at the CPET (Table 1).
(24 %) had changed to a worse GOLD stage, eight from stage II to III and seven from stage III to IV.
Longitudinal changes in exercise and ventilatory capacity
FEV1, FVC, V̇O2peak and V̇Epeak decreased significantly
during the follow-up period (Table 2), while the exercise time on treadmill remained constant. The Borg dyspnea score was not significantly different. The mean (SD)
decline in FEV1 was 34 (66) mL∙yr−1, (p< 0.001) and in
V̇O2peak,50 (68) mL · min−1· yr−1(p< 0.001). The decline
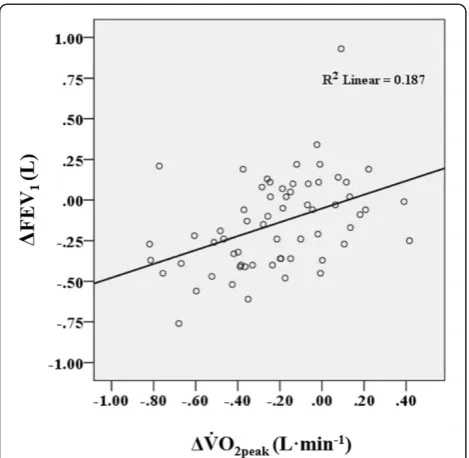
in V̇O2peak and FEV1 during the observation period
correlated moderately (r= 0.43,p< 0.001) (Fig. 1).
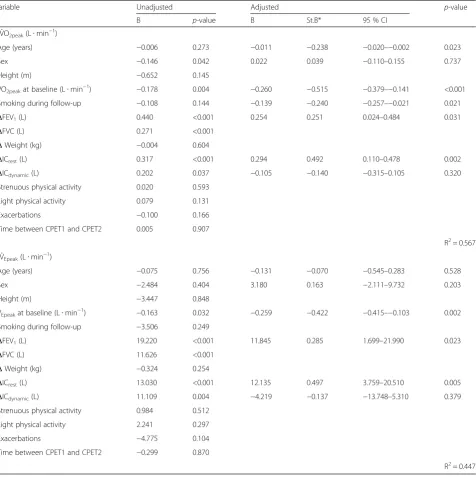
The reduction in V̇O2peakwas larger in subjects with a
higher baseline V̇O2peak (p < 0.001) and with a larger
reduction in ΔICrest (p= 0.002) (Table 3). Furthermore
age (p= 0.023), ΔFEV1 (p= 0.031) and smoking during
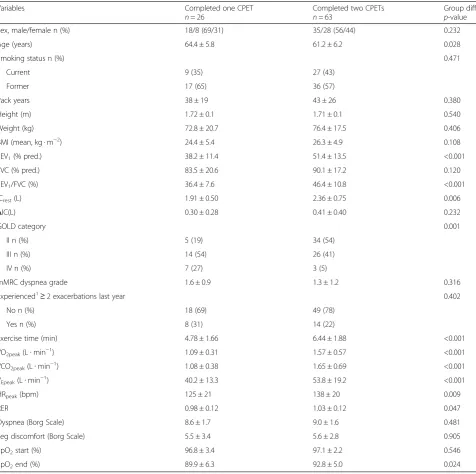
Table 1Baseline characteristics of the study sample (n= 63) compared with patients only assessed at baseline (n= 26)
Variables Completed one CPET
n= 26
Completed two CPETs
n= 63
Group diff.
p-value
Sex, male/female n (%) 18/8 (69/31) 35/28 (56/44) 0.232
Age (years) 64.4 ± 5.8 61.2 ± 6.2 0.028
Smoking status n (%) 0.471
Current 9 (35) 27 (43)
Former 17 (65) 36 (57)
Pack years 38 ± 19 43 ± 26 0.380
Height (m) 1.72 ± 0.1 1.71 ± 0.1 0.540
Weight (kg) 72.8 ± 20.7 76.4 ± 17.5 0.406
BMI (mean, kg · m−2) 24.4 ± 5.4 26.3 ± 4.9 0.108
FEV1(% pred.) 38.2 ± 11.4 51.4 ± 13.5 <0.001
FVC (% pred.) 83.5 ± 20.6 90.1 ± 17.2 0.120
FEV1/FVC (%) 36.4 ± 7.6 46.4 ± 10.8 <0.001
ICrest(L) 1.91 ± 0.50 2.36 ± 0.75 0.006
ΔIC(L) 0.30 ± 0.28 0.41 ± 0.40 0.232
GOLD category 0.001
II n (%) 5 (19) 34 (54)
III n (%) 14 (54) 26 (41)
IV n (%) 7 (27) 3 (5)
mMRC dyspnea grade 1.6 ± 0.9 1.3 ± 1.2 0.316
Experienced1≥2 exacerbations last year 0.402
No n (%) 18 (69) 49 (78)
Yes n (%) 8 (31) 14 (22)
Exercise time (min) 4.78 ± 1.66 6.44 ± 1.88 <0.001
V̇O2peak(L∙min−1) 1.09 ± 0.31 1.57 ± 0.57 <0.001
V̇CO2peak(L∙min−1) 1.08 ± 0.38 1.65 ± 0.69 <0.001
V̇Epeak(L∙min−1) 40.2 ± 13.3 53.8 ± 19.2 <0.001
HRpeak(bpm) 125 ± 21 138 ± 20 0.009
RER 0.98 ± 0.12 1.03 ± 0.12 0.047
Dyspnea (Borg Scale) 8.6 ± 1.7 9.0 ± 1.6 0.481
Leg discomfort (Borg Scale) 5.5 ± 3.4 5.6 ± 2.8 0.905
SpO2start (%) 96.8 ± 3.4 97.1 ± 2.2 0.546
SpO2end (%) 89.9 ± 6.3 92.8 ± 5.0 0.024
Data are presented as mean ± SD, unless otherwise stated. Chi square for categorical variables and independentt-test for continuous variables. CPET: cardiopulmonary exercise test; BMI: body mass index; FEV1: forced expiratory volume in one second; FVC: forced vital capacity; ICrest: resting inspiratory capacity;
ΔIC: inspiratory capacity at rest minus IC at the end of the test; GOLD: Global Initiative for Chronic Obstructive Lung Disease; mMRC: modified Medical Research Council. V̇O2peak: peak oxygen uptake per minute; V̇CO2peak: peak carbon dioxide production per minute V̇Epeak: peak minute ventilation per minute; HRpeak: peak
heart rate; RER: respiratory exchange ratio; SpO2:oxygen saturation 1
follow-up (p= 0.021) were found to be related to the
change in V̇O2peak. ΔV̇Epeak was related to ΔICrest
(p= 0.005), ΔFEV1 (p= 0.023) and baseline V̇Epeak
(p= 0.002) (Table 3). Gender was not associated with the
reduction in V̇O2peakor V̇Epeak.
Self-reported physical activity during follow-up as reported in Bergen COPD Cohort Study and exacerba-tions were not related to the longitudinal changes in V̇O2peakor V̇Epeak(Table 3).
Longitudinal changes in breathing pattern
The quadratic model described the relationship between
V̇Eand VTin 61 of 63 patients at CPET1 and at 59 of 63
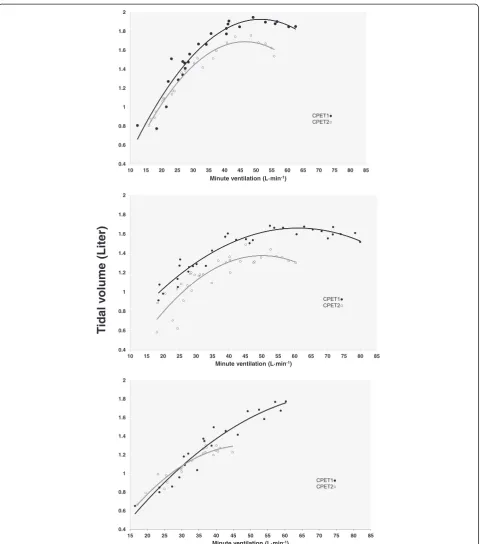
patients in CPET2. In these subjects the p-value of the F-statistics for the quadratic model was <0.05 and the R2 ranged from 0.35 to 0.99 (median 0.90) at CPET1, and from 0.40 to 0.98 (median 0.90) at CPET2. A random set of three individual responses from CPET1 and CPET2 are shown in Fig. 2. For the six excluded patients the goodness of fit was not statistically significant and the exercise time was short with few observations. The means of the estimated constant (a), the linear coeffi-cient (b) and the quadratic coefficoeffi-cient (c) changed significantly from CPET1 to CPET2 (Table 2). The linear
coefficient (b) increased (p= 0.007) and the quadratic
coefficient (c) decreased (p= 0.002). The changes in the
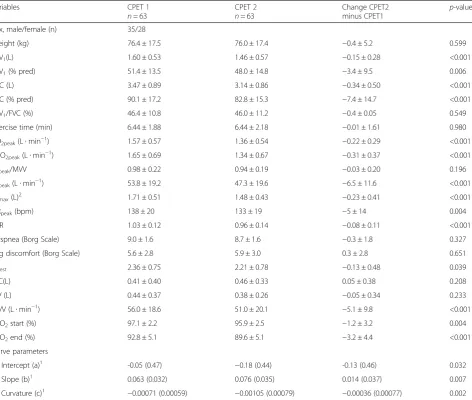
Table 2Pulmonary function and peak responses to cardiopulmonary exercise tests at baseline and 4.5 years apart
Variables CPET 1
n= 63
CPET 2
n= 63
Change CPET2
minus CPET1 p
-value
Sex, male/female (n) 35/28
Weight (kg) 76.4 ± 17.5 76.0 ± 17.4 −0.4 ± 5.2 0.599
FEV1(L) 1.60 ± 0.53 1.46 ± 0.57 −0.15 ± 0.28 <0.001
FEV1(% pred) 51.4 ± 13.5 48.0 ± 14.8 −3.4 ± 9.5 0.006
FVC (L) 3.47 ± 0.89 3.14 ± 0.86 −0.34 ± 0.50 <0.001
FVC (% pred) 90.1 ± 17.2 82.8 ± 15.3 −7.4 ± 14.7 <0.001
FEV1/FVC (%) 46.4 ± 10.8 46.0 ± 11.2 −0.4 ± 0.05 0.549
Exercise time (min) 6.44 ± 1.88 6.44 ± 2.18 −0.01 ± 1.61 0.980
V̇O2peak(L∙min−1) 1.57 ± 0.57 1.36 ± 0.54 −0.22 ± 0.29 <0.001
V̇CO2peak(L∙min−1) 1.65 ± 0.69 1.34 ± 0.67 −0.31 ± 0.37 <0.001
V̇Epeak/MVV 0.98 ± 0.22 0.94 ± 0.19 −0.03 ± 0.20 0.196
V̇Epeak(L∙min−1) 53.8 ± 19.2 47.3 ± 19.6 −6.5 ± 11.6 <0.001
VTmax(L)2 1.71 ± 0.51 1.48 ± 0.43 −0.23 ± 0.41 <0.001
HRpeak(bpm) 138 ± 20 133 ± 19 −5 ± 14 0.004
RER 1.03 ± 0.12 0.96 ± 0.14 −0.08 ± 0.11 <0.001
Dyspnea (Borg Scale) 9.0 ± 1.6 8.7 ± 1.6 −0.3 ± 1.8 0.327
Leg discomfort (Borg Scale) 5.6 ± 2.8 5.9 ± 3.0 0.3 ± 2.8 0.651
ICrest 2.36 ± 0.75 2.21 ± 0.78 −0.13 ± 0.48 0.039
ΔIC(L) 0.41 ± 0.40 0.46 ± 0.33 0.05 ± 0.38 0.208
IRV (L) 0.44 ± 0.37 0.38 ± 0.26 −0.05 ± 0.34 0.233
MVV (L∙min−1) 56.0 ± 18.6 51.0 ± 20.1 −5.1 ± 9.8 <0.001
SpO2start (%) 97.1 ± 2.2 95.9 ± 2.5 −1.2 ± 3.2 0.004
SpO2end (%) 92.8 ± 5.1 89.6 ± 5.1 −3.2 ± 4.4 <0.001
Curve parameters
Intercept (a)1 -0.05 (0.47) −0.18 (0.44) -0.13 (0.46) 0.032
Slope (b)1 0.063 (0.032) 0.076 (0.035) 0.014 (0.037) 0.007
Curvature (c)1 −0.00071 (0.00059) −0.00105 (0.00079) −0.00036 (0.00077) 0.002
Data are presented as mean ± SD, unless otherwise stated. Independentt-test for continuous variables
CPET: cardiopulmonary exercise test; FEV1: forced expiratory volume in one second; FVC: forced vital capacity; V̇O2peak:peak oxygen uptake per minute;
V̇CO2peak: peak carbon dioxide production per minute; V̇Epeak: peak minute ventilation per minute; MVV: maximal voluntary ventilation (FEV1x35)
VTmax: maximal tidal volume; HRpeak: peak heart rate; RER: respiratory exchange ratio; ICrest: resting inspiratory capacity;ΔIC: IC at rest minus IC at the end
of the test; IRV: inspiratory reserve volume; SpO2:oxygen saturation 1
The relationship between ventilation (V̇E) and tidal volume (VT) was described by a quadratic model (VT= a + b·V̇E+ c·V̇E2).2VTmaxwas calculated from the
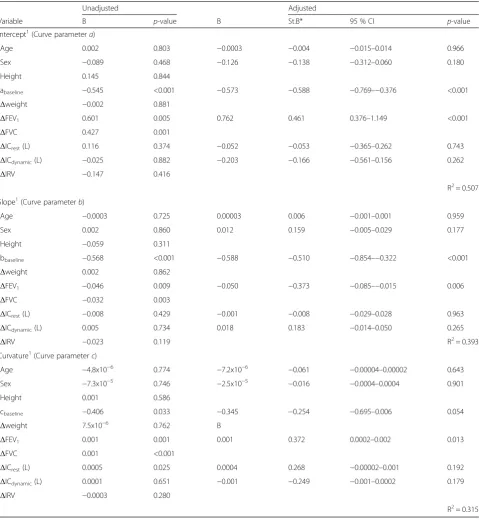
curve parameters were all related to ΔFEV1, but not to
the other possibly explanatory variables (Table 4). Maximal VTwas achieved at a lower V̇E.
The VTmaxdecreased significantly from CPET1 to CPET2
(p< 0.001) (Table 2). In the multivariate linear regression analysis, ΔVTmax was significantly related to the reduction
in FEV1(B = 0.429, CI: 0.106–0.751, p< 0.010), the
reduc-tion in ICrest(B = 0.325, CI: 0.053–0.596,p< 0.020) and the
baseline VTmax(B =–0.471, CI:–0.662––0.281,p< 0.01).
Discussion
The major findings of this study of a group of COPD patients who were followed over a mean time of 4.5 years
were a reduction in V̇O2peak and V̇Epeak which were
related to a decrease in resting IC and FEV1, and
persist-ent smoking during the observation period. The
breath-ing pattern changed towards a lower VTmaxand a lower
VTat a given V̇E. The reduction in FEV1was related to
the changes in the curve parameters describing the breathing pattern.
The mean reduction in V̇O2peak was 50 (SD = 68)
mL∙min−1∙yr−1, which was slightly higher than the
decline in V̇O2peak of 32 mL∙min−1∙yr−1 in male COPD
patients reported by Oga et al. [12]. In our study, both
genders were included, but the reduction in V̇O2peak or
V̇Epeakwas not associated with gender. The reduction in
resting IC and FEV1, baseline V̇O2peak, smoking during
follow-up and age were all found to be related to the
change in V̇O2peak. As shown in Fig. 1 the association
between the changes in FEV1 and V̇O2peak was rather
weak with large interindividual variation. The strongest associations were found for resting IC and baseline V̇O2peak. Total lung capacity (TLC) was not measured,
and we are not aware of any studies having described the longitudinal change in TLC in COPD patients. Based on data from cross-sectional studies of COPD patients, TLC is expected to remain unaltered or slightly
increased [30–32]. Thus, there is a possibility that the
increase in static hyperinflation as estimated by resting IC is underestimated. There were no significant differ-ences in dynamic hyperinflation between CPET1 and CPET2. Without knowledge about TLC changes in dynamic hyperinflation may have been obscured. Theor-etically, dynamic hyperinflation is likely important since it is associated with increased work of breathing and dyspnea [1, 33].
The exercise time was the same at the two CPETs, which can indicate better working economy, even
though V̇O2peak and lung function decreased
signifi-cantly. The respiratory exchange ratio and V̇CO2peak
were lower at the second CPET, whereas maximal Borg dyspnea score was not significantly different at the two CPETs. These observations are consistent with previous studies showing that laboratory-based constant work rate tests can be more sensitive demonstrating improve-ments after interventions than V̇O2peak[11, 34].
We described the breathing pattern in the individual
patient by a quadratic relationship between V̇E and VT.
The relationship could be satisfactorily described by the model in the majority of the subjects, and the model accounts for all observations throughout the exercise
test. The limitations with other methods [14–17] are
that all observed data from the exercise test are not
included in the analyses. O’Donnell et al. [14] has
described the relationship between V̇E and VT during
exercise as linear until an inflection point. After this
point, further increase in V̇E is accomplished by an
increase in Bf. The inflection point is determined “by
eye” by two or three persons independently of each
other [14, 17]. When we examined our exercise data, it was not obvious to see where an inflection point could occur. In a quadratic model, which is analysed mathem-atically, the curve parameter c in the equation will be
related to a “perceived” inflection point as it describes
the “sharpness” of the curvature, and the VTmax can be
calculated by derivation of the equation. By using this method determinations of the curve parameters will not be influenced by intra-and/or inter observer reliability. Another consideration is that during an incremental ex-ercise test, there will be a gradual transition between the phases as described by Gallagher [13], and determining a cut-off point where the change from one phase to the other takes place, is not exactly defined. The changes in
Fig. 1The relationship between change in V̇O2peakand change in
FEV1between the two cardiopulmonary exercise tests (CPET).
V̇O2peak: Peak oxygen uptake.ΔV̇O2peak: V̇O2peakat CPET2 minus
V̇O2peakat CPET1. FEV1: Forced expiratory volume in 1 sec.ΔFEV1: FEV1
the curve parameters describing the breathing pattern
were found to be related to the change in FEV1.
The time constant for the lung is increased in COPD due to both increased resistance and compliance. Dy-namic hyperinflation in response to increasing ventila-tory demands is a necessary compensaventila-tory mechanism allowing complete respiratory cycles. Resistance and
compliance are both related to FEV1, but we did not find
any relationships between changes in breathing pattern
and changes in IC or IRV after adjusting for FEV1.
Study limitations
The BCCS, which this study sample is a part of, made no restrictions to treatment in the study period, and the
Table 3The relationships between changes in peak oxygen uptake and peak minute ventilation and explanatory variables
Variable Unadjusted Adjusted p-value
B p-value B St.B* 95 % CI
ΔV̇O2peak(L∙min−1)
Age (years) −0.006 0.273 −0.011 −0.238 −0.020–−0.002 0.023
Sex −0.146 0.042 0.022 0.039 −0.110–0.155 0.737
Height (m) −0.652 0.145
V̇O2peakat baseline (L∙min−1)
−0.178 0.004 −0.260 −0.515 −0.379–−0.141 <0.001 Smoking during follow-up −0.108 0.144 −0.139 −0.240 −0.257–−0.021 0.021
ΔFEV1(L) 0.440 <0.001 0.254 0.251 0.024–0.484 0.031
ΔFVC (L) 0.271 <0.001
ΔWeight (kg) −0.004 0.604
ΔICrest(L) 0.317 <0.001 0.294 0.492 0.110–0.478 0.002
ΔICdynamic(L) 0.202 0.037 −0.105 −0.140 −0.315–0.105 0.320 Strenuous physical activity 0.020 0.593
Light physical activity 0.079 0.131
Exacerbations −0.100 0.166
Time between CPET1 and CPET2 0.005 0.907
R2= 0.567
ΔV̇Epeak(L∙min−1)
Age (years) −0.075 0.756 −0.131 −0.070 −0.545–0.283 0.528
Sex −2.484 0.404 3.180 0.163 −2.111–9.732 0.203
Height (m) −3.447 0.848
V̇Epeakat baseline (L∙min−1) −0.163 0.032 −0.259 −0.422 −0.415–−0.103 0.002
Smoking during follow-up −3.506 0.249
ΔFEV1(L) 19.220 <0.001 11.845 0.285 1.699–21.990 0.023
ΔFVC (L) 11.626 <0.001
ΔWeight (kg) −0.324 0.254
ΔICrest(L) 13.030 <0.001 12.135 0.497 3.759–20.510 0.005
ΔICdynamic(L) 11.109 0.004 −4.219 −0.137 −13.748–5.310 0.379 Strenuous physical activity 0.984 0.512
Light physical activity 2.241 0.297
Exacerbations −4.775 0.104
Time between CPET1 and CPET2 −0.299 0.870
R2= 0.447
95 % confidence interval (CI) examined by linear regression in bivariate and multivariate analyses
CPET: cardiopulmonary exercise test; V̇O2peak: peak oxygen uptake per minute;ΔV̇O2peak: V̇O2peakat CPET2 minus V̇O2peakat CPET1; FEV1: forced expiratory volume
in one second;ΔFEV1: FEV1at CPET2 minus FEV1at CPET1; FVC: forced vital capacity;ΔFVC andΔweight were calculated likeΔFEV1.IC: inspiratory capacity.ΔICrest
was calculated as IC at rest at CPET2 minus IC at rest at CPET1.ΔIC was calculated as IC at rest minus IC at the end of the test for both CPET1 and CPET2. ΔICdynamicwas calculated asΔIC at CPET2 minusΔIC at CPET1; V̇E: minute ventilation per minute;ΔV̇Epeak:peak V̇Eat CPET2 minus peak V̇Eat CPET1; R2: The
participants were free to receive medication or other treat-ment prescribed by their physician. Since the included pa-tients participated in a pulmonary rehabilitation program after the first CPET, this was a selected group and the results cannot be generalized to the common COPD popu-lation. One of the major effect of pulmonary rehabilitation
is to increase exercise tolerance and reduce shortness of breath, but since there was no maintenance program, the effect of the rehabilitation probably would be negligible
after four years. The reduction in FEV1in our patients was
34 (SD = 66) mL · year−1, which was not different from the
mean rate of decline in FEV1 of 33 mL · year−1 in the
Table 4The relationships between the change in the curve parameters1and explanatory variables (CPET2 minus CPET1)
Unadjusted Adjusted
Variable B p-value B St.B* 95 % CI p-value
Intercept1(Curve parameter
a)
Age 0.002 0.803 −0.0003 −0.004 −0.015–0.014 0.966
Sex −0.089 0.468 −0.126 −0.138 −0.312–0.060 0.180
Height 0.145 0.844
abaseline −0.545 <0.001 −0.573 −0.588 −0.769–−0.376 <0.001
Δweight −0.002 0.881
ΔFEV1 0.601 0.005 0.762 0.461 0.376–1.149 <0.001
ΔFVC 0.427 0.001
ΔICrest(L) 0.116 0.374 −0.052 −0.053 −0.365–0.262 0.743
ΔICdynamic(L) −0.025 0.882 −0.203 −0.166 −0.561–0.156 0.262
ΔIRV −0.147 0.416
R2= 0.507
Slope1(Curve parameterb)
Age −0.0003 0.725 0.00003 0.006 −0.001–0.001 0.959
Sex 0.002 0.860 0.012 0.159 −0.005–0.029 0.177
Height −0.059 0.311
bbaseline −0.568 <0.001 −0.588 −0.510 −0.854–−0.322 <0.001
Δweight 0.002 0.862
ΔFEV1 −0.046 0.009 −0.050 −0.373 −0.085–−0.015 0.006
ΔFVC −0.032 0.003
ΔICrest(L) −0.008 0.429 −0.001 −0.008 −0.029–0.028 0.963
ΔICdynamic(L) 0.005 0.734 0.018 0.183 −0.014–0.050 0.265
ΔIRV −0.023 0.119 R2= 0.393
Curvature1(Curve parameter
c)
Age −4.8x10⁻⁶ 0.774
−7.2x10⁻⁶
−0.061 −0.00004–0.00002 0.643
Sex −7.3x10⁻⁵ 0.746
−2.5x10⁻⁵
−0.016 −0.0004–0.0004 0.901
Height 0.001 0.586
cbaseline −0.406 0.033 −0.345 −0.254 −0.695–0.006 0.054
Δweight 7.5x10⁻⁶ 0.762 B
ΔFEV1 0.001 0.001 0.001 0.372 0.0002–0.002 0.013
ΔFVC 0.001 <0.001
ΔICrest(L) 0.0005 0.025 0.0004 0.268 −0.00002–0.001 0.192
ΔICdynamic(L) 0.0001 0.651 −0.001 −0.249 −0.001–0.0002 0.179
ΔIRV −0.0003 0.280
R2= 0.315
95 % confidence interval (CI) examined by linear regression in bivariate and multivariate analyses
CPET: cardio pulmonary exercise test;Δweight: weight at CPET2 minus weight at CPET1; FEV1: forced expired volume in one second,ΔFEV1: FEV1at CPET2 minus
FEV1at CPET1; FVC: forced vital capacity;ΔFVC: FVC at CPET2 minus FVC at CPET1; IC: inspiratory capacity;ΔICrestwas calculated as IC at rest at CPET2 minus IC at
rest at CPET 1;ΔIC was calculated as IC at start of the test minus IC at the end of the test;ΔICdynamicwas calculated asΔIC at CPET2 minusΔIC at CPET1; IRV:
inspiratory reserve volume;ΔIRV was calculated as IRV at CPET2 minus IRV at CPET1; abaseline:curve parameter a at baseline; bbaseline: curve parameter b at
baseline; cbaseline: curve parameter c at baseline; R2: The coefficient of determination 1
The relationship between ventilation (V̇E) and tidal volume (VT) was described by a quadratic model (VT= a + b·V̇E+ c·V̇E2), and the a, b, and c were calculated as
ECLIPSE study [10]. Without participation in pulmonary rehabilitation, the decline in V̇O2peakand V̇Epeakcould have
been larger, resulting in an even stronger association with the predictors.
Self-reported physical activity was not measured syn-chronized with the second CPET, but was part of the data collection at baseline, and at one and three year follow-up in BCCS. We have previously shown that pa-tients who participated in pulmonary rehabilitation were more physically active than those who had not [27]. We assume that the physical activity level would not be sub-stantially different from this recording.
The dropout rate from baseline to follow-up after a mean time of 4.5 years was 29 %. The patients were lost to follow-up mainly because of death or disease severity. In the study of Oga et al. [12] the dropout rate was 51 %. In longitudinal observational studies with the 6 min walking distance as the main outcome and a follow-up period of
3–5 years, the dropout rate varied between 31–34 %
[35–37]. With a progressive disease, an increasing dropout
rate over time is unavoidable and as compared with previous studies our dropout rate is not considered high.
Conclusions
There was a significant reduction in V̇O2peak and V̇Epeak
over 4.5 years in this group of COPD patients. The changes were related to an increase in lung hyperinflation and a
re-duction in FEV1along with persistent smoking during the
study period. The breathing pattern changed towards a
lower VTmaxand a lower VTat a given V̇E and the
reduc-tion in FEV1predicted these changes. The findings indicate
that optimal treatment of airway obstruction and lung hyperinflation, and smoking cessation are all important in optimizing functional capacity in COPD along with physical training programs.
Competing interests
The authors declare that they have no competing interests.
Authors’contributions
Concept and design (BF, ET, JAH, TMLE, PSB). Data collection (BF, JAH, TMLE, PSB, ET). Data analyses and interpretation (BF, BE, RMN, JAH, LIS, ET). Drafting the manuscript (BF, ET, BS, LIS, JAH, RMN). All the authors have revised and approved the final manuscript.
Acknowledgements
The authors thank Eli Nordeide, Lene Svendsen and Michael Storebø for participation in data collection and for help in organizing the study. We also wish to acknowledge the patients who participated in the study.
Author details
1Centre for Evidence-Based Practice, Bergen University College, Bergen,
Norway.2Department of Clinical Science, University of Bergen, Bergen, Norway.3Department of Global Public Health and Primary Care, University of Bergen, Bergen, Norway.4Department of Physiotherapy, Haukeland University Hospital, Bergen, Norway.5Department of Thoracic Medicine, Haukeland University Hospital, Bergen, Norway.6Department of Occupational Medicine, Haukeland University Hospital, Bergen, Norway.
Received: 27 February 2015 Accepted: 6 August 2015
References
1. Parshall MB, Schwartzstein RM, Adams L, Banzett RB, Manning HL, Bourbeau J, et al. An official American Thoracic Society statement: update on the mechanisms, assessment, and management of dyspnea. Am J Respir Crit Care Med. 2012;185:435–52.
2. Spruit MA, Singh SJ, Garvey C, ZuWallack R, Nici L, Rochester C, et al. An official American Thoracic Society/European Respiratory Society statement: key concepts and advances in pulmonary rehabilitation. Am J Respir Crit Care Med. 2013;188:e13–64.
3. Guenette JA, Chin RC, Cheng S, Dominelli PB, Raghavan N, Webb KA, et al. Mechanisms of exercise intolerance in global initiative for chronic obstructive lung disease grade 1 COPD. Eur Respir J. 2014;44:1177–87. 4. Hyatt RE. Expiratory flow limitation. J Appl Physiol. 1983;55:1–7. 5. O'Donnell DE, Webb KA. Exertional breathlessness in patients with chronic
airflow limitation. The role of lung hyperinflation. Am Rev Respir Dis. 1993;148:1351–7.
6. Somfay A, Porszasz J, Lee SM, Casaburi R. Effect of hyperoxia on gas exchange and lactate kinetics following exercise onset in nonhypoxemic COPD patients. Chest. 2002;121:393–400.
7. Gosselink R, Troosters T, Decramer M. Peripheral muscle weakness contributes to exercise limitation in COPD. Am J Respir Crit Care Med. 1996;153:976–80.
8. Seymour JM, Spruit MA, Hopkinson NS, Natanek SA, Man WD, Jackson A, et al. The prevalence of quadriceps weakness in COPD and the relationship with disease severity. Eur Respir J. 2010;36:81–8.
9. Tashkin DP, Celli B, Senn S, Burkhart D, Kesten S, Menjoge S, et al. A 4-year trial of tiotropium in chronic obstructive pulmonary disease. N Engl J Med. 2008;359:1543–54.
10. Vestbo J, Edwards LD, Scanlon PD, Yates JC, Agusti A, Bakke P, et al. Changes in forced expiratory volume in 1 second over time in COPD. N Engl J Med. 2011;365:1184–92.
11. Palange P, Ward SA, Carlsen KH, Casaburi R, Gallagher CG, Gosselink R, et al. Recommendations on the use of exercise testing in clinical practice. Eur Respir J. 2007;29:185–209. Epub 2007/01/02.
12. Oga T, Nishimura K, Tsukino M, Sato S, Hajiro T, Mishima M. Exercise capacity deterioration in patients with COPD: longitudinal evaluation over 5 years. Chest. 2005;128:62–9. Epub 2005/07/09.
13. Gallagher CG, Brown E, Younes M. Breathing pattern during maximal exercise and during submaximal exercise with hypercapnia. J Appl Physiol. 1987;63:238–44.
14. O'Donnell DE, Hamilton AL, Webb KA. Sensory-mechanical relationships during high-intensity, constant-work-rate exercise in COPD. J Appl Physiol. 2006;101:1025–35.
15. Cotes JE. Response to progressive exercise: a three-index test. Br J Dis Chest. 1972;66:169–84.
16. Neder JA, Dal Corso S, Malaguti C, Reis S, De Fuccio MB, Schmidt H, et al. The pattern and timing of breathing during incremental exercise: a normative study. Eur Respir J. 2003;21:530–8.
17. Hey EN, Lloyd BB, Cunningham DJ, Jukes MG, Bolton DP. Effects of various respiratory stimuli on the depth and frequency of breathing in man. Respir Physiol. 1966;1:193–205.
18. Frisk B, Espehaug B, Hardie JA, Strand LI, Moe-Nilssen R, Eagan TM, et al. Airway obstruction, dynamic hyperinflation, and breathing pattern during incremental exercise in COPD patients. Physiol Rep. 2014;2:e00222. 19. Eagan TM, Ueland T, Wagner PD, Hardie JA, Mollnes TE, Damas JK, et al.
Systemic inflammatory markers in COPD: results from the Bergen COPD Cohort Study. Eur Respir J. 2010;35:540–8. Epub 2009/08/01.
20. Johannessen A, Lehmann S, Omenaas ER, Eide GE, Bakke PS, Gulsvik A. Post-bronchodilator spirometry reference values in adults and implications for disease management. Am J Respir Crit Care Med. 2006;173:1316–25. Epub 2006/03/25.
21. Rabe KF, Hurd S, Anzueto A, Barnes PJ, Buist SA, Calverley P, et al. Global strategy for the diagnosis, management, and prevention of chronic obstructive pulmonary disease: GOLD executive summary. Am J Respir Crit Care Med. 2007;176:532–55.
23. Bruce RA. Exercise testing of patients with coronary heart disease. Principles and normal standards for evaluation. Ann Clin Res. 1971;3:323–32. 24. Bruce RA, Kusumi F, Hosmer D. Maximal oxygen intake and nomographic
assessment of functional aerobic impairment in cardiovascular disease. Am Heart J. 1973;85:546–62.
25. Borg G. Borg's Perceived exertion and pain scales, vol. viii. Champaign, IL: Human Kinetics; 1998. p. 104.
26. Gandevia B, Hugh-Jones P. Terminology for measurements of ventilatory capacity; a report to the thoracic society. Thorax. 1957;12:290–3. 27. Frisk B, Espehaug B, Hardie JA, Strand LI, Moe-Nilssen R, Eagan TM, et al.
Physical activity and longitudinal change in 6-min walk distance in COPD patients. Respir Med. 2014;108:86–94.
28. Kurtze N, Rangul V, Hustvedt BE, Flanders WD. Reliability and validity of self-reported physical activity in the Nord-Trondelag Health Study (HUNT 2). Eur J Epidemiol. 2007;22:379–87.
29. Kurtze N, Rangul V, Hustvedt BE, Flanders WD. Reliability and validity of self-reported physical activity in the Nord-Trondelag Health Study: HUNT 1. Scand J Public Health. 2008;36:52–61.
30. Stubbing DG, Pengelly LD, Morse JL, Jones NL. Pulmonary mechanics during exercise in subjects with chronic airflow obstruction. J Appl Physiol. 1980;49:511–5.
31. Yan S, Kaminski D, Sliwinski P. Reliability of inspiratory capacity for estimating end-expiratory lung volume changes during exercise in patients with chronic obstructive pulmonary disease. Am J Respir Crit Care Med. 1997;156:55–9.
32. Vogiatzis I, Georgiadou O, Golemati S, Aliverti A, Kosmas E, Kastanakis E, et al. Patterns of dynamic hyperinflation during exercise and recovery in patients with severe chronic obstructive pulmonary disease. Thorax. 2005;60:723–9.
33. Laveneziana P, Guenette JA, Webb KA, O'Donnell DE. New physiological insights into dyspnea and exercise intolerance in chronic obstructive pulmonary disease patients. Expert Rev Respir Med. 2012;6:651–62. 34. Casaburi R. Factors determining constant work rate exercise tolerance in
COPD and their role in dictating the minimal clinically important difference in response to interventions. COPD. 2005;2:131–6.
35. Casanova C, Cote CG, Marin JM, de Torres JP, Aguirre-Jaime A, Mendez R, et al. The 6-min walking distance: long-term follow up in patients with COPD. Eur Respir J. 2007;29:535–40. Epub 2006/11/17.
36. Kapella MC, Larson JL, Covey MK, Alex CG. Functional performance in chronic obstructive pulmonary disease declines with time. Med Sci Sports Exerc. 2011;43:218–24. Epub 2010/06/15.
37. Spruit MA, Polkey MI, Celli B, Edwards LD, Watkins ML, Pinto-Plata V, et al. Predicting outcomes from 6-minute walk distance in chronic obstructive pulmonary disease. J Am Med Dir Assoc. 2012;13:291–7. Epub 2011/07/23.
Submit your next manuscript to BioMed Central and take full advantage of:
• Convenient online submission
• Thorough peer review
• No space constraints or color figure charges
• Immediate publication on acceptance
• Inclusion in PubMed, CAS, Scopus and Google Scholar
• Research which is freely available for redistribution