Energy Efficient Target Detection Through
Waveform Selection for Multi-Sensor RF Sensing
Based Internet of Things
S.Bolisetti
†, M.Sharma
‡, M.Patwary
‡, A.Soliman
†, E.Benkhelifa
∗and M.Maguid
§ †School of Creative Arts and Engineering, Staffordshire University, Stoke-on-Trent, UK ‡School of Computing and Digital Technology, Birmingham City University, Birmingham, UK∗School of Computing and Digital Technologies, Staffordshire University, Stoke-on-Trent, UK §Department of Science and Technology, University Campus Suffolk, Ipswich, UK
Email: [email protected], {mak.sharma; mohammad.patwary}@bcu.ac.uk, [email protected], [email protected] and [email protected]
Abstract—In this paper, we explore multi-sensor Radio Fre-quency (RF) sensing based Internet of Things (IoT) for surveil-lance applications. RF sensing techniques are the next generation technologies which offer distinct advantages over traditional means of sensing. Traditionally, Energy detection (ED) has been used for surveillance applications due to its low computational complexity. However, ED is unreliable due to high false detection rates. There is a need to develop surveillance strategies which offer reliable target detection rates. In this paper, we have proposed a multi-sensor RF sensing based target detection architecture for IoT. To perform surveillance within IoT, multiple sensor nodes are required to co-exist while performing the desired tasks. Interfering waveforms from the neighbouring sensor nodes have a significant impact on the target detection reliability of IoT. In this paper, a waveform selection criterion has been proposed to optimise the target detection reliability and power consumption within IoT in the presence of interfering waveforms.
Index Terms—Energy efficiency, internet of things (IoT), multi-sensor, RF sensing
I. INTRODUCTION
Internet of Things (IoT) consist of low-cost, easy-to-deploy network of sensor nodes which are deployed within a pre-defined sensing region. Once deployed, the sensor nodes coordinate among themselves to perform assigned tasks. The sensor nodes are equipped with one or more sensing devices with limited power, processing, and communication capabil-ities. Due to low-cost and ease of deployment, IoT have found its place in numerous civilian and military applications [1, 2]. The sensor nodes can be deployed in hostile and harsh sensing environments and their ability to collectively monitor the sensing region, makes them ideal candidates for surveillance applications [3, 4]. Depending on the nature of the sensing application, the sensor nodes can either actively interact with the sensing environment or passively monitor the same. RF sensing based active detection techniques can provide increased reliability and higher target detection rates. The sensor nodes transmit RF signals into the sensing region and detect the presence of targets by observing the received echoes [5, 6]. Transmission of RF signals by the active sensor
nodes is associated with significant increase in the power con-sumption within the sensor nodes with limited available power. Efficient target detection strategies need to be developed to provide reliable target detection rates with reduced energy consumption.
II. RELATEDWORK
solu-tion for the choice of transmit waveforms is required which guarantees reliable target detection rates within the constraints of the given sensing conditions. In this paper, we considered the choice of transmit waveforms which are suitable for RF sensing based applications of IoT. The relevant waveform selection strategies to optimise the target detection reliability within the resource constraints of IoT have been proposed. The main contributions of this paper are,
• RF sensing based target detection architecture for surveil-lance applications of IoT.
• Suitable transmit waveform selection criterion for
application-specific IoT has been proposed.
• Target detection optimisation procedure in the presence
of interfering waveforms has been proposed.
Rest of the paper is organised as follows: Received signal model and problem formulation for the proposed IoT is dis-cussed in Section III. The transmit waveforms which are suit-able of IoT are discussed in Section IV. Hypothesis testing and the proposed target detection optimisation procedure through waveform selection is presented in Section V. In Section VI, we analyse the proposed waveform selection procedure and the performance of the proposed IoT through simulation results which is followed by the conclusion in Section VII
III. PROBLEMFORMULATION
The problem of interest is RF sensing based IoT whose primary objective is to provide surveillance within the sensing region. The proposed IoT consists of clusters of sensor nodes which are distributed within the sensing region. Each cluster consists of a primary node which acts as the cluster-head and a group of receiving nodes. The primary node within each cluster transmits the desired RF signal into the sensing region.
Test Statistic
Detection Interference
Threshold Communications Channel Tx
Rx
Interference Information
Target Impulse Response
Waveform Selection
Pulse Generator
Received Signal
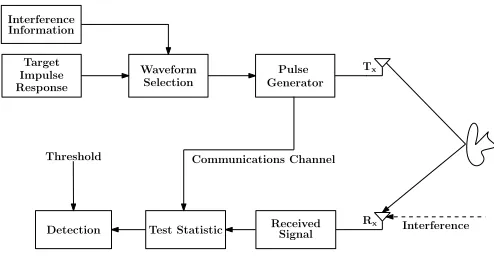
Fig. 1. Proposed Target Detection Model for IoT
As shown in Fig. 1, in the event of existence of a target within the sensing region, the receiving nodes attempt to detect the reflected echoes of the known transmitted signal. The primary node is assumed to have sufficient resources to transmit the desired RF waveforms. To meet the power constraints low-power UWB pulses are transmitted with short transmit durations. As a result of high bandwidth due to ultra-short nature of the transmit pulses, the reflected echoes are
characterised by the impulse response of the target. For a target impulse response of length Na and transmit UWB waveform s(t), the reflected echo from the target can be written as,
Ω(t) =a(t)∗s(t) (1)
where ∗ indicates the convolution operator and a is the target impulse response. It is assumed that IoT has the knowl-edge of the target’s impulse response. In the presence of noise and interfering waveforms, the received target echo at theith sensor node can be written as,
yi(n) =Asi(n) +Bhi(n) +wi(n) (2)
where yi is the Ny×1 received signal at the ith sensor node,si is theNt×1 transmitted waveform. Ais theNy× Nt convolution matrix for the target impulse response. hi is interfering waveform andwi is thermal noise.B isNy×Nt convolution matrix for the channel impulse response.
A=
a(1) 0 . . . 0
a(2) a(1) . .. . . . 0
..
. ... . .. . .. 0
a(Na) a(Na−1) . . . a(1) 0 0 a(Na) a(Na−1) . . . a(1) ..
. 0 a(Na) . . . a(2)
..
. ... 0 . .. ...
0 0 . . . 0 a(Na)
(3)
Here,Ny=Nt+Na - 1. The channel convolution matrixB can be written similarly as shown in (3). The complexity of the convolution matrix is dependent on the impulse response time and independent of the number of interfering sensor nodes. Estimation of channel impulse response has been addressed by the authors in the existing literature [16, 17] and in this paper, we assume that an estimate of the channel impulse response is available to the target detector.
IV. TRANSMITWAVEFORMS
The choice of an appropriate transmit waveform is an important design parameter for RF sensing based surveillance applications of IoT. To achieve longevity, optimum choice of a transmit waveform within IoT must fulfil the necessary criterion to achieve the desired target detection reliability while operating within the constraints of the available resources. Brevity of the transmit pulses is required to reduce the trans-mission costs. To reduce the signal processing complexities, the choice of a transmit waveform with good correlation properties is desirable. In this section, we study some of the transmit waveforms which are suitable for IoT and discuss their correlation properties [13–15].
IoT. The time domain expression of a Gaussian pulse can be written as,
g(t) =Aexp(−t
τ ) 2
(4)
Where A is the maximum amplitude and τ is the pulse width. The first derivative of the Gaussian pulse gives a Mono-cycle pulse which is also a commonly discussed waveform. The expression for a Monocycle pulse is,
m(t) =A(t
τ)exp(−( t τ)
2) (5)
Due to simplicity and ease of generation, the Gaussian and Monocycle pulses can be used within IoT with very low computational cost. However, within a large sensing region with multiple transmitting nodes the target detection rates severely deteriorate due to interference from the neighbouring sensor nodes. Hence a degree of diversity in the choice of waveforms among the transmitting nodes is required.
Orthogonal waveforms generated based on modified Gegen-bauer and Hermite polynomials can be used to generate short UWB pulses. The diversity in the available waveforms pro-vides a simple solution to allow multiple access. Gegenbauer polynomials are defined in the interval [-1,1]. The recurrence equation for the nth order Gegenbauer polynomial is written as,
Gn(β, t) =
2(n+β−1)
n tGn−1(β, t)−
(n+ 2β−2)
n Gn−2(β, t) (6)
G0(β, t) = 1 (7)
wherenis the order of the Gegenbauer polynomial andβis the shape parameter. Modified Gegenbauer polynomials use a weight function w(t) to facilitate the generation of ultra-short pulses. Modified Gegenbauer functions are written as,
G(β, t) = pw(t)Gn(β, t) (8)
w(t, β) = (1−t2)β−12 β > −1 2
Modified Hermite polynomials are defined in the interval [−∞,∞].nth order Hermite polynomial can be written as,
hen(t) = (−1)
net2
2 d n
dtn(e −t2
2 ) n6=0 (9)
he0(t) = 1
Modified Hermite polynomials are obtained by multiplying Hermite polynomials with e−t
2
4 . Anth order Modified Her-mite function is,
hn(t) =e −t2
4 he
n(t) (10)
The transmit waveforms discussed in this section are easy to generate and does not require complex transmitting devices. They also provide diversity within the choice of transmit waveforms. These proposed waveforms which are suitable
for UWB communications, can be transmitted as short pulses with reduced transmission costs. However, due to event driven nature of IoT and spatial displacement of the sensor nodes, orthogonal waveforms do not provide a generalised solution for multiple access.
V. TARGETDETECTIONOPTIMISATION
The performance measure of an IoT as a surveillance system while dedicated to detecting the existence or non-existence of targets is the degree of reliability on such decision-making process. The two possible outcomes of this decision-making process are hypothesis H0 and hypothesis H1 which are modelled as a binary hypothesis testing problem. Hypothesis H0represents absence of a target and hypothesisH1represents the existence of a target. The possible received signal models corresponding to hypothesis H0 andH1 are,
H0:
(
H00: y(n) =w(n)
H01: y(n) =Bh(n) +w(n) (11)
H1:
(
H10: y(n) =As(n) +w(n)
H11: y(n) =As(n) +Bh(n) +w(n)(12)
(11) and (12) represent possible received signal models under hypothesis H0 and H1 which are characterised by existence and absence of the target and the interfering wave-forms. A Cross-Correlation (CC) based detector is a popular technique which is used to detect the existence of known wave-forms within the received signal component. A CC detector performs cross-correlation between the received signal and the target signal to make a decision regarding the existence of the desired waveform.
r(∆T) = ∞
X
n=−∞
s(n−∆T)y(n) (13)
Where,∆Tis the time delay corresponding to a given range bin. However, as a consequence of the ultra-wide band nature of the transmit signal, the reflected echoes undergo shape transformation. Hence the optimal detector should match the scattered waveform in (1) with the received signal. If matched filter impulse response is f, then the matched filtered output of the received signal is given by,
x=fHy=fHAs+fHBh+fHw (14)
Signal to Interference and Noise Ratio (SINR) at the matched filter output is given by,
SIN R= |f
HAs|2
E[|fHBh|2] +E[|fHw|2] (15)
From [18], the matched filter impulse response that max-imises the SINR at the receiver can be written as,
Where, α is a scaling parameter and Rw is the noise covariance matrix. However, the matched filter in (16) only produces the maximum attainable SINR under the constraints of the transmitted waveform. From (14) and (16), the optimum transmit waveform that maximises the target return at the matched filter output can be written as,
ˆ
s= maxs sHAH(BhhHBH+Rw)−1As (17)
The solution to (17) can be obtained through eigen-analysis. The transmit waveform that maximises the matched filter output is the eigenvector corresponding to the maximum eigen-value ofAH(BhhHBH+R
w)−1A. However, the optimised waveform obtained in (17) is associated with transmission complexities and the resource constrained sensor nodes within the IoT may not have sufficient resources to transmit these waveforms. To reduce the transmission complexity, we con-sider the transmit waveforms discussed in Section IV. While the waveforms discussed in Section IV do not optimise the matched filter output, suitable waveform may be chosen which maximises the matched filter output within the constraints of the available transmit waveforms. However, maximising SINR is not the sufficient condition to optimise the target detection performance of IoT.
The matched filter compares the received signal with the expected target return to detect the existence of the target echo. A reliable decision regarding the existence or absence of a target can be made when the matched filter outputs under hypothesisH0andH1are clearly distinguishable. To measure the ability of the matched filter to make this distinction we define Ease of Detection Index (δ) in (18) which is measured at 3dB Signal-to-Interference Ratio (SIR). Here ? represents correlation operator. When the sensing conditions are known, the transmit waveform which maximises (δ) gives optimum reliability among the available choice of transmit waveforms. Within resource constrained IoT, the transmit power has a significant impact on the life time of the sensor nodes. The choice of transmit waveform while achieving high δ, must also be energy efficient to ensure longevity of the sensor nodes. The amount of transmit power required to guarantee a desired SIR at the receiver is related to various factors such as propagation losses, target impulse response, target range, etc. For given sensing conditions, the energy efficiency of the transmit waveform is defined by Energy Efficiency Index (η) which is the ratio of the amount of transmit power (PT m) required to guarantee a desired SIR at the matched filter output to the amount of transmit power (PT r) required to guarantee the desired SIR at the sensor node receiver which is given as,
η=PT m
PT r
= max(f
H?Bh)(As)H(As)
max(fH?As)(Bh)H(Bh) (19)
Energy efficiency index denotes the factor by which the transmit power may be reduced while ensuring desired SIR at the matched filter output. The transmit waveform which provides optimal balance between δ and η is chosen based on the criterion given by the ratio δ/η. Therefore, for given sensing conditions the transmit waveform which maximises δ/η optimises the target detection reliability of IoT.
VI. PERFORMANCEANALYSIS
In this section, we compare the optimality criterion of the waveforms discussed in Section IV. Simulations are performed in MATLAB and within simulations, the interfering waveform is assumed to be a Monocycle pulse and the presence of white Gaussian noise is assumed. IoT is assumed to be deployed to detect the presence of a target with known impulse response. In Table I,δandη of the waveforms considered under the given sensing conditions are summarised. High value of Ease of De-tection Index indicates greater target deDe-tection reliability and lower value for Energy Efficiency Index indicates improved transmission efficiency. From Table I it can be observed that for the simulated sensing conditions,G4andHm4waveforms generated highδ/η ratios compared to the other waveforms. Similarly,δ/ηratio ofHm1waveform is less than zero which indicates that for the given sensing conditionsHm1waveform is unsuitable for transmission.
TABLE I
COMPARISON OFGAUSSIAN ANDMONOCYCLEPULSES AUTOCORRELATIONFUNCTIONS
Waveform δ η (δ/η)
Gaussian Pulse 0.4553 0.2277 1.9995
G0 0.4045 0.2214 1.8272
G1 0.3906 0.3789 1.0309
G2 0.0357 0.5609 0.0636
G3 0.4180 0.1440 2.9024
G4 1.2945 0.0843 15.3645
Hm0 0.1969 0.4029 0.4888
Hm1 -0.0333 1.3813 -0.0241
Hm2 0.3603 0.2523 1.4281
Hm3 1.2444 0.0958 12.9957
Hm4 1.2675 0.0857 14.7904
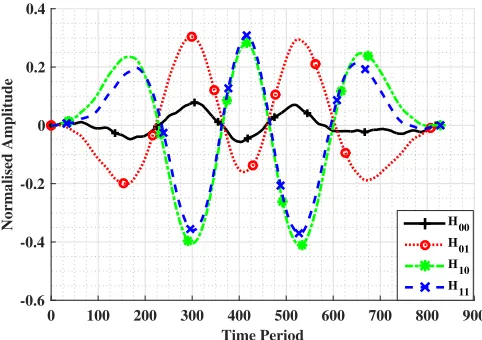
Matched Filter Output: In Fig. 2 and Fig. 3, the matched filter outputs of the received signal models under hypothesis H0 and H1 with transmit waveforms being G4 and Hm4 respectively are plotted. The transmission periods of individual sensor nodes within IoT are assumed to be unsynchronised. The matched filter outputs are plotted for all 4 cases of received signal models discussed in (11) and (12). H00 indi-cates the received signal model under hypothesis H0 where
δ=(max(f
H?As)−max(fH?Bh))(max(fH?(As+Bh))−max(fH?Bh))
the target and interfering waveforms are absent. Similarly, H01 refers to the received signal under hypothesis H0 in the presence of interfering waveform. Similarly, H10 and H11 refer to the received signal models under hypothesis H1 in the absence and presence of interfering waveform. From the plots, it can be observed that, whenG4andHm4waveforms are transmitted respectively, a clear distinction existed between matched filter outputs under hypothesis H0 and H1 which indicates greater detection reliability.
Time Period
0 100 200 300 400 500 600 700 800 900
Normalised Amplitude
-0.6 -0.4 -0.2 0 0.2 0.4 0.6 0.8 1
H00 H01 H10 H11
Fig. 2. Matched filter output for G4 transmit waveform and interfering
Monocycle pulse
Time Period
0 100 200 300 400 500 600 700 800 900
Normalised Amplitude
-1 -0.5 0 0.5 1
H 00 H
01 H
10 H
11
Fig. 3. Matched filter output for Hm4 transmit waveform and interfering
Monocycle pulse
Similarly, in Fig. 4, the matched filter output is plotted when G3 waveform is transmitted. In this case at 3dB SINR, while the matched filter output is maximised under hypothesis H1, a reduced distinction can be observed between hypothesisH0 and H1 along with lower dynamics. This leads to reduced detection reliability. In Fig. 5, the matched filter output is plotted when Hm1 waveform is transmitted. In this case, no distinction between matched filter outputs under hypothesis
H0 andH1can be observed which indicates an uncertainty in the decision-making process.
Time Period
0 100 200 300 400 500 600 700 800 900
Normalised Amplitude
-0.6 -0.4 -0.2 0 0.2 0.4 0.6 0.8
H 00 H
01 H
10 H
11
Fig. 4. Matched filter output for G3 transmit waveform and interfering
Monocycle pulse
Time Period
0 100 200 300 400 500 600 700 800 900
Normalised Amplitude
-0.6 -0.4 -0.2 0 0.2 0.4
H00 H01 H10 H11
Fig. 5. Matched filter output forHm1 transmit waveform and interfering
Monocycle pulse
Target Detection Performance:To make a decision regarding the existence of targets, a test statistic T is generated based on likelihood ratio test which is compared to a pre-defined thresholdγ. The test statistic for the detection problem based on matched filter output can be written as [19]:
T= f
Hy
yHy−fHy
H1
> <
H0
γ (20)
γis usually chosen such that the maximum false alarm rate
(Pf a) remains within an acceptable limit. For simulations,
γ is chosen to ensure a maximum allowable Pf a of 10−3. We resort to Monte-Carlo techniques for simulations with
Na is assumed to be 15. A traditional Energy detector (ED) is simulated to compare the detection reliability and power efficiency of the proposed method [20]. According to the results summarised in Table I and simulation results for the matched filter outputs discussed in this section, within the given sensing conditions,G4waveform is expected to provide optimum target detection performance. To verify the observa-tions, in Fig. 6 we compare the target detection performances of the proposed target detector whenG4andHm1waveforms are transmitted respectively. Clearly, when G4 waveform is transmitted the target detector outperformed its counterpart when Hm1 waveform is used. Moreover, traditional ED also outperformed target detection performance of the detector when Hm1 waveform is used.
SINR
-14 -12 -10 -8 -6 -4 -2 0
Probability of Detection
0 0.2 0.4 0.6 0.8
1 G
4
Hm1
Energy Detector
Fig. 6. Comparison of target detection performance when G4 and Hm1
waveforms are transmitted
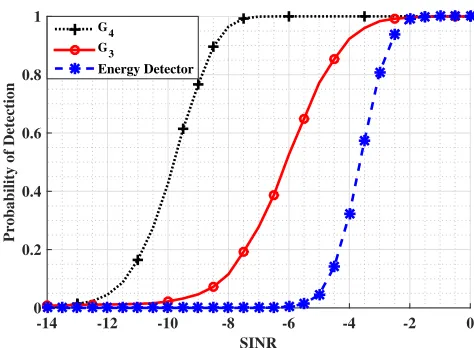
Similarly, in Fig. 7, the target detection performances are compared whenG4andG3waveforms are transmitted. While G3 provided a significant improvement in target detection performance when compared to Hm1, G4 outperformed G3 by a significant margin. However, target detection using G3 waveform outperformed the corresponding performance of traditional ED. Finally, in Fig. 8, the target detection per-formances are compared when G4 and Hm4 waveforms are transmitted. From Table I it can be observed that the difference betweenδ/ηratios ofG4andHm4waveforms are comparable which is validated through simulations in Fig. 8 with G4 slightly outperforming Hm4.
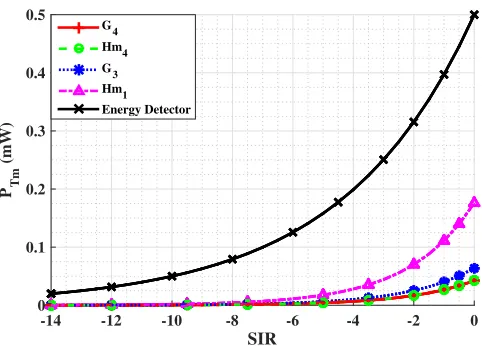
Within Eq. 20, the amount of transmit power,PT mrequired to guarantee a desired SIR at the matched filter output is measured as,
PT m=SIR2
max(fH?Bh)
max(fH?As)
2
(21)
At 0.5mW interfering signal strength, the power consump-tion of the transmit UWB waveforms based on the proposed waveform selection criterion is plotted in Fig. 9. Power
re-SINR
-14 -12 -10 -8 -6 -4 -2 0
Probability of Detection
0 0.2 0.4 0.6 0.8 1
G4 G3
Energy Detector
Fig. 7. Comparison of target detection performance when G4 and G3
waveforms are transmitted
SINR
-14 -12 -10 -8 -6 -4 -2 0
Probability of Detection
0 0.2 0.4 0.6 0.8 1
G4
Hm4
Energy Detector
Fig. 8. Comparison of target detection performance when G4 and Hm4
waveforms are transmitted
SIR
-14 -12 -10 -8 -6 -4 -2 0
P Tm
(mW)
0 0.1 0.2 0.3 0.4 0.5
G4 Hm4 G3 Hm1 Energy Detector
Fig. 9. Energy efficiency of the proposed waveform selection criterion
VII. CONCLUSION
We have investigated the waveform selection criterion in the context of energy efficiency and detection reliability within RF sensing based IoT for surveillance applications. The amount of power consumed during RF signal transmission is one of the major disadvantages of RF sensing when considered for low-powered device based IoT. Transmit waveforms within the range of UWB technologies which are suitable for resource constrained IoT have been explored. Various received signal models in the context of multi-sensor UWB based IoT have been discussed. Within an event driven IoT, where the trans-mission periods of individual sensor nodes are unsynchronised, we proposed a waveform selection criterion to optimise the target detection reliability. The proposed waveform selection criterion takes into account the nature of the target and sensing conditions to generate ease of detection index and energy efficiency index for all available transmit waveforms. Numerical results show the target detection performance and energy efficiencies of the proposed IoT for different choices of transmit waveforms. It has been shown that the proposed waveform selection criterion optimises the target detection reliability as well as the energy efficiency under the constraints of available choices of transmit waveforms. In the future work, authors consider deriving a reconfigurable and dynamic waveform selection feature for the existing GLRT detector to achieve increased the detection reliability while meeting the resource constraints of IoT.
REFERENCES
[1] D. Estrin, R. Govindan, J. Heidemann, and S. Kumar, “Next century challenges: Scalable coordination in sensor networks,” inProceedings of the 5th annual ACM/IEEE international conference on Mobile com-puting and networking, 1999, pp. 263–270.
[2] A. Arora, P. Dutta, S. Bapat, V. Kulathumani, H. Zhang, V. Naik, V. Mittal, H. Cao, M. Demirbas, M. Gouda, Y. Choi, T. Herman, S. Kulkarni, U. Arumugam, M. Nesterenko, A. Vora, and M. Miyashita, “A line in the sand: a wireless sensor network for target detection, classification, and tracking,” Computer Networks, vol. 46, no. 5, pp. 605 – 634, 2004, military Communications Systems and Technologies.
[3] M. Ali, A. Bhm, and M. Jonsson, “Wireless sensor networks for surveillance applications - a comparative survey of mac protocols,” in The Fourth International Conference on Wireless and Mobile Commu-nications, July 2008, pp. 399–403.
[4] F. T. Jaigirdar and M. M. Islam, “A new cost-effective approach for battlefield surveillance in wireless sensor networks,” in International Conference on Networking Systems and Security (NSysS), Jan 2016, pp. 1–6.
[5] P. K. Dutta, A. K. Arora, and S. B. Bibyk, “Towards radar-enabled sensor networks,” in 5th International Conference on Information Processing in Sensor Networks, April 2006, pp. 467–474.
[6] M. Ditzel and F. H. Elferink, “Low-power radar for wireless sensor networks,” inEuropean Radar Conference, Sept 2006, pp. 139–141. [7] S. K. Bolisetti, K. Ahmed, M. Patwary, and M. Abdel-Maguid,
“Com-pressive parametric glrt detector for airborne mimo radar,” in Interna-tional Conference on Wireless Communications and Signal Processing (WCSP), Nov 2011, pp. 1–5.
[8] N. Pulsone and M. Zatman, “A computationally efficient two-step implementation of the GLRT,”IEEE Transactions on Signal Processing, vol. 48, no. 3, pp. 609 –616, Mar 2000.
[9] E. Conte, A. De Maio, and G. Ricci, “GLRT-based adaptive detection algorithms for range-spread targets,” IEEE Transactions on Signal Processing, vol. 49, no. 7, pp. 1336 –1348, Jul 2001.
[10] S. K. Bolisetti, M. Patwary, K. Ahmed, A.-H. Soliman, and M. Abdel-Maguid, “Subspace compressive glrt detector for mimo radar in the presence of clutter,”The Scientific World Journal, vol. 2015, 2015. [11] “The samraksh company. user manual for the bumblebee: A
low-power, mote-scale pulsed doppler radar sensor board,”
https://samraksh.com/index.php/products/sensors/32-product-pages/products-sensors/71-bumblebee-radar, (Accessed on: 18-10-2016).
[12] L. Sakkila, A. Rivenq, C. Tatkeu, Y. ElHillali, F. Boukour, and J. M. Rouvaen, “Comparison of classical and orthogonal uwb waveforms for radar applications,” in 6th International Colloquium on Signal Processing its Applications, May 2010, pp. 1–5.
[13] F. Elbahhar, A. Rivenq-Menhaj, J. M. Rouvaen, M. Heddebaut, and T. Boukour, “Comparison between ds-cdma and modified gegenbauer functions for a multiuser communication ultra-wideband system,”IEE Proceedings - Communications, vol. 152, no. 6, pp. 1021–1027, Dec 2005.
[14] L. B. Michael, M. Ghavami, and R. Kohno, “Multiple pulse generator for ultra-wideband communication using hermite polynomial based orthogonal pulses,” in IEEE Conference on Ultra Wideband Systems and Technologies, May 2002, pp. 47–51.
[15] L. Sakkila, A. Rivenq, C. Tatkeu, Y. Elhillali, J.-P. Ghyset al., “Perfor-mances of micropower uwb radar using orthogonal waveforms,”Wireless Engineering and Technology, vol. 5, no. 03, p. 74, 2014.
[16] T. Aittomki and V. Koivunen, “Improved mimo radar channel estimation using spatial coding,” inIEEE International Conference on Acoustics, Speech and Signal Processing, May 2013, pp. 4120–4124.
[17] H. Hashemi, “Impulse response modeling of indoor radio propagation channels,”IEEE Journal on Selected Areas in Communications, vol. 11, no. 7, pp. 967–978, Sep 1993.
[18] C. Y. Chen and P. P. Vaidyanathan, “Mimo radar waveform optimiza-tion with prior informaoptimiza-tion of the extended target and clutter,” IEEE Transactions on Signal Processing, vol. 57, no. 9, pp. 3533–3544, Sept 2009.
[19] J. Liu, W. Liu, B. Chen, H. Liu, and H. Li, “Detection probability of a cfar matched filter with signal steering vector errors,” IEEE Signal Processing Letters, vol. 22, no. 12, pp. 2474–2478, Dec 2015. [20] N. Armi, B. A. W. Chaeriah, D. Mahmudin, P. Daud, and M. Arshad,