O R I G I N A L A R T I C L E
Open Access
Mapping QTLs using a novel source of
salinity tolerance from Hasawi and their
interaction with environments in rice
M. Akhlasur Rahman
1,2, Isaac Kofi Bimpong
3, J. B. Bizimana
4, Evangeline D. Pascual
5, Marydee Arceta
1,
B. P. Mallikarjuna Swamy
1, Faty Diaw
3, M. Sazzadur Rahman
2and R. K. Singh
1*Abstract
Background:Salinity is one of the most severe and widespread abiotic stresses that affect rice production. The identification of major-effect quantitative trait loci (QTLs) for traits related to salinity tolerance and understanding of QTL × environment interactions (QEIs) can help in more precise and faster development of salinity-tolerant rice varieties through marker-assisted breeding. Recombinant inbred lines (RILs) derived from IR29/Hasawi (a novel source of salinity) were screened for salinity tolerance in the IRRI phytotron in the Philippines (E1) and in two other diverse environments in Senegal (E2) and Tanzania (E3). QTLs were mapped for traits related to salinity tolerance at the seedling stage.
Results:The RILs were genotyped using 194 polymorphic SNPs (single nucleotide polymorphisms). After removing segregation distortion markers (SDM), a total of 145 and 135 SNPs were used to construct a genetic linkage map with a length of 1655 and 1662 cM, with an average marker density of 11.4 cM in E1 and 12.3 cM in E2 and E3, respectively. A total of 34 QTLs were identified on 10 chromosomes for five traits using ICIM-ADD and segregation distortion locus (SDL) mapping (IM-ADD) under salinity stress across environments. Eight major genomic regions on chromosome 1 between
170 and 175 cM (qSES1.3, qSES1.4, qSL1.2, qSL1.3, qRL1.1, qRL1.2, qFWsht1.2, qDWsht1.2), chromosome 4 at 32 cM (qSES4.1,
qFWsht4.2, qDWsht4.2), chromosome 6 at 115 cM (qFWsht6.1, qDWsht6.1), chromosome 8 at 105 cM (qFWsht8.1, qDWsht8.1),
and chromosome 12 at 78 cM (qFWsht12.1, qDWsht12.1) have co-localized QTLs for the multiple traits that might be
governing seedling stage salinity tolerance through multiple traits in different phenotyping environments, thus suggesting these as hot spots for tolerance of salinity. Forty-nine and 30 significant pair-wise epistatic interactions were detected between QTL-linked and QTL-unlinked regions using single-environment and multi-environment analyses.
Conclusions:The identification of genomic regions for salinity tolerance in the RILs showed that Hasawi possesses alleles that are novel for salinity tolerance. The common regions for the multiple QTLs across environments as co-localized regions on chromosomes 1, 4, 6, 8, and 12 could be due to linkage or pleiotropic effect, which might be helpful for multiple QTL introgression for marker-assisted breeding programs to improve the salinity tolerance of adaptive and popular but otherwise salinity-sensitive rice varieties.
Keywords:Hasawi-ausrice landrace, Single nucleotide polymorphism (SNP), Novel QTLs, QTL × environment interactions, Seedling-stage salinity tolerance
* Correspondence:[email protected]
1International Rice Research Institute (IRRI), DAPO Box 7777, Metro Manila,
Philippines
Full list of author information is available at the end of the article
Background
Unfavorable environmental conditions such as salinity, drought, heat, and submergence pose a huge threat to agricultural production and productivity and challenge future food security. Abiotic stresses cause crop yield losses of more than 50% and this is expected to worsen further because of climate change, so there is an urgent need to develop climate-smart crop varieties to counteract abiotic stresses and to sustain food production (Zeigler and Barclay 2008; Kumari et al. 2009; Khan et al. 2016). Salinity is one of the widest-spread and most severe abiotic stresses that affect rice production and productivity worldwide (Flowers 2004).
Rice (Oryza sativa L.) is the major staple food for almost one-half of the world’s population, so sustained rice production and productivity are essential for food security. However, the rice crop is sensitive to salinity stress during different stages of its growth and develop-ment, and this stress at the seedling stage is most severe and can sometimes cause complete crop failure (Munns and Tester 2008; Singh et al. 2010; Hossain et al. 2015; Munns and Gilliham 2015). The prevalence of higher sodium ions (Na+) in saline conditions is harmful to the growth and development of rice plants because of the negative effect on photosynthesis that leads to a reduc-tion in plant growth, chlorophyll content, and metabolic processes (Qados 2011; Munns and Gilliham 2015; Rahman et al. 2016). Transplanting cost is one of the major resource-consuming activities and it could be reduced using recent techniques such as direct-seeded rice (DSR). But, DSR is not feasible in salt-affected areas as rice seedlings are very sensitive to salinity stress; hence, the recommendation for salt-affected soils is to plant seedlings older than the normal 21-day-old seedlings. Thus, salinity tolerance at the seedling stage is crucial for good crop establishment, especially in coastal areas. Various mechanisms such as preferential uptake of potassium ions (K+), sodium exclusion from roots, and its restricted transport to shoots have been reported to confer salinity tolerance in rice (Kader et al. 2006; Wu et al. 2009; Singh and Flowers 2010; Rahman et al. 2016). However, salinity tolerance is a complex trait governed by genetic factors such as multiple QTLs and their interactions (epistasis), and is also significantly influenced by environmental factors (Wurschum et al. 2013; Roy et al. 2014; Khan et al. 2016; Liu et al. 2016).
Recent advances in molecular marker technology have enabled the dissection of the genetic basis of salinity tolerance to identify major-effect QTLs and their use in marker-assisted breeding to develop salinity-tolerant rice varieties (Munns 2005; Tuberosa and Salvi 2006; Passioura et al. 2007; Thomson et al. 2010, 2012; Thomson 2014; Hossain et al. 2015). Several studies have reported QTLs for traits related to salinity tolerance.
Precise and rapid exploitation of rice germplasm by identifying useful alleles and introgressing them into elite rice varieties is a key to successful breeding programs (Negrao et al. 2008). A new source of salinity tolerance,
“Hasawi,”anauslandrace from Saudi Arabia, is found to have higher Na+ exclusion and early seedling vigor (Thomson et al. 2010; Al-Mssallem et al. 2011; Rahman et al. 2016; Bizimana et al. 2017). Salinity tolerance in Pokkali is due to its capacity to maintain a low Na+-K+ ratio in the shoot tissue (ion-homeostasis) and its faster growth rate under saline conditions (Walia et al. 2005; Ismail et al. 2007; Singh et al. 2010; Thomson et al. 2010), and in Nona Bokra to maintaining higher shoot K+content under salt stress (Ren et al. 2005). Bimpong et al. (2014) have reported four grain yield-enhancing QTLs (qPH8, qDTF8,qTN8, andqTN8) from Hasawi even for the repro-ductive stage under saline conditions.
Even though Hasawi is a highly salt-tolerant genotype, it does not have the same tolerance allele as Pokkali and Nona Bokra atSaltolandSKC1(OsHKT1;5), which is a major QTL/gene for salinity tolerance. It has been recently reported that Hasawi is a new source of alleles for salinity tolerance (Bimpong et al. 2014; Bizimana et al. 2017).
The main objectives of our study were to screen IR29/ Hasawi-derived RIL populations for seedling-stage salinity tolerance to identify large-effect novel QTLs for traits related to salinity tolerance, to identify epistatic QTLs, to understand the effect of QTL × environment inter-actions on salinity tolerance, and to identify the RILs with higher salinity tolerance. The novel QTLs identi-fied can be used in marker-assisted QTL pyramiding with other known QTLs to enhance the degree of salinity tolerance in rice.
Methods
In an attempt to identify robust QTLs for salinity tolerance at the seedling stage using a novel donor, the following activities were carried out.
Plant materials
except for rain protection. Both the E2 and E3 sites received the identical set of RILs.
Each RIL was advanced to constitute the phenotyping population (F5:6), in which F5plants were used for
genotyp-ing and F5-derived F6seedlings/plants were phenotyped at
the seedling stage for salinity tolerance at all three phenotyp-ing sites. We followed selective mappphenotyp-ing for the study, which is a well-established and robust method for QTL mapping if resources are limited (Lander and Botstein 1989). A subset of 142 common RILs evaluated in both Senegal and Tanzania was genotyped at IRRI, Philippines. The RILs used for genotyping from the set phenotyped at IRRI were completely different (except for three RILs) from those in the set phenotyped in Senegal and Tanzania. This different RIL set used for phenotyping at IRRI consisted of 155 individuals.
Environmental classification
This IR29/Hasawi RIL population was evaluated in three different countries using the nutrient solution culture technique following modified Yoshida nutrient solution (Singh and Flowers 2010) in the IRRI phytotron, Philippines (Southeast Asia), and in open screenhouse conditions in Tanzania (East Africa) and the AfricaRice Sahel regional station in Senegal (West Africa).
Evaluation of F5:6RILs for salt tolerance
Screening of Hasawi, IR29, and the 300 F5:6 RILs for
salinity tolerance was carried out in a hydroponic system following IRRI standard protocol (Gregorio et al. 1997). Seeds were heat-treated for 5 days in a convection oven set at 48 °C to break seed dormancy, and, after that, the seeds were placed in petri dishes with two layers of paper towels, moistened with distilled water during 48 h for uniform germination. The germinated seeds were sown one seed per hole on a styrofoam sheet with 96 holes, attached to a nylon net bottom, and the sheet was floated on modified Yoshida nutrient solution (Singh et al. 2010). The seedlings were salinized after 5 days using 6 dS m−1salt (NaCl) concentration (equivalent to about 60 mM NaCl). This concentration was increased to 12 dS m−1(~120 mM) after 2 days of 6 dS m−1treatments to reduce the immediate shock. Each genotype was repre-sented by five seedlings per row of styrofoam and replicated thrice in the experiment. The experiment in the Philippines was conducted in a controlled phytotron with 29/21 °C day and night temperature with 70 ± 10% relative humidity. The screenhouse temperature recorded during the experi-ments in Senegal ranged from 17 to 28 °C in the morning and from 36 to 44 °C in the afternoon. The mean relative humidity varied between 35% and 95%. However, the ex-periment in Tanzania was conducted in a screenhouse covered by plastic on top only, with a minimum temperature of 24 °C and maximum of 37 °C. The
minimum relative humidity was 51% and the maximum 84%, with natural daylight of about 14 h. The pH of the solution was adjusted and maintained at 5.0 to 5.1 every day with acid (1 N HCl) or base (1 N NaOH). The nutrient solu-tion was renewed once every week to limit the effect of algae and to replenish the nutrients. Scoring as per the standard evaluation system (SES) was used and recorded 12 and 25 days after the imposition of salinity stress to finally score the genotype for overall degree of tolerance. All RILs were monitored and scored based on visual symptoms of salt stress injury. The following IRRI modified standard evalu-ation system (SES) for rice was used (IRRI 2007).
Score Symptom/observation Degree of
tolerance
1 Normal growth, only the old leaves show white tips while no symptoms on young leaves
Highly tolerant
3 Near normal growth, but only leaf tips burn, few older leaves become whitish partially and rolled
Tolerant
5 Growth severely retarded; most leaves severely injured, few young leaves elongating
Moderately tolerant
7 Complete cessation of growth; most leaves dried; only a few young leaves still green
Sensitive
9 Almost all plants dead or dying Highly sensitive
Other phenotypic parameters such as root and shoot length (RL and SL), shoot fresh weight (FWSht), and shoot dry weight (DWSht) were measured after 25 days.
Genotyping
DNA extraction, quantification, and quality control
We followed the approach of selective genotyping (Lander and Botstein 1989) to increase the efficiency of QTL mapping (Lin and Ritland 1996). Seedling SES injury score (final) was used as the parameter to select the genotypes from extremes and also randomly. Out of 300 genotypes, we picked 142 RILs that comprised the 7 most tolerant genotypes (SES score 1–3) and 34 most sensitive ones (SES score 9), and the rest (101) were random genotypes with intermediate to sensitive SES score (5–7). However, in the Philippines, an almost equal number of tolerant, intermediate, and sensitive genotypes was used for genotyping. Genomic DNA was isolated from young leaves using the CTAB (cetyl trimethyl ammonium bromide) mini-preparation method (Murray and Thompson 1980).
Scoring of SNPs and analysis of polymorphism
normalized to 50 ng/μL. For the SNP analysis, the (Illumina 2008) GoldenGate assay (Fan et al. 2003) was performed using VeraCode technology on a BeadXpress Reader according to the manufacturer’s protocol. Briefly, about 250 ng of genomic DNA was used to make biotinylated genomic DNA, which then underwent oligonucleotide hybridization to bind the samples to paramagnetic particles, followed by allele-specific exten-sion and ligation, PCR, hybridization to the VeraCode Bead Plate, and scanning on the BeadXpress Reader. The ana-lysis employed the VC0011439-OPA set of 384 SNP markers designed to be informative acrossindicaandaus germplasm (Thomson et al. 2012) and was run in the Genotyping Services Laboratory at IRRI (Thomson 2014; http://gsl.irri.org). Raw hybridization intensity data pro-cessing was performed using the genotyping module in the BeadStudio package (Illumina, San Diego, CA, USA), followed by allele calling using ALCHEMY software (Wright et al. 2010). Graphical genotyping of both IR29 and Hasawi was performed using Flapjack (https://ics.hutton.ac.uk/flapjack/) software developed by the Scottish Crop Research Institute to check poly-morphisms. After the polymorphism survey and filter-ing for low call rates, we found 194 SNPs as polymorphic (which is about 50%) for analysis.
SNP linkage map and QTL analysis
Of the 384 SNPs used for the parental polymorphism survey, 194 that were polymorphic were selected for QTL analysis but we had to drop a large number of SNPs for the construction of a linkage map due to segregation distortion (SD).
We used ICIMapping ver. 4.0.1 software (www.isbreeding. net) for the genetic linkage map construction and QTL analysis. Then, a genetic linkage group was constructed based on recombination frequency and SNP ordering was done using the ordering algorithm of RECORD (without imposing marker order) coming from REcombination Counting and ORDering, proposed by van Os et al. (2005a, 2005b). RECORD was developed to produce accurate marker orders in a relatively short time by employing the total number of observable recombination events between adjacent markers as a target function (Wang et al. 2012), although RECORD is not capable of handling populations with high heterozygous loci (Liu et al. 2014). However, it (RECORD) can deal with BC1,
F2, F3, and RIL (in fact, any generation obtained by
repeated selfing of a hybrid between homozygous parents) mapping populations (van Os et al. 2005a, 2005b). We chose the best ordering algorithm and rippling criteria for fine tuning of the linkage map, which was not used as the input method. COUNT (number of recombination events) algorithm was used for rippling. Rippling was used for fine-tuning of the
ordered chromosomes. The Chi-square (χ2) test was performed using whole data on a 1:1 basis. The highly distorted markers with <5% probability of either allele for IR29 or Hasawi were discarded; while less or non-distorted markers were included for the linkage map construction and QTL analysis. Segregation distortion markers (SDM) were removed to increase statistical power. The inclusive composite interval mapping (ICIM-ADD) method was used to identify more precise QTLs. For additive mapping, ICIM-ADD retains all advantages of CIM over IM, and avoids the possible increase of sampling variance and the complicated background marker selection process in CIM. Extensive simulations using different genomes and various genetic models indicate that ICIM has increased detection power, reduced false detection rate, and resulted in less biased estimates of QTL effects than CIM in additive (and dominance) mapping. Exten-sive simulations also show that ICIM is an efficient method for epistasis mapping, and QTL epistatic net-works can be identified no matter whether the two QTL have any additive effects (Wang et al. 2014; Xu 2008). The minimal LOD value required to declare a significant QTL was obtained empirically from 1000 permutation tests (Churchill and Doerge 1994). The proportion of the total phenotypic variance explained (PVE) by each QTL was calculated as R2value (R2= PVE). The QTLs were named based on the nomenclature pro-cedure suggested by McCouch et al. (1997) and McCouch and CGSNL (2008).
The digenic (epistatic) interactions between marker loci were determined and single environment (SE) and multi-environment (ME) joint analyses were performed using the multi-environment trials (MET) program in QTL IciMapping ver. 4.0.1 (Wang et al. 2014) to detect QEIs with LOD thresholds of 3.0. We followed the approach of Zhang et al. (2010) in which only reliable QTLs detected by both single and multi-environment analysis were reported.
Results
The QTLs and QEIs identified by ICIM in the IR29/Hasawi RIL population were based on phenotypic evaluation in three different environments.
salt stress at the seedling stage as indicated by the higher values for these parameters (Table 1).
Genotypic analysis
We used single nucleotide polymorphic markers to determine the polymorphism between the two parents (Hasawi and IR29). In all, 194 SNPs out of 384 (50.52%) showed polymorphism between the parents. After removing distorted markers, 145 SNP markers were used in E1 and 135 markers in E2 and E3 to perform genetic linkage analysis. They were distributed throughout the rice genome and covered a total length of 1655 cM using E1 genotyping data and 1662 cM using E2 and E3 genotyping data, with an average interval of 11.4 and 12.3 cM between markers, respectively. The highest marker density was found on chromosome 1 (23), with an average interval of 10 cM (Additional file 1: Table S1).
Marker segregation distortion analysis
The expected genotypic ratio of 1:1 in the F5:6 RIL population for homozygous IR29:homozygous Hasawi allele varied with three categories. First, with no segregation distortion that accounted for 40 SNPs (in E1) and 37 SNPs (E2 and E3); second, very highly distorted markers (<5% probability of either allele) varied from Mendelian segregation ratio for this RIL population, and less distorted markers (105 for E1 and 98 for E2 and E3). Only non-distorted and less distorted markers were used for mapping studies. When selective mapping is followed, some of the segregation distortions happen due to a sampling effect as well. The whole population was subjected to χ2 significance (P = 0.05) before
analyzing the data. This was done to avoid false link-ages from the expected Mendelian segregation ratio. In-deed, little SD for the specific markers is expected to have the effect of the allele through marker-trait associ-ation; otherwise, this association will not be reflected as a significant QTL. Hackett and Broadfoot (2003) suggested that segregation distortion causes very little effect on both marker order and map length.
QTL analysis
Inclusive composite interval mapping (ICIM-ADD) was employed to identify putative QTLs. However, the QTLs reported here were identified after constructing the genetic linkage map using ordering algorithm (RECORD) instead of the input method. A total of 34 different QTLs were identified in three diverse saline environments (Table 2). The QTLs conferring tolerance of salinity at the seedling stage were identified on 10 chromosomes: chromosome 1 (qSES1.1, qSES1.2, qSES1.3, qSES1.4, qSES1.5, qSL1.1, qSL1.2, qSL1.3, qSL1.4, qRL1.1, qRL1.2, qFWsht1.1, qFWsht1.2, qFWsht1.3, qDWsht1.1, qDWsht1.2, qDWsht1.3); chromosome 2 (qFWsht2.1); chromosome 3 (qRL3.1); chromosome 4 (qSES4.1, qFWsht4.1, qFWsht4.2, qDWsht4.1,
qDWsht4.2); chromosome 5 (qDWsht5.1); chromosome
6 (qFWsht6.1, qDWsht6.1); chromosome 7 (qDWsht7.1); chromosome 8 (qFWsht8.1, qDWsht8.1); chromosome 11 (qRL11.1); and chromosome 12 (qSL12.1, qFWsh12.1, qDWsht12.1). One QTL (qFWsht 6.1) was identified in two different environments (E2 and E3) within the same chromosomal location. The details of the QTLs are presented in Table 2. The QTLs with a large effect are also illustrated on the molecular linkage map (Fig. 1 based on E1 and Fig. 2 based on E2 and E3).
QTLs for salinity tolerance at seedling stage
Overall phenotypic performance (SES)
Six QTLs (qSES1.1,qSES1.2,qSES1.3, qSES1.4, qSES1.5,
and qSES4.1) were evaluated by the SES in controlled
(evaluated for salinity tolerance under phytotron conditions) Environment-1 (Philippines) with significant LOD value (3.2–20.6) and PVE ranging from 5.4% to 42.3%. The Hasawi allele increased the overall phenotypic perform-ance and reduced SES visual scores at five loci except qSES1.5,where the allelic effect comes from IR29 (Table 2). The QTLs (qSES1.3 and qSES1.4) on the long arm of chromosome 1 are located in a similar region asqSL1.2and qSL1.3in E1.qSES1.4, located between markers id1023892 and id1017885 on chromosome 1, had the largest PVE (42.3%) and was additive in nature.
Shoot length
Four QTL regions (qSL1.1, qSL1.2, qSL1.3, qSL1.4) with significant LOD value (3.3–6.5) were identified for SL on the long arm of chromosome 1 and one QTL (qSL12.1)
Table 1Correlation coefficients among different traits in an F5(RIL) population of a cross between IR29 (salt sensitive) and Hasawi (salt tolerant) at seedling stage under three different environments
Environment Trait SES RL SL FWsht
Philippines RL −0.45a
SL −0.18b 0.12ns
FWsht −0.76a 0.35a 0.43a
DWsht −0.76a 0.34a 0.41a 0.98a
Tanzania RL −0.75a
SL −0.64a 0.70a
FWsht −0.79a 0.67a 0.64a
DWsht −0.86a 0.75a 0.74a 0.84a
Senegal RL −0.44a
SL −0.46a 0.33a
FWsht −0.50a 0.40a 0.46a
DWsht −0.34a 0.19b 0.33a 0.45a SESStandard evaluation system score based on salt stress symptoms,SLShoot length,RLRoot length,FWshtShoot fresh weight,DWshtShoot dry weight,
nsnon-significant
a
located at 58 cM on chromosome 12 in E1 had PVE ranging from 7.2% to 19.5%. qSL1.2 is located between SNP markers id1024972 and id1023892 and co-located with two other QTLs (qSES1.3 and qRL1.1). qSL1.3 is detected between id1023892 and id1017885 and shared a common genomic region with four other large-effect QTLs (qSES1.4, qRL1.2, qFWsht1.2, and qDWsht1.2) on the long arm of chromosome 1 (Table 2).
Root length
Four root-length QTLs (qRL1.1, qRL1.2, qRL3.1, and qRL11.1) with significant LOD value (3.2–5.0) were detected on chromosomes 1, 3, and 11 in the Philippines. These QTLs had PVE of 14.3%, 13.5%, 21.9%, and 14.7%, respect-ively. Hasawi alleles contributed to longer root length. Two QTLs (qRL1.1 and qRL1.2) located between id1024972-id1023892 and id1024972-id1023892-id1017885 were additive.
Table 2QTLs for traits related to salt tolerance during seedling stage in an IR29/Hasawi RIL population in three environments
Trait QTL Chr Position (cM) Marker interval Allele LOD PVE (%) Add E Method
SES qSES1.1 1 110 ud1000711-id1004348 Hasawi 3.2 10.7 −0.31 E1 ICIM
qSES1.2 1 128 id1004348-id1015258 Hasawi 4.9 8.8 −0.27 E1 ICIM
qSES1.3 1 170 id1024972-id1023892 Hasawi 17.5 39.9 −0.58 E1 IM, ICIM
qSES1.4 1 175 id1023892-id1017885 Hasawi 20.6 42.3 −0.60 E1 IM,−ICIM
qSES1.5 1 194 id1003559-id1002308 IR29 3.8 5.4 0.24 E1 -IM, ICIM
qSES4.1 4 32 id4008522-id4008092 Hasawi 3.8 5.8 −0.23 E1 IM, ICIM
SL qSL1.1 1 59 id1024836-id1025983 Hasawi 4.4 18.5 −2.13 E2 IM, ICIM
qSL1.2 1 169 id1024972-id1023892 Hasawi 6.5 17.9 −3.25 E1 IM, ICIM
qSL1.3 1 177 id1023892-id1017885 Hasawi 5.7 19.5 −3.40 E1 IM, ICIM
qSL1.4 1 221 id1024836-id1016633 IR29 5.6 15.3 3.36 E1 IM, ICIM
qSL12.1 12 58 id12007988-id12005823 IR29 3.3 7.2 2.23 E1 IM, ICIM
RL qRL1.1 1 168 id1024972- id1023892 Hasawi 4.8 14.3 −1.09 E1 IM, ICIM
qRL1.2 1 175 id1023892-id1017885 Hasawi 4.2 13.5 −1.06 E1 IM, ICIM
qRL3.1 3 104 id3200001-id3010345 Hasawi 3.2 21.9 −1.53 E1 IM
qRL11.1 11 22 id11007488-id11008862 IR29 5.0 14.7 2.11 E1 IM, ICIM
FWsht qFWsht1.1 1 0 id1002899-id1016436 Hasawi 5.5 10.2 −0.09 E1 IM, ICIM
qFWsht1.2 1 175 id1023892-id1017885 Hasawi 3.6 21.1 −0.12 E1 IM
qFWsht1.3 1 194 id1003559-id1002308 Hasawi 4.5 13.8 −0.11 E1 IM
qFWsht2.1 2 55 id2007526-fd12 Hasawi 3.1 27.2 −0.12 E2 IM, ICIM
qFWsht4.1 4 12 id4003259-id4007105 IR29 6.1 28.9 0.14 E1 IM, ICIM
qFWsht4.2 4 32 id4008522-id4008092 IR29 4.3 8.8 0.08 E1 IM, ICIM
qFWsht6.1 6 115 id6016941-id6001397 IR29 3.2 37.8 0.22 E2 IM, ICIM
qFWsht6.1 6 115 id6016941-id6001397 IR29 3.3 47.1 0.56 E3 IM, ICIM
qFWsht8.1 8 105 id8007301-id8000240 IR29 3.5 47.1 0.55 E3 IM, ICIM
qFWsht12.1 12 78 id12003019-id12005205 IR29 4.4 8.0 0.09 E1 ICIM
DWsht qDWsht1.1 1 0 id1002899-id1016436 Hasawi 3.4 5.5 −0.02 E1 IM, ICIM
qDWsht1.2 1 175 id1023892-id1017885 Hasawi 3.4 19.6 −0.03 E1 IM
qDWsht1.3 1 194 id1003559-id1002308 Hasawi 3.9 12.0 −0.02 E1 IM
qDWsht4.1 4 13 id4003259-id4007105 IR29 8.3 30.1 0.03 E1 IM, ICIM
qDWsht4.2 4 32 id4008522-id4008092 IR29 3.2 5.9 0.02 E1 IM, ICIM
qDWsht5.1 5 38 id5007714-id5014589 IR29 3.2 46.9 0.12 E3 IM, ICIM
qDWsht6.1 6 115 id6016941-id6001397 IR29 3.7 48.4 0.12 E3 IM, ICIM
qDWsht7.1 7 107 ud7000066-id7000461 IR29 3.3 5.7 0.02 E1 IM, ICIM
qDWsht8.1 8 105 id8007301-id8000240 IR29 3.8 47.2 0.12 E3 IM, ICIM
qDWsht12.1 12 78 id12003019-id12005205 IR29 4.6 7.5 0.02 E1 IM, ICIM
ChrChromosome,LODLog of odds,AddAdditive effect,IMInterval mapping,ICIMInclusive composite interval mapping,EEnvironment,E1Philippines,E2
Shoot fresh weight
Nine genomic regions were identified for shoot fresh weight with significant LOD of 3.1 to 6.1. Three FWsht QTLs (qFWsht1.1, qFWsht1.2, qFWsht1.3) were located on chromosome 1 with LOD value of 3.6–5.5 and they accounted for PVE of 10.2%, 21.1%, and 13.8%, respectively, and Hasawi had positive effects on shoot fresh weight in the Philippines. This QTL (qFWsht1.2) was co-located with four other important genomic regions (qSES1.4, qRL1.2, qSL1.3, andqDWsht1.2) on the long arm of chromosome 1. One QTL (qFWsht6.1) was identified in both E2 and E3 with positive effects from IR29.qFWsht12.1shared a com-mon location withqDWsht12.1 at 78 cM on chromosome 12 (Table 2).
Shoot dry weight
In the Philippines, ICIM-ADD detected 10 significant QTLs (qDWsht1.1, qDWsht1.2, qDWsht1.3, qDWsht4.1, qDWsht4.2, qDWsht5.1, qDWsht6.1, qDWsht7.1, qDWsht8.1, andqDWsht12.1) with LOD value ranging from 3.2 to 8.3 for shoot dry weight on seven chromosomes (1, 4, 5, 6, 7, 8, and 12) near markers id1002899, id1023892, id1003559, id4003259, id4008522, id5007714, id6016941, ud7000066, id8007301, and id12003019, which explained PVE ranging from 5.5% to 48.4%. Out of seven QTLs, three located on chromosome 1 (qDWsht1.1 at zero (0) cM; qDWsht1.2 at 175 cM; qDWsht1.3at 194 cM), two on chromosome
4 (qDWsht4.1at 12 cM andqDWsht4.2 at 32 cM), one
on chromosome 8 (qDWsht8.1 at 105 cM), and one on chromosome 12 (qDWsht12.1at 78 cM) were observed to share common genomic regions with QTLs conferring for shoot fresh weight and SES score. qDWsht6.1 (E3) is co-localized with QTLsqFWsht6.1(E2) and qFWsht6.1 (E3) and has PVE of 48.4% (Table 2).
As per the multi-locus analysis, QTLs identified on different chromosomes are considered independent of each other, and their effects were generally additive in nature. For example, the major QTLs for SES score on chromo-some 1 (flanked by markers id1024972-id1023892, with PVE of 39.9%, and another located between id1023892 and id1017885, with PVE of 42.3%) and chromosome 4 (flanked by markers id4008522-id4008092, with PVE of 5.8%) together accounted for 88.0% of the total PVE observed in the study from the Philippines. Likewise, the combined effect of three QTLs (qDWsht1.2, R2
= 19.6%;qDWsht1.3, R2= 12.0%;qDWsht4.1, R2= 30.1%) explained 61.7% of the total phenotypic variance for overall shoot dry weight, which is a part of the phenotypic performance that affects SES score in the Philippines. SES score is based on plant vigor and higher plant vigor comes from vigorous shoot growth; hence, a lower SES score and more shoot biomass will eventually give more shoot dry weight and this clearly indicates that these are traits indir-ectly linked to each other.
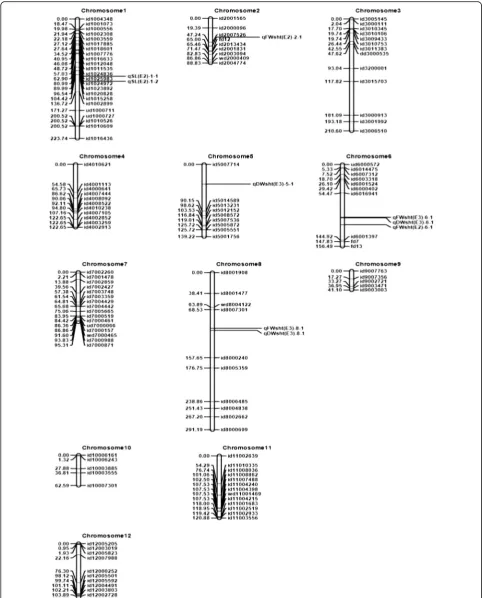
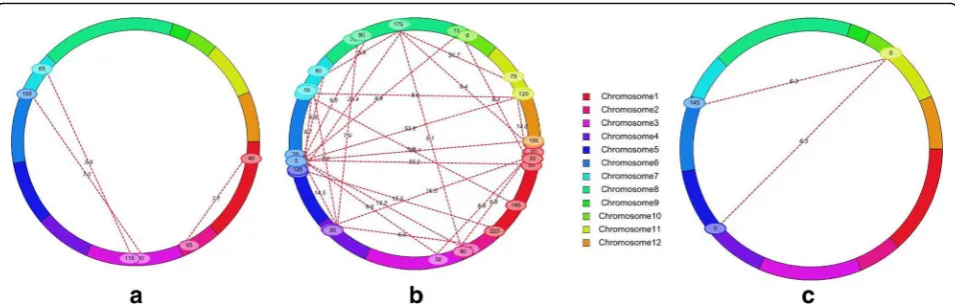
QTL interactions for seedling-stage salinity tolerance
Table 3 Epistasis for traits related to salinity tolerance in an IR29/Hasawi RIL population in two different environments (E2 and E3) C h r 1
Position 1(cM)
for others as indicated by the multiple dotted lines connect-ing the chromosomes.
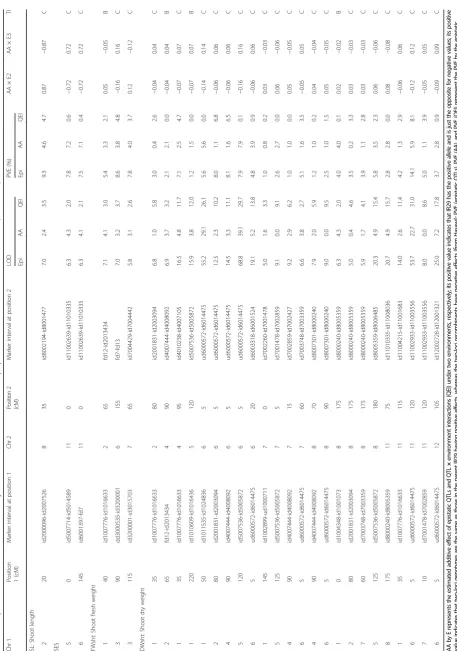
(ii) QTL × environment interactions (QEI)Out of 30 digenic interactions (1 for SL, 2 for SES score, 3 for FWsht, and 24 for DWsht) identified by the combined analysis of the multi-environment phenotypic values under two environmental conditions, 18 significant QEI were identified with LOD of 5.8 to 31.0 and PVE of 0.2% to 8.1% for DWsht (Table 3; Fig. 3). Three QTLs (qSES4.1, qSL1.1,andqDWsht8.1) were identified through combined analysis of both E2 and E3 (Additional file 1: Table S3). Importantly, qSES4.1, qSL1.1, and qDWsht8.1 corre-sponded to main-effect QTLs such as qSES4.1, qSL1.1, andqDWsht8.1,respectively (Table 2).
Identification of tolerant RILs and use in breeding
There were significant differences in SL, RL, FWsht, DWsht, and SES score between the two parents under salinity (Additional file 1: Table S4). Hasawi had higher SL, RL, FWsht, and DWsht than the sensitive IR29. Transgressive segregation was observed for these traits and the heritabilities of SL, RL, FWsht, DWsht, and SES score ranging from 50% to 74% are high (Additional file 1: Table S4), indicating the repeatability/precision of the trials. Thus, four RILs (IR91477–13–1-1-1, IR91477– 64–1-1, IR91477–76–1-1, and IR91477–250–1-1) with high salt tolerance and that had multiple introgression of the related QTLs were selected for evaluation and could be used as potential donors (pre-breeding materials) for further breeding programs (Table 4).
Discussion
Most studies on seedling-stage salinity tolerance have been carried out using common donors such as Pokkali and Nona Bokra. There have been fewer attempts to identify
new donors for salinity tolerance, to identify novel QTLs, and to understand epistatic interaction effects among the QTLs and other loci, and also the effect of environmental interaction on QTL expression for salinity tolerance. In this study, we used Hasawi, a landrace from Saudi Arabia found to have strong adaptability to salinity and drought stress environments (Al-Mssallem et al. 2011; Bizimana et al. 2017). We made crosses using Hasawi, a tolerant donor, and IR29, the recipient parent. IR29 is an internationally recognized salinity-sensitive rice check variety. We devel-oped F5:6RILs and screened them under three diverse
en-vironments across Asia and Africa.
The major findings of this study were five QTL hot-spot (co-localized) regions identified on five different chromosomes for multiple QTLs such as chromosome 1
(qSES1.3, qSES1.4, qSL1.2, qSL1.3, qRL1.1, qRL1.2,
qFWsht1.2, qDWsht1.2), chromosome 4 (qSES4.1,
qFWsht4.1, qFWsht4.2, qDWsht4.1, qDWsht4.2),
chromo-some 6 (qFWsht6.1, qDWsht6.1), chromosome 8
(qFWsht8.1, qDWsht8.1), and chromosome 12 (qSL12.1, qFWsht12.1, qDWsht12.1); five salinity-tolerant RILs iden-tified with multiple QTL introgression and that could be used directly in breeding programs; novel additive robust QTLs on the long arm of chromosome 1 for SES score, SL, RL, FWsht, and DWsht in a similar region; and one QTL (qFWsht6.1) detected in E2 and E3 for FWsht. Thirty-four QTLs identified through ICIM-ADD and IM-ADD mapping are additive because of the use of a permanent mapping population RIL with no or few het-erozygotes; consequently, a dominant effect was absent. SES score is a visual parameter for assessing the tolerance of seedlings under salinity stress. The lower the SES score (1 or 3), the higher the tolerance, whereas a higher SES score (7 or 9) suggests sensitivity. An SES score of 5 indicates moderate tolerance. Significant negative correlations were observed for SES score with
all the other four parameters (SL, RL, FWsht, and DWsht) (Table 1). This is obvious because seedlings can be scored with low SES only if they have attained higher shoot length and high vigor, which means long root length, although higher SES scores could be given to plants with poor vigor and growth. This suggests that all four growth-related parameters directly relate to visually based SES scores. The negative associations observed between SES score and plant growth attributes clearly demonstrate the significance and the detrimental effects of high Na+ accumulation in plant tissue under saline conditions. The most common salt injury symptoms in rice are leaf tip burning, early senescence, and complete necrosis, particularly among sensitive varieties such as IR29. The detrimental effects of salt stress on the growth and yield of rice genotypes are well documented in several earlier reports (Flowers and Yeo 1981, 1995; Gregorio and Senadhira 1993; Ashraf et al. 1999; Ismail et al. 2007; Munns and Tester 2008; Ding et al. 2010; Singh et al. 2010; Bimpong et al. 2016). The mostly positive significant correlations among SL, RL, FWsht, and DWsht suggest that these traits ultimately contribute to seedling-stage salinity tolerance.
This finding is in agreement with earlier findings that wide genetic variation exists for the traits RL and DWsht in rice under saline conditions at the seedling stage (Maiti et al. 2006; Al-Amin et al. 2013; Bimpong et al. 2014). It has also been reported that salinity stress leads to negative root growth and development (Roy et al. 2002; Rodrigues et al. 2002).
Stable genomic regions for salinity tolerance in multi-environments
Genetic linkage maps, based on pair-wise distance esti-mates, have emerged as pivotal tools for locating genes or QTLs. The analysis of recombination events from marker segregation data is especially helpful when a large number of markers segregate in a single mapping population. But, mapping larger numbers of markers also exponentially increases the potential orders of these loci on a chromosome. Hence, advanced and efficient al-gorithms are required to achieve near-perfect ordering of large numbers of loci. REcombination Counting and ORDering (RECORD) (van Os et al. 2005a, 2005b) is a faster, more accurate method for ordering of loci on genetic linkage maps and it performs especially well in regions of maps with high marker density. Therefore, RECORD was used to identify the best marker order in each linkage group and to generate a linkage map of rice. A total of 34 QTL regions were identified for five traits in our study across three environments. Eight QTLs for SES score, SL, RL, FWsht, and DWsht
(qSES1.3, qSES1.4, qSL1.2, qSL1.3, qRL1.1, qRL1.2,
qFWsht1.2,and qDWsht1.2) were identified within 170– 175 cM (Table 2) on the long arm of chromosome 1.
Although they are not at an identical position, it looks like an important region. qSES1.4, which is an additive QTL and has a high LOD value with PVE of 42.3%, is also identified in the same region. The identified QTLs
(qSES1.3, qSES1.4, qSL1.2, qSL1.3, qRL1.1, qRL1.2,
qFWsht1.2, and qDWsht1.2) on chromosome 1 in our
study are located in different regions (170–175 cM) than the earlier reported QTLs on chromosome 1 such as Saltol (10.6–11.5 Mb) andSKC1 (11.46 Mb) (Bonilla et al. 2002; Ren et al. 2005; Kim et al. 2009). It is interesting to note that most of the QTLs controlling seedling-stage salinity tolerance are reported on chromosome 1 in dif-ferent studies and in the current study also we identified QTLs for all the studied traits except DWsht. A large number of QTLs for salinity tolerance have already been reported on the short arm of chromosome 1 (Claes et al. 1990; Flowers et al. 2000; Takehisa et al. 2004; Lin et al. 2004; Ren et al. 2005; Zhang et al. 2008; Sabouri et al. 2009; Ammar et al. 2009; Thomson et al. 2010; Bim-pong et al. 2014).
The novel QTLs identified on chromosome 1 (qSES1.3,
qSES1.4, qSL1.2, qSL1.3, qRL1.1, qRL1.2) from Hasawi
needs further investigation to identify the candidate genes and to understand the molecular mechanisms conferring early seedling-stage salinity tolerance in rice, which could be through similar or different physiological pathways.
The other common QTL detected in two environments
is qFWsht6.1 (E2 and E3), which is co-localized with
qDWsht6.1(E3) (Table 2).qDWsht8.1for DWsht shared a
common genomic region (105 cM) with qFWsht8.1 on
chromosome 8. Indeed, both the traits are very closely asso-ciated. Three QTLs (qSES4.1, qFWsht4.2, andqDWsht4.2) are located in a similar position (32 cM) on chromosome 4 as the cluster at the marker interval of id4008522-id4008092. They may be working as QTL clusters of large QTLs due to co-localization. This region needs to be saturated with more markers for further fine mapping.
It was observed in multi-locus analysis that, if the pooled effects of some major QTLs such as those for SES score on different chromosomes (the pooled PVE
of three SES score QTLs is 88.0%, with qSES1.3,
R2
Importantly, out of a total of 34 QTLs, 9 main-effect QTLs identified for five different traits such as 2 QTLs for SES score (qSES1.3, qSES1.4), 2 for shoot length (qSL1.2, qSL1.3), 2 for root length (qRL1.1, qRL1.2), 1 for shoot fresh weight (qFWsht6.1), and 2 for shoot dry weight (qDWsht1.2, qDWsht6.1) could be focused on for further details and fine mapping for the important traits linked with salt tolerance.
Digenic interaction
Epistasis is a major factor underlying quantitative traits (Caicedo et al. 2004). In our study, potential epistatic interactions between marker loci identified on 10 different chromosomes revealed 49 significant digenic interactions (2 interactions for E1, 31 for E2, and 16 for E3) through single environment analysis for SES score, shoot length, root length, shoot fresh weight, and shoot dry weight, with quite a wide range of PVE. But, we are not elaborating on this as our focus is on QTL interactions with environments; hence, we worked with multi-environment analysis. The ME analysis illustrated 17 marker intervals resulting in 30 two-way interactions (Table 3; Fig. 3); these interactions significantly influenced the traits, suggesting that epistasis is an important component of the genetic basis for complex traits, including tolerance of salt stress. Individually, all the complementary/background markers reported in Table 3 had no significant effect on the trait alone (otherwise, they would have mapped as reliable large-effect QTLs), but resulted in an enhanced effect when combined and interacting with QTLs and other markers. However, only one significant digenic interaction each was identi-fied for SL, two interactions for SES score, and three interactions for FWsht, as several large-effect QTLs were detected for these traits. Some researchers have suggested the presence of significant epistatic interactions among QTL-linked or -unlinked markers (Cocherham and Zeng 1996; Eshed and Zamir 1996; Li et al. 1997; Hossain et al. 2015). So, there is a need to assess the importance of epi-static gene interactions as this complicates the genotype-phenotype relationships; in addition, different computing models used in analyzing epistasis vary and give different results (Malmberg et al. 2005). The interaction effect may enhance or reduce the expected manifestation of overall QTL effect depending upon the degree and direction of the interaction. Type II interactions (between complementary loci) had relatively higher PVE than type I interactions, probably because the trait manifests itself only through interaction between two complementary loci as no main-effect QTL is involved. The influence of epistatic QTL interactions alone explained the trait variation, ranging from 2.1% to 14.1%, which could be crucial when the threshold limits for salinity tolerance of a variety are to be enhanced to withstand environmental stress.
Studies inArabidopsisand rice (Malmberg et al. 2005; Mei et al. 2005; Wang et al. 2011) have suggested that epistatic QTL effects are more important than additive QTL effects for fitness traits, for example, the loss of effect of theSaltolregion in the introgression process to develop near-isogenic lines (NILs) (Thomson et al. 2010). The clean NILs were susceptible to salinity stress com-pared with NILs having interaction between Saltol and other background loci from the donor parent Pokkali. By contrast, studies designed to explicitly model epistatic interactions in other crops such as maize revealed that epistasis is of little or only moderate importance for quantitative traits (Schon et al. 2004; Mihaljevic et al. 2005; Blanc et al. 2006). These contrasting results might be due in part to the relative importance of epi-static effects in predominantly inbreeding or predom-inantly outcrossing species, and in part to differences in modeling procedures.
Several chromosomal regions were associated with more than one trait, indicating linkage or pleiotropic effects. For instance, three QTLs (qSES1.3, qSL1.2, and
qRL1.1) located at 170 cM linked with MI:
id1024972-id1023892 and five other QTLs such asqSES1.4, qSL1.3, qRL1.2, qFWsht1.2,andqDWsht1.2are closely associated with MI: id1023892-id1017885 at 175 cM. One SNP (id1023892) is found to be common in both marker intervals, which looks like a major common SNP in the region located on the long arm of chromosome 1, conferring salt tolerance. It is important to note that the same QTL might contribute to several traits associated with a specific phenotype because of closely associated traits. Hence, epistatic effects and pleiotropy can play a notable role in the interaction and function of a QTL; the presence of a QTL with a very small effect may have a large effect on a regulatory pathway (Koyama et al. 2001). Further characterization of this region by fine mapping and the identification of the genes underlying its tolerance will shed more light on whether the same set of genes or an entirely different set of linked genes governs these phenotypes.
of 12 interactions is non-significant (LOD = 0.0 to 2.9) (Table 3). This suggests that these 12 interactions have less additive effect than QTL × environment interaction ef-fects to express the phenotype. Combined LOD parti-tioned into PVE for additive-effect QTL and QTL × E interactions suggests potential enhancement of stress tolerance by a genotype for a specific environment through the sum of overall manifestation effects of QEI. Thus, QEI has a huge influence on salinity tolerance as the degree of salinity is dependent on environmental factors (temperature, humidity, rainfall), crop season, and crop growth stage. Besides this, the negative AA × E2 value (Table 3) indicates that interaction with Hasawi alleles rather than IR29 alleles may be one of the reasons for making the seedlings more tolerant of salinity stress. The relatively lower contribution of QTL × E interaction through additive components does not eliminate the possibility and importance of dominance or epistatic QTLs or interactions between the QTLs and the environ-ment. E1 was the controlled environment whereas E2 and E3 were uncontrolled natural environments except for rain protection, and this was expected to have more QTL × E interaction, but the experiment infers that there is not a high order of interaction component but enough for affecting and elevating the threshold tolerance limits. Nine additive major QTLs that were identified (seven additive QTLs in the Philippines, one in both Tanzania and Senegal, and one in Senegal) and 30 epistatic QTLs that were identified by joint analyses suggest that epistatic QTLs and QTL × environment interactions are important components for FWsht, DWsht, SES score, and SL. Our investigation revealed a significant combined effect of epistatic interaction and QTL × E interaction with high PVE, but, on further dissection, we found more epistatic interaction than QTL × E interaction probably because of the higher heritable trait (Additional file 1: Table S2; Tables 3 and 4). Thus, major QTL effects, QEI, and epistatic interactions need to be considered together to improve selection efficiency using genomic-assisted breeding (Zhao et al. 2010; Liu et al. 2014).
Comparison of the new QTL loci with previously mapped QTLs
Results of comparative analysis of the QTL positions identified in the study compared with the QTL positions identified in earlier studies as being associated with salinity tolerance at various growth stages are shown. Rice cultivars grown in saline environments are most sensitive at both the vegetative and reproductive stages. However, the relationship between tolerances at the two stages is poor, suggesting that they are regulated by different processes and genes (Singh and Flowers 2010; Hossain et al. 2015; Rahman et al. 2016; Ahmadizadeh et al. 2016). The major QTL Saltol,derived from salt-tolerant land-race Pokkali, has been mapped on chromosome 1. This QTL confers salt tolerance at the vegetative stage and explains between 39.2% and 43.9% of the PVE in the original RIL population (Bonilla et al. 2002), but further studies found that Saltolalone does not work as a robust QTL (Thomson et al. 2010). A gene for salt tolerance at the vegetative stage, SKC1, has been identified in the same region from Nona Bokra and positionally cloned (Ren et al. 2005).SKC1maintains K+homoeostasis in the salt-tolerant cultivar under salt stress, and the gene encodes a member of HKT-type transporters. This gene turns out to be a protein in the HKT family that exclusively mediates K+ and Na+ translocation between roots and shoots, thereby regulating K+/Na+homeostasis in the shoots, resulting in improved salt tolerance (Ren et al. 2005). The eight novel QTLs (qSES1.3, qSES1.4, qSL1.2, qSL1.3, qRL1.1, qRL1.2, qFWsht1.2, and qDWsht1.2) responsible for seedling-stage salinity tolerance on the long arm of chromosome 1 as reported in our study were found to be very different from SKC1 and Saltol. These eight novel QTLs span a region of 170 to 175 cM. There is a need to further test the stability of the identified QTLs being expressed before drawing a conclusion.
Koyama et al. (2001) identified 10 QTLs for five shoot traits related to salt tolerance: Na+ concentration (one QTL) at 74 cM on chromosome 1; K+concentration (three QTLs) on chromosomes 4, 6, and 9; Na+ concentration
Table 4Phenotypic values of traits for salt tolerance among selected RILs and parents common in Senegal and Tanzania with their related QTLs
Selected RILs SL (cm) RL (cm) FWsht (g) DWsht (g) SES score QTLs
IR91477–13–1-1-1 42.5 16.7 0.98 0.24 3.0 qSES1.4, qSES4.1, qSL1.3
IR91477–16–1-1-1 43.5 20.9 1.07 0.25 4.3 qSES1.4, qSL1.3, qFWsht6.1
IR91477–64–1-1 35.8 20.8 1.18 0.26 4.0 qSES1.4, qSL1.3, qRL1.1, qFWsht6.1
IR91477–76–1-1 36.4 22.2 0.79 0.20 4.3 qSES1.4, qSES4.1, qDWsht6.1, qFWsht4.2
IR91477–250–1-1 37.3 17.5 1.02 0.27 3.5 qSES1.4, qSL1.3, qFWsht4.2, qFWsht6.1
IR29 (sensitive check) 20.5 11.3 0.61 0.13 8.0
Hasawi (tolerant check) 40.0 22.9 1.30 0.28 3.0
(two QTLs) on chromosomes 4 and 6; K+ concentration (two QTLs) on chromosomes 1 (at 56 cM) and 4; and Na+-K+ratio in shoots (two QTLs) on chromosomes 1 (at 74 cM) and 4. In our study, eight QTLs were identified for SES score and shoot and root traits and are located on chromosome 1 but in a different position (~175.0 cM) on the long arm versus the short arm of the chromosomes in the previous studies. Lin et al. (2004) detected five QTLs for four traits associated with salt tolerance in roots and three QTLs for three shoot traits associated with salt tolerance, but none of these QTLs have the same map locations as any of the QTLs identified here across environments, suggesting that most of these QTLs are novel and could be important for breeding. Wang et al. (2012) reported five additive QTLs, for Na+in shoots (qSNC9), K+ in shoots (qSKC1 andqSKC9), K+ in roots (qRKC4), and for salt tolerance rating (qSTR7), as new salt tolerance loci. However, qSES4.1, qFWsht4.1,
qFWsht4.2, qDWsht1.1, qDWsht1.2, andqDWsht7.1in E1
were identified that shared similar chromosomal positions in our study.
The QTLs that co-localize in a similar region (such as id1023892 marker) probably indicate some functional relatedness among them. This major QTL cluster might also have pleiotropic effects on other traits. The cluster of QTLs on chromosome 1 for different traits, such as SES score, SL, and RL (Fig. 1), was also supported by the strong correlations observed among these traits (Table 1). This clustering of loci and correlation of effects can be attrib-uted to different linked QTLs occurring on the same segment or pleiotropic effects of a single QTL. High-resolution mapping is required to determine whether pleiotropic effects are present.
The QTLs identified in this study that overlap with others mapped previously fall into two categories: (i) QTLs that share a similar map position and are mapped to the same trait, and (ii) QTLs that share a similar map position but are mapped to a different trait. However, we found a tight cluster of QTLs localizing around 170–175.0 cM on chromosome 1, and three QTLs (qSES4.1, qFWsht4.2,and
qDWsht4.2) on chromosome 4 at 32.0 cM and two QTLs
(qFWsht6.1, qDWsht6.1) on chromosome 6 at 115.0 cM,
which may be considered as novel loci. Several studies have indicated that many genomic loci controlling important rice traits are clustered in the same chromosome regions (Cai and Morishima 2002; Angaji 2008; Hossain et al. 2015). These major loci should be targeted for pyramiding through MABC (Singh et al. 2007; Thomson et al. 2010). Many QTLs for SES score, shoot length, root length, shoot fresh weight, and shoot dry weight were identified. The ones accounting for higher LOD and PVE could subsequently be used for QTL pyramiding after the development of low-cost diagnostic molecular markers linked to them.
Responses of the RILs and their parental lines to salt stress The most crucial step of QTL mapping for salt tolerance in rice is the evaluation of salt tolerance (Wang et al. 2011). We selected five salt-tolerant RILs based on visual phenotypic score (SES score) that are commonly tolerant in two environments (Senegal and Tanzania). Salinity has large effects on crop growth, yield, and productivity (Tester and Davenport 2003; Munns and Tester 2008; Munns and Gilliham 2015). Initial vigor that directly relates to higher shoot and root length and fresh and dry weight of shoots through faster growth at early seedling stage could reduce the Na+concentration in plant tissues probably because of a dilution effect besides other salt-tolerance mechanisms operating in plants.
Conclusions
Salinity tolerance is a complex quantitative trait and previous studies established its strong association with visual symptoms (as indicated by the SES score) and other traits such as shoot length, root length, shoot fresh weight, and shoot dry weight. Overall phenotypic performance reflected by SES scores is determined by these key traits. We identified genomic regions on chromosomes 1, 2, 3, 4, 5, 6, 7, 8, 11, and 12 that are associated with salinity tolerance at the seedling stage by affecting SES scores, shoot length, root length, shoot fresh weight, and shoot dry weight. Thirty-four QTLs for the five traits were detected on 10 chromosomes. The QTLs (qSES1.3, qSES1.4, qSL1.2, qSL1.3, qRL1, qRL1.2,
qFWsht1.2, and qDWsht1.2) detected on chromosome 1
could be of much interest and termed as novel QTLs as, unlike earlier reportedSaltolandSKC1, they are on the long arm of chromosome 1. The study also detected 30 digenic two-way interactions through ME analysis that are quite important for gene expression, especially for complex traits such as salinity tolerance. Significant QTL × environment interaction for FWsht, DWsht, SES score, and SL indicated as high as a 8.1% contribution for phenotypic manifestation through interaction between QTLs and background loci, or complementary loci. The robust QTLs, digenic interactions, and QEI could be good targets for more detailed QTL studies, fine mapping, and subsequent pyramiding to develop highly tolerant varieties that could lead to the development of improved rice varieties for salt-affected areas where salt stress is a major impediment to rice production.
Additional files
Abbreviations
DWsht:Dry weight of shoot; FWsht: Fresh weight of shoot; PVE: Phenotypic variance explained; QTLs: Quantitative trait loci; RL: Root length;
SDM: Segregation distortion markers; SES score: Standard evaluation system (SES) score; SL: Shoot length
Acknowledgments
We thank the Genotyping Services Laboratory for technical assistance for genotyping. This work was funded in part by the Global Rice Science Partnership (GRiSP), Japan Rice Breeding Project (JRBP), and Bill & Melinda Gates Foundation (BMGF).
Authors’contributions
RKS, MAR, and BPMS conceived and designed the research. IKB, JPB, and EDP carried out the phenotyping experiment in Senegal, Tanzania, and the Philippines, respectively. MAR, JPB, MA, and EDP processed the genotyping data. MAR and MSR analyzed the data. MAR, IKB, BPMS, and RKS wrote the paper. All authors read and approved the final manuscript.
Competing interests
The authors declare that they have no competing interests.
Publisher’s Note
Springer Nature remains neutral with regard to jurisdictional claims in published maps and institutional affiliations.
Author details
1International Rice Research Institute (IRRI), DAPO Box 7777, Metro Manila,
Philippines.2Bangladesh Rice Research Institute, Gazipur 1701, Bangladesh. 3Africa Rice Center, Sahel Regional Station, BP 96 St Louis, Senegal.4IRRI-ESA
Office, Bujumbura, Burundi.5Institute of Biological Sciences, University of the Philippines at Los Baños, Laguna, Philippines.
Received: 24 February 2017 Accepted: 23 October 2017
References
Ahmadizadeh M, Vispo NA, Calapit-Palao CDO, Pangaan I, Dela Viña C, Singh RK (2016) Reproductive stage salinity tolerance in rice: a complex trait to phenotype. IJPP–Springer. https://doi.org/10.1007/s40502-016-0268-6 Al-Amin M, Islam MM, Begum SN, Alam MS, Moniruzzaman M, Patwary MAK
(2013) Evaluation of rice germplasm under salt stress at the seedling stage through SSR markers. Int J Agric Res Innov Technol 3(1):52–59
Al-Mssallem MQ, Hampton SM, Frost GS, Brown JE (2011) A study of Hasawi rice (Oryza sativaL.) in terms of its carbohydrate hydrolysis (in vitro) and glycaemic and insulinaemic indices (in vivo). Eur J Clin Nutr 65:627–634 Ammar MHM, Pandit A, Singh RK, Sameena S, Chauhan MS et al (2009) Mapping
of QTLs controlling Na+, K+and Cl−ion concentrations in salt tolerantindica
rice variety CSR27. J Plant Biochem Biotechnol 18:139–150
Angaji SA (2008) Mapping QTLs for submergence tolerance during germination in rice. Afr J Biotechnol 7(15):2551–2558
Ashraf A, Khalid A, Ali K (1999) Effect of seedling age and density on growth and yield of rice in saline soil. Pak J Biol Sci 2(3):860–862
Bimpong IK, Manneh B, Diop B, Ghislain K, Sow A, Amoah NKA, Gregorio G, Singh RK, Ortiz R, Wopereis M (2014) New quantitative trait loci for enhancing adaptation to salinity in rice from Hasawi, a Saudi landrace, into three African cultivars at the reproductive stage. Euphytica 200:45–60 Bimpong IK, Manneh B, Sock M, Diaw F, Amoah NKA, Ismail AM, Gregorio GB, Singh
RK, Wopereis M (2016) Improving salt tolerance of lowland rice cultivar‘Rassi’ through marker-aided backcross breeding in West Africa. Plant Sci 242:288–299 Bizimana JB, Luzi-kihupi A, Murori RW, Singh RK (2017) Identification of
quantitative trait loci for salinity tolerance in rice (Oryza sativaL.) using IR29/ Hasawi mapping population. J Genet 96(4):571–582. https://doi.org/10.1007/ s12041-017-0803-x
Blanc G, Charcosset A, Mangin B, Gallais A, Moreau L (2006) Connected populations for detecting quantitative trait loci and testing for epistasis: an application in maize. Theor Appl Genet 113:206–224
Bonilla PS, Dvorak J, Mackill D, Deal K, Gregorio G (2002) RFLP and SSLP mapping of salinity tolerance genes in chromosome 1 of rice (Oryza sativaL.) using recombinant inbred lines. Philipp Agric Sci 85(1):64–74
Cai HW, Morishima H (2002) QTL clusters reflect character associations in wild and cultivated rice. Theor Appl Genet 104:1217–1228
Caicedo AL, Stinchcombe JR, Olsen KM, Schmitt J, Purugganan MD (2004) Epistatic interaction betweenArabidopsisFRI and FLC flowering time genes generates a latitudinal cline in a life history trait. Proc Natl Acad Sci U S A 101:15670–15675 Churchill GA, Doerge RW (1994) Empirical threshold values for quantitative trait
mapping. Genetics 138:963–971
Claes B, Dekeyser R, Villarroel R, den Bulcke MV, Bauw G, Montagu MV, Caplan A (1990) Characterization of a rice gene showing organ-specific expression in response to salt stress and drought. Plant Cell 2:19–27
Cocherham CC, Zeng ZB (1996) Design III with marker loci. Genetics 143:1437–1456 Ding M, Hou P, Shen X, Wang M, Deng S, Sun J et al (2010) Salt-induced
expression of genes related to Na+/K+and ROS homeostasis in leaves of salt-resistant and salt-sensitive poplar species. Plant Mol Biol 73:251–269 Eshed Y, Zamir D (1996) Less-than-additive epistatic interactions of quantitative
trait loci in tomato. Genetics 143:1807–1817
Fan JB, Oliphant A, Shen R et al (2003) Highly parallel SNP genotyping. Cold Spring Harb Symp Quant Biol 68:69–78
Flowers TJ (2004) Improving crop salt tolerance. J Exp Bot 55(396):307–319 Flowers TJ, Koyama ML, Flowers SA, Sudhakar C, Singh KP, Yeo AR (2000) QTL: their
place in engineering salt tolerance of rice to salinity. J Exp Bot 51:99–106 Flowers TJ, Yeo AR (1981) Variability in the resistance of sodium chloride salinity
within rice (Oryza sativaL.) varieties. New Phytol 88:363–373
Flowers TJ, Yeo AR (1995) Breeding for salinity resistance in crop plants. Where next? Aust J Plant Physiol 22:875–884
Gregorio GB, Senadhira D (1993) Genetics analysis of salinity tolerance in rice. Theor Appl Genet 86:333–338
Gregorio GB, Senadhira D, Mendoza RD (1997) Screening rice for salinity tolerance. In: IRRI discussion paper series N°. 22, IRRI, Metro Manila. pp 3–19
Hackett CA, Broadfoot LB (2003) Effects of genotyping errors, missing values and segregation distortion in molecular marker data on the construction of linkage maps. Heredity 90:33–38. https://doi.org/10.1038/sj.hdy.6800173 Hossain H, Rahman MA, Alam MS, Singh RK (2015) Mapping of quantitative trait
loci associated with reproductive-stage salt tolerance in rice. J Agro Crop Sci 201:17–31. https://doi.org/10.1111/jac.12086
Illumina (2008) GoldenGate genotyping assay for VeraCode manual protocol. In: Catalog # VC-901–1001, part # 11275211 rev. a
IRRI (2007) Standard evaluation system for rice (SES), 4th edn. International Rice Research Institute, Los Baños (Philippines), p 52
Ismail AM, Heuer S, Thomson MJ, Wissuwa M (2007) Genetic and genomic approaches to develop rice germplasm for problem soils. Plant Mol Biol 65:547–570 Jain S, Marshall D (1967) (1967) Population studies in predominantly self-pollinating
species. X. Variation in natural populations ofAvena fatuaandA. barbata. Am Nat 101:19–33
Kader MA, Seidel T, Golldack D, Lindberg S (2006) Expressions of OsHKT1, OsHKT2, and OsVHA are differentially regulated under NaCl stress in salt-sensitive and salt-tolerant rice (Oryza sativaL.) cultivars. J Exp Bot 57:4257–4268 Khan S, Javed MA, Jahan N, Manan FA (2016) A short review on the
development of salt tolerant cultivars in rice. Int J Public Health Sci (IJPHS) 5(2):201–212
Kim S-H, Bhat PR, Cui X, Walia H, Xu J, Wanamaker S et al (2009) Detection and validation of single feature polymorphisms using RNA expression data from a rice genome array. BMC Plant Biol 9:65. https://doi.org/10.1186/1471-2229-9-65 Koyama ML, Levesley A, Koebner RMD, Flowers TJ, Yeo AR (2001) Quantitative
trait loci for component physiological traits determining salt tolerance in rice. Plant Physiol 125:406–422
Kumari S, Panjabinee Sabharwal V, Kushwaha HR, Sopory SK, Singla-Pareek SL, Pareek A (2009) Transcriptome map for seedling stage specific salinity stress response indicates a specific set of genes as candidate for saline tolerance in
Oryza sativaL. Funct Integr Genomics 9:109–123
Lander ES, Botstein D (1989) Mapping Mendelian factors underlying quantitative traits using RFLP linkage maps. Genetics 121:185–199
Li ZK, Pinson SRM, Park WD, Paterson AH, Stansel JW (1997) Epistasis for three grain-yield components in rice (Oryza sativaL.) Genetics 145:453–465 Lin HX, Zhu MZ, Yano M, Gao JP, Liang ZW, Su WA, Hu XU, Ren ZH, Chao DY
(2004) QTLs for Na+and K+uptake of the shoots and roots controlling rice salt tolerance. Theor Appl Genet 108:253–260
Liu D, Ma C, Hong W, Huang L, Liu M et al (2014) Construction and analysis of high-density linkage map using high-throughput sequencing data. PLoS One 9(6):e98855. https://doi.org/10.1371/journal.pone.0098855
Liu Y, Chen L, Fu D, Lou Q, Mei H, Xiong L, Li M, Xu X, Mei X, Luo L (2014) Dissection of additive, epistatic effect and QTL × environment interaction of quantitative trait loci for sheath blight resistance in rice. Hereditas 151:28–37 Liu Y, Li C, Shi X, Feng H, Wang Y (2016) Identification of QTLs with additive,
epistatic, and QTL × environment interaction effects for the bolting trait in
Brassica rapaL. Euphytica 210:427–439
Maiti RK, Vidyasagar P, Banerjee PP (2006) Salinity tolerance in rice (Oryza sativaL.) hybrids and their parents at emergence and seedling stage. Crop Res Hisar 31(3):427–433
Malmberg RL, Held S, Waits A, Mauricio R (2005) Epistasis for fitness related quantitative traits inArabidopsis thalianagrown in the field and in the greenhouse. Genetics 171:2013–2027
McCouch SR, CGSNL (Committee on Gene Symbolization, Nomenclature and Linkage, Rice Genetics Cooperative) (2008) Gene nomenclature system for rice. Rice 1:72–84
McCouch SR, Cho YG, Yano M et al (1997) Report on QTL nomenclature. Rice Genet Newsl 14:11
Mei HW, Li ZK, Shu QY, Guo LB, Wang YP, Yu XQ et al (2005) Gene actions of QTLs affecting several agronomic traits resolved in a recombinant inbred rice population and two backcross populations. Theor Appl Genet 110:649–659 Mihaljevic R, Utz HF, Melchinger AE (2005) No evidence for epistasis in hybrid
andper seperformance of elite European flint maize inbreds from generation means and QTL analyses. Crop Sci 45:2605–2613
Munns R (2005) Genes and salt tolerance: bringing them together. New Phytol 167:645–663
Munns R, Gilliham M (2015) Salinity tolerance of crops–what is the cost? New Phytol 208:668–673. https://doi.org/10.1111/nph.13519
Munns R, Tester M (2008) Mechanisms of salinity tolerance. Annu Rev Plant Biol 59:651–681
Murray MG, Thompson WF (1980) Rapid isolation of high molecular weight plant DNA. Nucl Acids Res 8:4321–4325
Negrao S, Oliveira MM, Jena KK, Mackill D (2008) Integration of genomic tools to assist breeding in thejaponicasubspecies of rice. Mol Breed 22:159–168 Passioura J, Spielmeyer W, Bonnett DG (2007) Requirements for success in
Marker-Assisted breeding for Drought-Prone Environments. In: Jenks MA, Hasegawa PM, Jain SM. (eds) Advances in Molecular-Breeding Toward Drought and Salt Tolerant Crops. Springer, Dordrecht. doi:https://doi.org/10. 1007/978-1-4020-5578-2_19
Qados AMSA (2011) Effect of salt stress on plant growth and metabolism of bean plantVicia faba(L.) J Saudi Soc Agric Sci 10:7–15
Rahman MA, Thomson MJ, Alam MS, De Ocampo M, Egdane J, Ismail AM (2016) Exploring novel genetic sources of salinity tolerance in rice through molecular and physiological characterization. Ann Bot 117:1083–1097. https://doi.org/10.1093/aob/mcw030
Ren ZH, Gao JP, Li LG, Cai XL, Huang W, Chao DY, Zhu MZ, Wang ZY, Luan S, Lin HX (2005) A rice quantitative trait locus for salt tolerance encodes a sodium transporter. Nat Genet 37:1141–1146
Rodrigues LN, Fernandes PD, Gheyi HR, Viana SBA (2002) Germination and formation of rice seedlings under saline stress. Esc Agrot Fed Castanhal 6(3):397–403 Roy SJ, Negrao S, Tester M (2014) Salt resistant crop plants. Curr Opin Biotechnol
26:115–124
Roy SK, Patra SK, Sarkar KK (2002) Studies on the effect of salinity stress on rice (Oryza sativaL.) at seedling stage. J Interacademicia 6(3):254–259 Sabouri H, Reizai AM, Mouomeni A, Kavoussi M, Sabouri A (2009) QTL mapping
of physiological traits related to salt tolerance in young rice seedlings. Biol Plant 53:657–662
Schon CC, Utz HF, Groh S, Truberg B, Openshaw S, Melchinger AE (2004) Quantitative trait locus mapping based on resampling in a vast maize testcross experiment and its relevance to quantitative genetics for complex traits. Genetics 167:485–498 Singh RK, Flowers TJ (2010) The physiology and molecular biology of the effects
of salinity on rice. In: Pessarakli M (ed) Third edition of "handbook of plant and crop stress". Taylor and Francis, Florida, USA, pp 899–939
Singh RK, Gregorio GB, Jain RK (2007) QTL mapping for salinity tolerance. Physiol Mol Biol Plants 13:87–99
Singh RK, Redoña E, Refuerzo L (2010) Varietal improvement for abiotic stress tolerance in crop plants: special reference to salinity in rice. In: Pareek A, Sopory SK, Bohnert HJ, Govindjee N (eds) Abiotic stress adaptation in plants:
physiological, molecular and genomic foundation. Springer, Dordrecht, Netherlands, pp 387–415
Takehisa H, Shimodate T, Fukuta Y, Ueda T, Yano M, Yamaya T, Kameya T, Sato T (2004) Identification of quantitative trait loci for plant growth of rice in paddy field flooded with salt water. Field Crops Res 89:85–95
Tester M, Davenport R (2003) Na+tolerance and Na+transport in higher plants.
Ann Bot 91:503–527
Thomson MJ (2014) High-throughput SNP genotyping to accelerate crop improvement. Plant Breed Biotechnol 2:195–212
Thomson MJ, de Ocampo M, Egdane J, Rahman MA, Sajise AG, Adorada DL, et al. (2010) Characterizing theSaltolquantitative trait locus for salinity tolerance in rice. Rice 3:148–160
Thomson MJ, Zhao K, Wright M et al (2012) High-throughput single nucleotide polymorphism genotyping for breeding applications in rice using the BeadXpress platform. Mol Breed 29:875–886
Tuberosa R, Salvi S (2006) Genomics approaches to improve drought tolerance in crops. Trends Plant Sci 11:412–415
van Os H, Stam P, Visser RG, Van Eck HJ (2005a) RECORD: a novel method for ordering loci on a genetic linkage map. Theor Appl Genet 112(1):30–40 van Os H, Stam P, Visser RG, van Eck HJ (2005b) SMOOTH: a statistical method for
successful removal of genotyping errors from high-density genetic linkage data. Theor Appl Genet 112:187–194
Walia H, Wilson C, Condamine P, Liu X, Ismail AM, Zeng L et al (2005) Comparative transcriptional profiling of two contrasting rice genotypes under salinity stress during the vegetative growth stage. Plant Physiol 139: 822–835
Wang J, Li H, Zhang L, Meng L (2014) Users’manual of QTL IciMapping. The Quantitative Genetics Group, Institute of Crop Science, Chinese Academy of Agricultural Sciences (CAAS), Beijing 100081, China, and Genetic Resources Program, International Maize and Wheat Improvement Center (CIMMYT), Apdo. Postal 6–641, 06600 Mexico, D.F., Mexico
Wang X, Pang Y, Zhang J, Zhang Q, Tao Y, Feng B, Zheng T, Xu J, Li Z (2014) Genetic background effects on QTL and QTL × environment interaction for yield and its component traits as revealed by reciprocal introgression lines in rice. Crop J 2:345–357
Wang ZF, Wang JF, Bao YM, Wu YY, Zhang HS (2011) Quantitative trait loci controlling rice seed germination under salt stress. Euphytica 178:297–307 Wang Z, Chen Z, Cheng J, Lai Y, Wang J, et al. (2012) QTL analysis of Na+ and K+
concentrations in roots and shoots under different levels of NaCl stress in rice (Oryza sativa L.). PLoS ONE 7(12):e51202. doi:10.1371/journal.pone. 0051202.
Wright MH, Tung CW, Zhao K, Reynolds A, McCouch SR, Bustamante CD (2010) ALCHEMY: a reliable method for automated SNP genotype calling for small batch sizes and highly homozygous populations. Bioinformatics 26:2952– 2960
Wu Y, Hu Y, Xu G (2009) Interactive effects of potassium and sodium on root growth and expression of K/Na transporter genes in rice. Plant Growth Regul 57:271–280
Wurschum T, Maurer HP, Dreyer F, Reif JC (2013) Effect of inter- and intragenic epistasis on the heritability of oil content in rapeseed (Brassica napusL.) Theor Appl Genet 126(2):435–441
Xu S (2008) Quantitative trait locus mapping can benefit from segregation distortion. Genetics 180:2201–2208
Zeigler R, Barclay A (2008) The relevance of rice. Rice 1:3–10. https://doi.org/10. 1007/s12284-008-9001-z
Zhang L, Li H, Li Z, Wang J (2008) Interactions between markers can be caused by the dominance effect of quantitative trait loci. Genetics 180:1177–1190 Zhang L, Wang S, Li H, Deng Q, Zheng A, Li S, Li P, Li Z, Wang J (2010) Effects of
missing marker and segregation distortion on QTL mapping in F2 populations. Theor Appl Genet (2010) 121:1071–1082. https://doi.org/10. 1007/s00122-010-1372-z