R E V I E W
Open Access
Soft computing-based colour quantisation
Gerald Schaefer
Abstract
Soft computing techniques have shown much potential in a variety of computer vision and image analysis tasks. In this paper, an overview of recent soft computing approaches to the colour quantisation problem is presented. Colour quantisation is a common image processing technique to reduce the number of distinct colours in an image. Those selected colours form a colour palette, while the resulting image quality is directly determined by the choice of colours in the palette. The use of generic optimisation techniques such as simulated annealing and soft computing-based clustering algorithms founded on fuzzy and rough set ideas to formulate colour quantisation algorithms is discussed. These methods are capable of deriving good colour palettes and are shown to outperform standard colour quantisation techniques in terms of image quality. Furthermore, a hybrid colour quantisation algorithm which combines a generic optimisation approach with a common clustering algorithm is shown to lead to improved image quality. Finally, it is demonstrated how optimisation-based colour quantisation can be employed in conjunction with a more appropriate measure for image quality.
Keywords: Colour quantisation; Colour palette; Soft computing; Clustering; Optimisation; Image quality
1 Introduction
Colour quantisation is a common image processing tech-nique that allows the representation of true colour images using only a small number of colours. True colour images typically use 24 bits per pixel resulting overall in 224, i.e. more than 16 million, different colours. Colour quanti-sation uses a colour palette that contains only a small number of distinct colours (usually between 8 and 256), and pixel data are then stored as indices to this palette. Since each pixel in the image now takes on one of the colours of the palette, the choice of the colours that make up the palette is of crucial importance for the quality of the quantised image.
A common way of expressing this quality is to cal-culate the difference between the original (unquantised) imageOand its colour-quantised counterpartQfor which the mean-squared error (MSE) is the most widely used measure:
MSE(O,Q)= 1 3nm
n
i=1 m
j=1
((RO(i,j)−RQ(i,j))2
+(GO(i,j)−GQ(i,j))2+(BO(i,j)−BQ(i,j))2), (1)
Correspondence: [email protected]
Department of Computer Science, Loughborough University, Loughborough, UK
whereR(i,j), G(i,j), and B(i,j) are the red, green, and blue pixel values at location (i,j), and n and m are the dimensions of images.
However, the selection of the optimal colour palette is known to be an NP-complete problem [1]. In the image processing literature, many different algorithms have been introduced that aim to find a palette that allows for good image quality of the quantised image. A relatively simple approach is the popularity algorithm [2], which -typically following a uniform quantisation to 5 bits per channel - selects theNcolours that are represented most often to form the colour palette. In median cut quantisa-tion [2], an iterative procedure repeatedly splits (by a plane through the median point) colour cells into sub-cells. In octree quantisation [3], the colour space is represented as an octree where sub-branches are successively merged to form the palette, while Neuquant [4] employs a one-dimensional self-organising Kohonen neural network to generate the colour map.
In this paper, we present several soft computing approaches to colour quantisation. In particular, in Section 2.1, we show how general purpose optimisation algorithms such as simulated annealing can be used to derive a good colour palette. Colour quantisation can also be regarded as a clustering problem. Consequently, in Section 2.2, several soft computing-based clustering algorithms, namely fuzzy based clustering, rough set
based clustering and a combined fuzzy-rough clustering approach, and their application to the colour quantisation problem, are discussed. In Section 2.3, we present exper-imental results that confirm that these soft computing-based methods do indeed make effective approaches for colour quantisation, outperforming several standard algorithms. A hybrid optimisation scheme for colour quantisation is described in Section 2.4 and shown to lead to improved performance. In Section 2.5, we show that by adapting the objective function, optimisation-based colour quantisation can be formulated, employing a more appropriate image quality metric. Finally, Section 3 concludes the paper.
2 Review
2.1 Soft computing-based optimisation for colour quantisation
The main advantage of black-box optimisation algorithms is that they do not require any domain-specific knowl-edge yet are able to provide a near-optimal solution. This makes them suitable for a variety of problems, and in the following, we show how they can be employed to lead to an effective colour quantisation algorithm.
While there are many different optimisation algorithms (e.g. in [5], genetic algorithms were used for colour quan-tisation, while in [6], particle swarm optimisation [7] was utilised), the approach in [8] employs a modification of the well-known simulated annealing algorithm. Simulated annealing (SA) was first introduced as a general optimi-sation method by Kirkpatrick et al. [9], and it simulates the annealing of metal, in which the metal is heated up to a temperature near its melting point and then slowly cooled down. This allows the particles to move towards a minimum energy state, with a more uniform crystalline structure. The process therefore permits some control over the microstructure.
Simulated annealing is a variation of the hill-climbing algorithm. Both start from a randomly selected point within the search space of all possible solutions. Each point in search space has a measurable error value,E, asso-ciated with it, which indicates the quality of the solution. From the current point in search space, new trial solutions are selected for testing from the neighborhood of the cur-rent solution. This is usually done by moving a small step in a random direction. Typically, small and equally dis-tributed random numbers from the interval [−smax,smax] are added to each component of the current solution vec-tor, wheresmax is called the maximum step width and is chosen from the interval between 0 and the upper limit of the search space dimension.
If the decrease in error values, denoted asE, is neg-ative (i.e. the error of a trial solution is below that of the current one), then the trial solution is accepted as the current solution. However unlike hill-climbing, SA does
not automatically reject a new candidate solution if E is positive. Instead, it becomes the current solution with probabilityp(T)which is usually determined using
p(T)=e−E/T, (2)
whereTis referred to as ‘temperature’, an abstract control parameter for the cooling schedule. For a given temper-ature and positive values ofE, the probability function shown in Equation 2 has a defined upper limit of 1 and tends towards 0 for large positive values ofE.
The algorithm starts with a high temperature, i.e. with a high transition probability. The temperature is then reduced towards 0, usually in steps, according to a cooling schedule such as
Tn+1=αTn, (3)
whereTnis the temperature at stepnandαis a cooling coefficient (usually between 0.8 and 0.99).
During each step, the temperature must be held con-stant for an appropriate number of iterations in order to allow the algorithm to settle into a ‘thermal equilibrium’, i.e. a balanced state. If the number of iterations is too small, the algorithm is likely to converge to a local mini-mum.
For both continuous parameter optimisation and dis-crete parameters with large search ranges, it is practically impossible to choose direct neighbours of the current solution as new candidate solutions due to the vast num-ber of points in the search space. Therefore, it is necessary to choose new candidates at some distance in a ran-dom direction of the current solution in order to navigate through the search space in an acceptable time. This dis-tance could either be a fixed step widthsor it could have an upper limit,smax. The maximum step widthsmaxis cru-cial to the success of SA. Ifsmaxis too small and the start point for a search run is too far away from the global opti-mum, the algorithm might not be able to get near that optimum. If, on the other hand, the step width is too large and the peak of the optimum very narrow, the algorithm might never reach the top because most of the steps are too large.
Step width adapting simulated annealing (SWASA) [10] overcomes the problems associated with constant values forsmax using a scaling function to adapt the maximum step width to the current iteration by
smax(n)=
2s0
1+eβn/nmax, (4)
wheresmax(n)is the maximum step width at iterationn, s0is the initial maximum step width,nmaxthe maximum number of iterations, andβis an adaptation constant.
imageI, a codebook ofkcolour vectors, should then be chosen so as to minimise the error function
E(C,I)= k1 j=1lj
k
i=1 li
j=1
||Ci−Ij|| +p(C,I), (5)
with
p(C,I)= k
i=1
δai, ai=
1 ifli=0
0 otherwise , (6)
whereliis the number of pixelsIjrepresented by colourCi of the palette,||.||is the Euclidean distance in RGB (red-green-blue) space, andδis a constant (set toδ=10 in [8]). The objective functionE(C,I)used is hence a combina-tion of the mean Euclidean distance, i.e. the error measure of Equation 1, and a penalty function. The purpose of the penalty functionp(C,I)is to avoid unused palette colours by adding a constant penalty value to the error for each entry in the codebook that is not used in the resulting picture.
2.2 Soft computing-based clustering for colour quantisation
Colour quantisation can also be seen as a clustering problem where the task is to identify those clusters that best represent the colours in an image. Consequently, soft computing-based clustering algorithms can be read-ily adapted to derive a good colour palette. In the fol-lowing, we discuss how fuzzy c-means, rough c-means, and a combined fuzzy-rough clustering algorithm can be employed for colour quantisation.
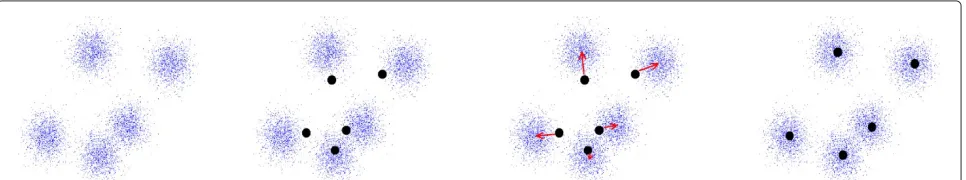
2.2.1 Fuzzy c-means
Fuzzy c-means (FCM) is based on the idea of finding cluster centres by iteratively adjusting their positions and evaluation of an objective function as in (hard) c-means, yet allows more flexibility by introducing the possibil-ity of partial memberships to clusters. The general FCM algorithm is illustrated in Figure 1.
For colour quantisation, the error function follows the form
E= C
j=1 N
i=1
μkij||xi−cj||2, (7)
where μkij is the fuzzy membership of pixel xi and the colour cluster identified by its centrecj, andkis a constant that defines the fuzziness of the resulting partitions.
E can reach the global minimum when pixels nearby the centroid of corresponding clusters are assigned higher membership values, while lower membership values are assigned to pixels far from the centroid [11]. Here, the membership is proportional to the probability that a pixel belongs to a specific cluster where the probability is only dependent on the distance between the image pixel and each independent cluster centre. The membership func-tions and the cluster centres are updated by
μij=
1 C
m=1
||xj−ci|| ||xj−cm||)2/(k−1)
, (8)
and
ci= N
j=1μkijxj N
j=1μkij
. (9)
Fuzzy c-means operates iteratively though the following steps [12]:
Step 1. Initialise the cluster centresciand lett=0.
Step 2. Initialise the fuzzy partition memberships functionsμijaccording to Equation 8.
Step 3. Lett=t+1and compute new cluster centresci
using Equation 9.
Step 4. Repeat steps 2 to 3 until convergence.
An initial setting for each cluster centre is required, and FCM is guaranteed to converge to a local minimisation solution. The efficiency of FCM has been comprehen-sively investigated in [13]. To address the inefficiency of the original FCM algorithm, several variants of the fuzzy c-means algorithm have been introduced which are discussed in the following.
2.2.2 Fuzzy c-means variants
While FCM often provides good clustering results, it also suffers from a relatively high computational complexity, especially when there are many samples as is the case for colour quantisation. However, a number of faster FCM variants have been developed and have also been shown to work well for colour quantisation [14].
To combat the computational complexity of FCM, Cheng et al. [15] proposed a multistage random sampling strategy. This method has a lower number of feature vec-tors and also needs fewer iterations to converge. The basic idea is to randomly sample and obtain a small subset of the dataset in order to approximate the cluster centres of the full dataset. This approximation is then used to reduce the number of iterations. Random sampling FCM (RSFCM) consists of two phases. First, a multistage iter-ative process of a modified FCM is performed. In the second phase, standard FCM is performed with the clus-ter centres approximated by the final clusclus-ter centres from the first phase. It has been shown that RSFCM is able to reduce the computational complexity compared to the classical FCM method.
Ahmed et al. [16] introduced an alternative to classi-cal FCM by adding a term that enables the labelling of a pixel to be associated with its neighbourhood. As a reg-ulator, the neighbourhood term can change the solution towards piecewise homogeneous labelling. As a further extension, in [17], the enhanced FCM (EnFCM) algorithm was presented. In order to reduce the computational com-plexity, a linearity-weighted sum image is formed from the original image, and a modified objective function is employed. EnFCM considers a number of pixels with sim-ilar colours as a weight. Thus, this approach can accelerate the convergence of searching for global similarity.
Anisotropic mean shift-based FCM (AMSFCM) is an efficient approach to fuzzy c-means clustering which utilises an anisotropic mean shift algorithm coupled with fuzzy clustering [14]. Mean shift-based techniques have been shown to be capable of estimating the local den-sity gradients of similar pixels. These gradient estimates are iteratively performed so that all pixels can find similar pixels in the same image [18]. AMSFCM combines fuzzy c-means and anisotropic mean shift, a mean shift variant that does not suffer of shortcomings due to radially sym-metric kernels [19]. Importantly, the AMSFCM algorithm continuously inherits and updates the states, based on the mutual correction of FCM and mean shift.
2.2.3 Rough c-means
Lingras and West [20] introduced a rough set-inspired clustering algorithm based on the well-known c-means algorithm. In this rough c-means (RCM) approach, each clusterckis described not only by its centremk, but also contains additional information, in particular its lower
approximation ck, its upper approximation ck, and its boundary area cbk = ck − ck. The clustering algorithm proceeds in the following steps:
Step 1. Each data sample is randomly assigned to one lower approximation. Since the lower
approximation of a cluster is a subset of its upper approximation, this also automatically assigns the sample to the upper approximation of the same cluster.
Step 2. The cluster centres are updated as
mk = ⎧ ⎪ ⎪ ⎨ ⎪ ⎪ ⎩
ωl
xi∈ck xi
|ck|+ ωb
xi∈cb
k xi
|cbk| ifc b k = {}
ωl
xi∈ck xi
|ck|
otherwise
.
(10)
The cluster centres are hence determined as a weighted average of the samples belonging to the lower approximation and the boundary area, where the weightsωlandωbdefine the relative importance of the two sets.
Step 3. For each data sample, the closest cluster centre is determined and the sample is assigned to its upper approximation. Then, all clusters that are at mostfurther away than the closest cluster are determined. If such clusters exist, the sample will also be assigned to their upper approximations. If no such cluster exists, the sample is assigned also to the lower approximation of the closest cluster. Step 4. If the algorithm has converged (i.e. if the cluster
centres do not change any more, or after a pre-set number of iterations), terminate; otherwise, go to step 2.
Strictly speaking, this algorithm does not implement all properties set out for rough sets [21] and hence belongs to the reduced interpretation of rough sets as lower and upper approximations of data [22].
Peters [23] pointed out some potential pitfalls of the algorithm in terms of objective function and numerical stability and suggested some improvements to overcome these. Equation 10 is revised to
mk=ωl
xi∈ck xi
|ck|+ ωu
xi∈ck xi
|ck|
, (11)
the possibility of situations with empty lower approxima-tions, the calculation of cluster centres can be modified so that for empty lower approximations, the cluster centre is calculated as the average of samples in the upper approxi-mation or by ensuring that each lower approxiapproxi-mation has at least one member.
In [24], an RCM-based colour quantisation is intro-duced which follows the clustering approach from [20] and [23], assigning the data sample closest to the cluster centre to its lower approximation, though with a differ-ent initialisation approach where rather than randomly assigning samples to clusters, random cluster centres are generated first and then the algorithm proceeds with steps 3, 2, and 4 (i.e., steps 2 and 3 reversed) in order to derive a colour palette.
2.2.4 Fuzzy-rough c-means
Fuzzy-rough c-means (FRCM) clustering [25] utilises, in addition to the fuzziness of fuzzy c-means, concepts of rough set theory to provide an effective clustering algorithm that can also be adapted for colour quantisation [26]. In particular, as in rough c-means, each cluster is represented by a lower and an upper approximation. How-ever, while the lower approximation is defined as crisp, the boundary area is fuzzy. While the aim is to minimise the same error functionEas in Equation 7, memberships are defined as
μij= ⎧ ⎪ ⎪ ⎨ ⎪ ⎪ ⎩
1 ∀xi∈cj
1 C
l=1
||xi−mj|| ||xi−ml||)2/(α−1)
∀xi∈cbj . (12)
Calculation of cluster centres mj remains as given in Equation 9, while lower and upper approximations are defined as detailed in Section 2.2.3 for rough c-means. The difference between fuzzy means and fuzzy-rough c-means is hence that the membership values in the lower approximation are 1 (i.e. crisp), while those in the bound-ary region are fuzzy memberships. In other words, fuzzy-rough c-means first partitions the data into two classes: lower approximation and boundary area, and only those points in the boundary region are fuzzified. This in turn leads to faster convergence when compared to FCM [25]. In contrast to rough c-means, samples in the boundary region are not all treated equally but are rather assigned membership values depending on their distance to the cluster centroids. In addition, there is no need to specify weights for the calculation for cluster centroids.
2.3 Colour quantisation performance
In order to evaluate the various colour quantisation algo-rithms, we performed a set of experiments on a set of six test images. These images, Lenna, Peppers, Mandrill,
Sailboat, Airplane, and Pool, are commonly used in the colour quantisation literature and hence present a good test bed for evaluation purposes. We applied all seven discussed algorithms, that is SWASA, FCM, RSFCM, EnFCM, AMSFCM, RCM, and FRCM, to all images to generate quantised images with a palette of 16 colours.
For the simulated annealing algorithm, a population-based version of the SWASA algorithm with a population size of 10 was employed. The start temperature T0 was chosen to be 20, and the cooling coefficient α was set to 0.9. The parameters s0 and β were set to 100 and 5.3, respectively. The temperature was kept constant for over 20 iterations, and the maximum number of iterations was set to 10,000. For the rough c-means approach, we adopted the parametersωl = 0.7, ωu = 0.3, andτ = 0.001 (image pixel values are normalised to [ 0; 3]3). For the fuzzy c-means and fuzzy rough c-means algorithms, the fuzziness exponentαwas set to 1.2.
To put the results we obtained into context, we also implemented four popular colour quantisation algorithms (which are often integrated in typical image processing software) to generate corresponding quantised images with palette size 16. The algorithms we tested were as follows:
• Popularity algorithm [2]: Following a uniform quantisation to 5 bits per channel, theN colours that are represented most often form the colour palette.
• Median cut quantisation [2]: An iterative algorithm that repeatedly splits (by a plane through the median point) colour cells into sub-cells.
• Octree quantisation [3]: The colour space is represented as an octree where sub-branches are successively merged to form the palette.
• Neuquant [4]: A one-dimensional self-organising Kohonen neural network is applied to generate the colour map.
For all algorithms, pixels in the quantised images were assigned to their nearest neighbours in the colour palette to provide the best possible image quality.
The obtained results are listed in Table 1, expressed in terms of average (over 10 runs of the algorithms) peak-signal-to-noise ratio (PSNR) defined as
PSNR(O,Q)=10 log10 255 2
MSE(O,Q), (13)
with MSE(O,Q) calculated as in Equation 1. A higher PSNR hence indicates better image quality.
Table 1 Quantisation results, given in terms of PSNR (dB) with the best result for each image in boldface
Lenna Peppers Mandrill Sailboat Pool Airplane average
Popularity algorithm [2] 22.24 18.56 18.00 8.73 19.87 15.91 17.22
Median cut [2] 23.79 24.10 21.52 22.01 24.57 24.32 23.39
Octree [3] 27.45 25.80 24.21 26.04 29.39 28.77 26.94
Neuquant [4] 27.82 26.04 24.59 26.81 27.08 28.24 26.73
SWASA [8] 27.79 26.16 24.46 26.69 29.84 29.43 27.40
FCM [14] 28.81 26.77 25.03 27.25 31.03 30.23 28.17
RSFCM [14] 28.70 26.70 24.98 27.32 30.81 30.73 28.20
EnFCM [14] 28.61 26.74 24.87 27.22 31.11 29.92 28.08
AMSFCM [14] 28.63 26.71 24.66 27.24 30.87 29.96 28.01
RCM [24] 28.63 26.67 25.02 27.62 29.40 30.50 27.98
FRCM [26] 28.44 26.80 25.03 27.47 31.20 31.24 28.73
of the different fuzzy clustering approaches are fairly simi-lar which suggests that the computationally more efficient versions (RSFCM, EnFCM, AMSFCM) can be employed without sacrificing image quality. Also, the rough set approach gives similar performance and the presented rough colour quantisation approach hence adds to the applications of rough sets in the field of imaging and vision. The best performance is achieved by the com-bined fuzzy-rough c-means approach, which gives the best image quality for four of the six images and overall provides a PSNR improvement of more than 0.5 compared to the next ranked algorithm.
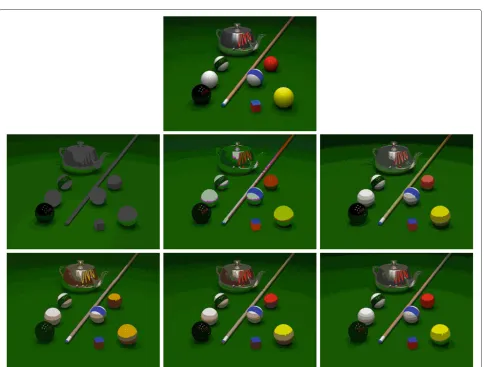
Figure 2 shows the Pool image together with the images colour quantised by the popularity, median cut, octree, and Neuquant algorithms as well as two of the soft-computing based techniques, namely the rough c-means and fuzzy-rough c-means approaches. It is clear that the popularity algorithm performs poorly on this image and assigns virtually all of the colours in the palette to green and achromatic colours. Median cut is better but still provides a fairly poor colour reproduction; most of the colours in the quantised image are fairly different from the original. The same holds true for the images produced by Neuquant. Here, the most obvious artefact is the absence of an appropriate red colour in the colour palette. A far better result is achieved by the octree algorithm, although here also, the red is not very accurate and the colour of the cue is greenish instead of brown. Clearly better image quality is maintained by applying the rough c-means algo-rithm. Although the colour palette has only 16 entries, all colours of the original image are accurately presented including the red ball and the colour of the billiard cue. A further improvement is achieved by the fuzzy-rough c-means colour quantisation technique which achieves even better colour reproduction, e.g. in the reflections on the black ball.
2.4 Hybrid optimisation-based colour quantisation Figure 3 shows a typical run of the simulated anneal-ing optimisation method applied to colour quantisation as explained in Section 2.1. The solid line represents the average quantisation error over time (iterations) while the dashed line represents the best solution of each iteration.
As can be seen in Figure 3, there is always a varia-tion in error values within the populavaria-tion which indicates that although simulated annealing is able to find good solutions (as was confirmed in Section 2.3), i.e. solu-tions from within the region around the global optimum, it rarely exploits that region completely. Therefore, in [27], SWASA was combined with a standard c-means clustering algorithm [28] to provide a stacked hybrid optimisation method. C-means clustering is guaranteed to converge towards the local clustering minimum by iteratively carrying out the following two steps:
1
Figure 3Typical run of SA optimisation for colour quantisation [27].
• Each input vector is mapped to its closest codeword by a nearest neighbour search.
• The input vectors assigned in each class (i.e. for each codeword) are represented by the centroid of the vectors in that class.
In this hybridised algorithm, the SA component is hence responsible for identifying the region in the search space that will contain the global optimum while the c-means component will then descend into the minimum present in that region.
To show the effect of this hybridisation, we ran the com-bined algorithm on the same image dataset that was used in Section 2.3, and show the results, again in terms of PSNR, in Table 2. As can be seen from there, the further adjustment through application of a subsequent cluster-ing step does indeed improve image quality significantly, resulting in a colour quantisation algorithm that also outperforms all algorithms from Table 1.
2.5 Image quality metric-based colour quantisation Although many colour quantisation algorithms have been proposed, virtually all of them define the goal of quantisation as that of finding a palette that minimises the MSE, given in Equation 1, of the resulting image. It is how-ever well known that metrics such as MSE and PSNR do not correspond very well to how the human visual sys-tem operates and how humans judge differences between images. An image with a higher MSE does not necessar-ily have perceptually lower image quality; similarly, two images that are perceived with equal quality are likely to have different values in terms of MSE or PSNR.
Table 2 Quantisation results, given in terms of PSNR (dB), of the hybrid SA algorithm
Lenna Peppers Mandrill Sailboat Pool Airplane average
SWASA [8] 27.79 26.16 24.46 26.69 29.84 29.43 27.40
Hybrid SWASA [27] 29.70 27.17 25.37 27.95 31.57 32.94 28.97
correspond well to how humans perceive colour differ-ences. Much research has been done on deriving colour spaces such as CIELAB and CIELUV that are designed to be perceptually uniform, i.e. where Euclidean distances correspond to perceived distances in all regions of the colour space [29]. Uniform colour spaces have been used in colour quantisation algorithms and have been shown to perform better compared to algorithms based on the RGB space [30].
However, the application of a perceptual uniform colour space alone does not guarantee improved image quality. Uniform colour spaces were developed for and hence only accurately model the colour differences between large patches of uniformly coloured samples. Real images on the other hand seldomly comprise such large areas. Therefore, it is crucial to also take into account the spatial charac-teristics of images when developing an appropriate image quality metric [31].
S-CIELAB (for spatial CIELAB [32]) first converts the RGB image into an opponent colour space. The individual channels are then convolved with a kernel whose shape is estimated from the visual spatial sensitivity to that chan-nel. This convolution simulates the blurring that occurs in the human visual system. Both the opponent colour space and the convolution kernels were derived following a series of experiments on the pattern-colour separabil-ity of the visual system [33]. After the filtering, the image is converted to XYZ and then to CIELAB to provide spa-tial CIELAB co-ordinates. The difference between two images can then be expressed as the average colour dif-ference, expressed in terms ofEunits, between the two S-CIELAB representation, where the colour difference is usually calculated as the Euclidean distance between two colours.
In contrast to colour spaces such as CIELAB, for which colour quantisation can be easily adapted [30] by con-verting the RGB image to the new colour space and then
applying the quantisation algorithm, this is not possible for S-CIELAB. The reason is that S-CIELAB does not sim-ply provide a new colour space but takes into account the spatial interaction between neighbouring pixels. It is therefore image dependent, and identical S-CIELAB co-ordinates in two different images can originate from fairly different original RGB values. In the context of colour quantisation, this means that converting an image to S-CIELAB and performing the quantisation there will not lead to an optimal palette. Rather, the palette has to be found in the palette search space, and then the image quality is calculated based on the quantised image. This is possible using optimisation techniques such as the SWASA algorithm explained in Section 2.1 to develop an image metric-based colour quantisation algorithm [34]. The objective function to be minimised here is defined as the averageE between the original imageOand the image quantised using the colour palette.
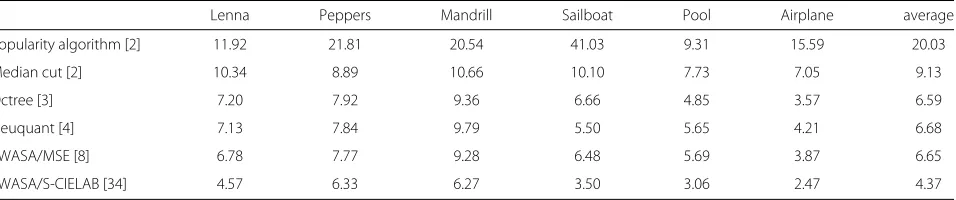
That this leads indeed to improved performance is again evaluated on the same image dataset as in Section 2.3. The results are given in Table 3. From there, it is evident that optimisation-based colour quantisation based on min-imising MSE clearly outperforms conventional algorithms also when expressed in terms of S-CIELAB image quality. However, directly optimising with respect to this image metric leads to a significant further improvement, reduc-ing the averageEfrom 6.65 to 4.37.
3 Conclusions
In this paper, we have given an overview of recent soft computing-based colour quantisation approaches and have shown that this family of algorithms work very well, resulting in quantised images with high image quality. In particular, we have discussed the use of optimisa-tion algorithms such as simulated annealing and of soft computing-based clustering algorithms including fuzzy c-means, rough c-means, and combined fuzzy-rough
Table 3 Quantisation results, given in terms ofES−CIELAB
Lenna Peppers Mandrill Sailboat Pool Airplane average
Popularity algorithm [2] 11.92 21.81 20.54 41.03 9.31 15.59 20.03
Median cut [2] 10.34 8.89 10.66 10.10 7.73 7.05 9.13
Octree [3] 7.20 7.92 9.36 6.66 4.85 3.57 6.59
Neuquant [4] 7.13 7.84 9.79 5.50 5.65 4.21 6.68
SWASA/MSE [8] 6.78 7.77 9.28 6.48 5.69 3.87 6.65
c-means approaches in this context. All techniques were compared against standard colour quantisation meth-ods and were shown to clearly outperform them. A hybrid colour quantisation algorithm, combining simu-lated annealing with a c-means clustering algorithm, was shown to lead to improved performance, while by mod-ifying the objective function, optimisation-based colour quantisation algorithms can be tuned with respect to a particular image quality metric. Although the compiled results convincingly demonstrate that soft computing-based methods are well suited for the colour quantisation problem, it should also be noted that they typically have higher demands in terms of computational complexity and might hence be suitable only for situations where the quantisation stage is not time critical.
Competing interests
The author declares that he has no competing interests.
Received: 11 April 2012 Accepted: 9 January 2014 Published: 28 January 2014
References
1. X Wu, Color quantization by dynamic programming and principal analysis. ACM Trans. Graph.11(4), 348–372 (1992)
2. P. S Heckbert, Color image quantization for frame buffer display. ACM Comput. Graph. (ACM SIGGRAPH ’82 Proc.)16(3), 297–307 (1982) 3. M Gervautz, W Purgathofer, A simple method for color quantization:
octree quantization, inGraphics Gems, ed. by A. S. Glassner (ACM, San Diego, 1990), pp. 287–293
4. A. H Dekker, Kohonen neural networks for optimal colour quantization. Network: Comput. Neural Syst.5, 351–367 (1994)
5. P Scheunders, A genetic c-means clustering algorithm applied to color image quantization. Pattern Recognit.30(6), 859–866 (1997)
6. M Omran, A Engelbrecht, A Salman, A color image quantization algorithm based on particle swarm optimization. Informatica.29, 263–271 (2005) 7. J Kennedy, R Eberhart, Particle swarm optimization. IEEE Int. Conference
on Neural Networks.4, 1942–1948 (1995)
8. G Schaefer, L Nolle, An optimisation approach to colour palette generation. Int. J. Pattern Recognit. Mach. Intell.1(1), 40–46 (2006) 9. S Kirkpatrick, CD Gelatt, MP Vecchi, Optimization by simulated annealing.
Science.220(4598), 671–680 (1983)
10. L Nolle, On the effect of step width selection schemes on the performance of stochastic local search strategies, in18th European Simulation Multi-Conference, ESM 2004,Magdeburg (Gruner, Druck, Erlangen, 2004), pp. 149–153
11. K Chuang, S Tzeng, H Chen, J Wu, T Chen, Fuzzy c-means clustering with spatial information for image segmentation. Comput. Med. Imaging Graph.30, 9–15 (2006)
12. J Bezdek, A convergence theorem for the fuzzy isodata clustering algorithms. IEEE Trans. Pattern Anal. Mach. Intell.2, 1–8 (1980)
13. R Hu, L Hathaway, On efficiency of optimization in fuzzy c-means. Neural, Parallel Sci. Comput.10, 141–156 (2002)
14. G Schaefer, H Zhou, Fuzzy clustering for colour reduction in images. Telecommun. Syst.40(1–2), 17–25 (2009). doi:10.1007/s11235-008-9143-8 15. T Cheng, D Goldgof, L Hall, Fast fuzzy clustering. Fuzzy Sets Syst.
93, 49–56 (1998)
16. M Ahmed, S Yamany, Mohamed N, A Farag, T Moriaty, A modified fuzzy c-means algorithm for bias field estimation and segmentation of MRI data. IEEE Trans. Med. Imaging.21, 193–199 (2002)
17. L Szilagyi, Z Benyo, SM Szilagyii, HS Adam, MR brain image segmentation using an enhanced fuzzy c-means algorithm, in25th IEEE International Conference on Engineering in Medicine and Biology, vol. 1 (IEEE, Piscataway, 2003), pp. 724–726
18. D Comaniciu, P Meer, Mean shift: a robust approach toward feature space analysis. IEEE Trans. Pattern Anal. Mach. Intell.24, 603–619 (2002)
19. J Wang, B Thiesson, Y Xu, M Cohen, Image and video segmentation by anisotropic kernel mean shift, in8th European Conference on Computer Vision(Springer, Berlin, 2004), pp. 238–2492
20. P Lingras, C West, Interval set clustering of web users with rough k-means. J. Intell. Inform. Syst.23, 5–16 (2004)
21. Z Pawlak, Rough sets. Int. J. Inform. Comput. Sci.11, 145–172 (1982) 22. YY Yao, X Li, TY Lin, Q Liu, Representation and classification of rough set
models, inSoft Computing: Third International Workshop on Rough Sets and Soft Computing : (RSSC94), ed. by TY Lin, A Martin Wildberger (Society for Computer Simulation International, San Diego, 1994), pp. 630–637 23. G Peters, Some refinements of rough k-means clustering. Pattern
Recognit.39, 1481–1491 (2006)
24. G Schaefer, H Zhou, M Celebi, A Hassanien, Rough colour quantisation. Int. J. Hybrid Inform. Syst.8(1), 25–30 (2011). doi10.3233/HIS-2011-0128 25. Q Hu, D Yu, An improved clustering algorithm for information
granulation, inFuzzy Systems and Knowledge Discovery, ed. by L Wang, Y Jin (Springer, Heidelberg, 2005), pp. 494–504
26. G Schaefer, G Hu, H Zhou, J Peters, A Hassanien, Rough c-means and fuzzy rough c-means for colour quantisation. Fundam. Inform.
119(1), 113–120 (2012). doi10.3233/FI-2012-729
27. L Nolle, G Schaefer, Color map design through optimization. Eng. Optimization.39(3), 327–343 (2007)
28. Y Linde, A Buzo, RM Gray, An algorithm for vector quantizer design. IEEE Trans. Commun.28, 84–95 (1980)
29. B Hill, T Roger, FW Vorhagen, Comparative-analysis of the quantization of color spaces on the basis of the CIELAB color-difference formula. ACM Trans. Graph.16(2), 109–154 (1997)
30. RS Gentile, JP Allebach, E Walowit, Quantization of color images based on uniform color spaces. J. Imaging Technol.16, 11–21 (1990)
31. MP Eckert, AP Bradley, Perceptual quality metrics applied to still image compression. Signal Process.70, 177–200 (1998)
32. X Zhang, BA Wandell, A spatial extension of CIELAB for digital color image reproduction. Journal of the Society for Information Display.
5(1), 61–63 (1997)
33. AB Poirson, BA Wandell, Pattern-colour separable pathways predict sensitivity to simple coloured patterns. Vis. Res.36(4), 515–526 (1996) 34. G Schaefer, L Nolle, Quality metric based colour palette optimisation, in
2006 IEEE International Conference on Image Processing(IEEE, Piscataway, 2006), pp. 1793–1796
doi:10.1186/1687-5281-2014-8
Cite this article as:Schaefer:Soft computing-based colour quantisation.
EURASIP Journal on Image and Video Processing20142014:8.
Submit your manuscript to a
journal and benefi t from:
7Convenient online submission
7Rigorous peer review
7Immediate publication on acceptance
7Open access: articles freely available online
7High visibility within the fi eld
7Retaining the copyright to your article
![Figure 3 Typical run of SA optimisation for colour quantisation[27].](https://thumb-us.123doks.com/thumbv2/123dok_us/916748.1589561/7.595.306.542.88.252/figure-typical-run-sa-optimisation-for-colour-quantisation.webp)