Analysis of DD, TT and DT Neutron Streaming
Experiments with the ADVANTG Code
Bor
Kos
JSIandUL
Ljubljana,Slovenia
Theodora Vasilopoulou
NCSRD Athens, Greece [email protected]
Scott W. Mosher
ORNL Oak Ridge, USA [email protected]
Ivan A. Kodeli
JSI Ljubljana, Slovenia
Robert E. Grove
ORNL Oak Ridge, USA [email protected]
Jonathan Naish
CCFE
Oxford, United Kingdom [email protected]
Barbara Obryk
IFJ Krakow, Poland [email protected]
Rosaria Villari
ENEA Frascati, Italy [email protected]
Paola Batistoni
ENEA Frascati, Italy [email protected]
and JET Contirbutors*
Abstract—The paper presents an analysis of DD, TT and DT neutron streaming benchmark experiments with the recently released hybrid transport code ADVANTG (AutomateD VAriaNce reducTion Generator). ADVANTG combines the deterministic neutron transport solver Denovo with the Monte Carlo transport code MCNP via the principle of variance reduction. It auto-matically produces weight-window and source biasing variance reduction parameters based on the CADIS (Consistent Adjoint Driven Importance Sampling) methodology. Using this novel hybrid methodology Monte Carlo simulations of realistic complex fusion streaming geometries have become possible. In this paper the experimental results from the 2016 DD campaign using measurements with TLDs and activation foils up to 40 m from the plasma source are analyzed. New detailed models of the detector assemblies were incorporated into the JET 360° MCNP model for this analysis. In preparation of the TT and DTE2 campaigns at JET a pre-analysis for these campaigns is also presented.
Index Terms—JET, hybrid transport, MCNP, ADVANTG, TLD, activation foils
I. INTRODUCTION
Neutron transport calculation and estimations of the neutron flux and doses far away from the plasma source in large fusion tokamak devices such as the International Thermonuclear Ex-perimental Reactor (ITER) are challenging not only because of the complexity of the machine but also because of the physical processes involved. Therefore, validation of the state-of-the-art of radiation transport codes and tools and nuclear data against experimental results in real tokamak environment is needed to ensure reliability in ITER predictions. Within JET3 program in the frame of EUROfusion consortium, neutronics experiments are in preparation for the future high performance Deuterium-Tritium campaign (DTE2) at the Joint European Torus (JET) to validate ITER tools, codes and assumptions.
One such neutronics benchmark, the Neutron Streaming Experiment[1], [2] is currently being performed. It consists of measurements of neutron flux at several experimental positions
*see the author list of X. Litaudon et al 2017 Nucl. Fusion 57 102001
throughout the JET Torus Hall with thermo-luminescent de-tectors (TLDs) and activation foils and simulation of neutron flux and doses at the experimental positions using state-of-the-art deterministic, Monte Carlo and hybrid transport codes alongside the latest evaluations of nuclear data and the calculated data are compared to the experimental quantities
Up until now measurements have been performed only during Deuterium–Deuterium (DD) campaigns since 2012. The last experiment was conducted in 2016 in preparation of future DTE2 (Deuterium-Tritium Experiment 2) campaign [2]. The detectors were located in several positions in the Torus Hall close to the tokamak and in two key locations – the southwest labyrinth and in the southeast chimney. These zones represent an extremely challenging problem for deterministic and Monte Carlo neutron transport simulations. In recent years so called hybrid deterministic/Monte Carlo code systems have been developed that use variance reduction parameters based on an approximate global deterministic adjoint/forward calculation to speed up the convergence of a Monte Carlo simulation.
The AutomateD VAriaNce reducTion Generator (AD-VANTG) [3] code is a Deterministic/Monte Carlo two-step transport code. In the first step it uses the Denovo discrete or-dinate deterministic solver to calculate an approximate adjoint and forward global neutron flux field which is used as the basis to determine variance reduction parameters for the second step precise Monte Carlo N-Particle (MCNP) [4] calculation.
II. NEUTRAL PARTICLE TRANSPORT METHODOLOGY
Two main approaches to neutral particle transport simulation in fission and fusion applications are usually used -deterministic approach for solving the neutron transport or Boltzmann equation and the Monte Carlo approximation. Each of the two approaches has its benefits and drawbacks. The hybrid methodology tries to combine the benefits of both while diminishing the drawbacks. The deterministic, Monte Carlo and hybrid approaches are discussed in the following sub-sections.
A. Deterministic transport simulations
Analytical solutions of the Boltzmann non-multiplying integro-differential equation 1, given bellow, of real life prob-lems with complex geometries and realistic material compo-sition are difficult or impossible.
ˆ
⌦· r (~r,⌦ˆ, E) + ⌃t(~r, E) (~r,⌦ˆ, E) =
=
Z 1
0 Z
4⇡
⌃s(~r,⌦ˆ0·⌦~, E0 !E) (~r,⌦ˆ0, E0)d⌦ˆ0dE0+
+q(~r,⌦ˆ, E) (1)
Where ~r is the spatial variable, ⌦ˆ is the unit vector
de-termining the direction of flight, E is the energy and the
angular neutron flux.⌃t is the total cross section and⌃s the scattering cross section.qrepresents the external fixed source of neutrons.
Several numerical approximations to solve the Boltzmann equation were derived and one of the most commonly used for fixed source shielding simulations is the discrete ordinates approach (SN). In the SN method, used by the deterministic
solver Denovo [5], the energy variable is discretized into a number of energy groups and the cross-sections are approx-imated by histograms in energy. The angular variable is dis-cretized by using the discrete ordinatesSN approximation. The
scattering cross sections is approximated using the Legandre polynomial expansion. The spatial variable is discretized using different techniques such as finite-difference, finite-element or nodal methods. The discretization of variables using numerical methods introduces a number of approximations which in turn results in possibly less accurate final results. Deterministic simulations require significant amounts of computer memory which increases with the level of details introduced in the computational model i.e. number of geometrical voxels, angles and energy groups used. On the other hand these simulations are usually inexpensive considering computer processing time and produce global results in one computational run.
B. Monte Carlo transport simulations
The Monte Carlo (MC) method for neutron transport sim-ulations is based on the fact that macroscopic cross sections can be interpreted as the probability of interaction per unit distance. By simulating a large enough number of individual particle histories by using random sampling faithful to the underlying physics the average behavior of particles in the
physical system can be determined. With MC there is no need to solve the transport equation directly and thusly in principal no error1 is introduced to the simulation because of the discretization in space, energy and angle. Using MC methods we get an accurate result but with an uncertainty which is related to the number of detected ortallied particle histories. The simulation uncertainty decreases with a square-root dependency on the number of tallied particle histories
O(1/pN). To decrease the statistical uncertainty an ample
number of particle histories have to be simulated which in turn requires large amounts of computer processing time. This problem is especially problematic in scenarios where there are highly attenuating materials between the particle source and detector or simply when the detector is far away from the source. Another drawback of MC methods is the lack of global results. In MC simulations one is usually interested only in a few areas of interest rather than in a global result (eg. dose field) because such a calculation would be computationally too expensive.
C. Hybrid transport simulations
As we have shown in previous sections, neutron transport can be simulated by fast, less accurate deterministic solvers or by computationally expensive, more accurate Monte Carlo methods. Analog MC simulations, simulations where no vari-ance reduction is used, often do not produce statistically relevant results in a reasonable computer processing time for cases with high attenuating materials between the source and detector. In such cases variance reduction is needed. Several variance reduction techniques can be used in Monte Carlo simulations. The idea behind hybrid codesis to combine the best attributes of both families of codes via the principle of variance reduction.
In this analysis the so called weight-window variance reduc-tion technique is used to increase the importance of histories which will contribute to the detector tally and disregard the histories that will not. Weight-windows are a particle popula-tion control variance reducpopula-tion technique, where the particle is split if its weight is above the wight-window upper bound and terminated (Russian roulette is played) if the particle weight is too low. This is done in a statistically consistent way in order not to bias the final results.
One of the current methods used to determine effective weight-windows variance reduction parameters is based on the adjoint flux - a measure of theimportance of neutrons con-tributing to the response of the detector. Because calculating the adjoint flux with MC methods would be computationally as expensive as calculating the flux, a computationally inex-pensive rough approximation of the adjoint flux is calculated with a deterministic code. The adjoint flux calculated using the rough deterministic approximation is used to construct weight-window variance reduction parameters for a detailed MC calculation.
1Inaccuracies in MC simulations usually arise from approximations in
II. NEUTRAL PARTICLE TRANSPORT METHODOLOGY
Two main approaches to neutral particle transport simulation in fission and fusion applications are usually used -deterministic approach for solving the neutron transport or Boltzmann equation and the Monte Carlo approximation. Each of the two approaches has its benefits and drawbacks. The hybrid methodology tries to combine the benefits of both while diminishing the drawbacks. The deterministic, Monte Carlo and hybrid approaches are discussed in the following sub-sections.
A. Deterministic transport simulations
Analytical solutions of the Boltzmann non-multiplying integro-differential equation 1, given bellow, of real life prob-lems with complex geometries and realistic material compo-sition are difficult or impossible.
ˆ
⌦· r (~r,⌦ˆ, E) + ⌃t(~r, E) (~r,⌦ˆ, E) =
=
Z 1
0 Z
4⇡
⌃s(~r,⌦ˆ0·⌦~, E0!E) (~r,⌦ˆ0, E0)d⌦ˆ0dE0+
+q(~r,⌦ˆ, E) (1)
Where ~r is the spatial variable, ⌦ˆ is the unit vector
de-termining the direction of flight, E is the energy and the
angular neutron flux. ⌃t is the total cross section and⌃s the scattering cross section.qrepresents the external fixed source of neutrons.
Several numerical approximations to solve the Boltzmann equation were derived and one of the most commonly used for fixed source shielding simulations is the discrete ordinates approach (SN). In the SN method, used by the deterministic
solver Denovo [5], the energy variable is discretized into a number of energy groups and the cross-sections are approx-imated by histograms in energy. The angular variable is dis-cretized by using the discrete ordinatesSN approximation. The
scattering cross sections is approximated using the Legandre polynomial expansion. The spatial variable is discretized using different techniques such as finite-difference, finite-element or nodal methods. The discretization of variables using numerical methods introduces a number of approximations which in turn results in possibly less accurate final results. Deterministic simulations require significant amounts of computer memory which increases with the level of details introduced in the computational model i.e. number of geometrical voxels, angles and energy groups used. On the other hand these simulations are usually inexpensive considering computer processing time and produce global results in one computational run.
B. Monte Carlo transport simulations
The Monte Carlo (MC) method for neutron transport sim-ulations is based on the fact that macroscopic cross sections can be interpreted as the probability of interaction per unit distance. By simulating a large enough number of individual particle histories by using random sampling faithful to the underlying physics the average behavior of particles in the
physical system can be determined. With MC there is no need to solve the transport equation directly and thusly in principal no error1 is introduced to the simulation because of the discretization in space, energy and angle. Using MC methods we get an accurate result but with an uncertainty which is related to the number of detected ortallied particle histories. The simulation uncertainty decreases with a square-root dependency on the number of tallied particle histories
O(1/pN). To decrease the statistical uncertainty an ample
number of particle histories have to be simulated which in turn requires large amounts of computer processing time. This problem is especially problematic in scenarios where there are highly attenuating materials between the particle source and detector or simply when the detector is far away from the source. Another drawback of MC methods is the lack of global results. In MC simulations one is usually interested only in a few areas of interest rather than in a global result (eg. dose field) because such a calculation would be computationally too expensive.
C. Hybrid transport simulations
As we have shown in previous sections, neutron transport can be simulated by fast, less accurate deterministic solvers or by computationally expensive, more accurate Monte Carlo methods. Analog MC simulations, simulations where no vari-ance reduction is used, often do not produce statistically relevant results in a reasonable computer processing time for cases with high attenuating materials between the source and detector. In such cases variance reduction is needed. Several variance reduction techniques can be used in Monte Carlo simulations. The idea behind hybrid codesis to combine the best attributes of both families of codes via the principle of variance reduction.
In this analysis the so called weight-window variance reduc-tion technique is used to increase the importance of histories which will contribute to the detector tally and disregard the histories that will not. Weight-windows are a particle popula-tion control variance reducpopula-tion technique, where the particle is split if its weight is above the wight-window upper bound and terminated (Russian roulette is played) if the particle weight is too low. This is done in a statistically consistent way in order not to bias the final results.
One of the current methods used to determine effective weight-windows variance reduction parameters is based on the adjoint flux - a measure of the importance of neutrons con-tributing to the response of the detector. Because calculating the adjoint flux with MC methods would be computationally as expensive as calculating the flux, a computationally inex-pensive rough approximation of the adjoint flux is calculated with a deterministic code. The adjoint flux calculated using the rough deterministic approximation is used to construct weight-window variance reduction parameters for a detailed MC calculation.
1Inaccuracies in MC simulations usually arise from approximations in
computational modeling (geometry, materials, source) and nuclear data un-certainties.
D. ADVANTG
ADVANTG (AutomateD VAriaNce reducTion Generator) [3] was developed at Oak Ridge National Laboratory and released in 2015. ADVANTG generates space- and energy-dependent mesh-based weight-window bounds and biased source distributions. The variance reduction (VR) parameters are based on a discrete ordinates solution of the adjoint trans-port equation calculated by Denovo. The variance reduction parameters can be produced for a continuous-energy Monte Carlo simulation of fixed-source neutron, photon, and coupled neutron-photon transport problems. Specifically ADVANTG implements the Consistent Adjoint Driven Importance Sam-pling (CADIS) method [6] to generate parameters to accelerate the convergence rate of an individual tally in a MCNP5 code version 1.6 [4] simulation. Alternatively, the Forward-Weighted CADIS (FW-CADIS) method [7] can be used to obtain relatively uniform rates of convergence across multiple tallies or the space and energy bins of an arbitrary sized mesh tally in a MCNP defined problem.
The CADIS method was developed to accelerate the esti-mation of a detector response of the general form (2)
R=
Z Z
q(~r, E)Φ†(~r, E)dV dE (2)
where q is a known source distribution andֆis the scalar
adjoint flux corresponding to the adjoint source q = σd.
Central values of the weight windows are calculated as (3)
w(~r, E) = R
Φ† (3)
An important feature of the CADIS method is the use of a consistent biased source distribution (4)
ˆ
q(~r, E) = 1
Rq(~r, E)Φ
† (4)
where q is the unbiased source distribution. This source is consistentin the sense that source particles will be assigned a weight identical to the value given by equation 3.
The FW-CADIS method was developed to uniformly ac-celerate the convergence of several tallies in a Monte Carlo simulation which differ in their location and energy response of the form (5)
Ri=
Z Z
σd,i(~r, E)Φ(~r, E)dV dE (5)
where i=1,2,. . . ,N, and both σd,i andN are arbitrary and Φ(~r, E)is the scalar flux corresponding to source distribution
q. This is accomplished by constructing an adjoint source that consists of appropriately weighted contributions from all tallies of interest. The weights are the inverses of the individual responses (6)
q† = 1
R1 σd,1+
1
R2
σd,2+· · ·+
1
RN
σd,N (6)
In the FW-CADIS formalism an initial forward calculation is needed to determine the weighted adjoint sources for
the second step adjoint calculation. The importance function calculated using the weighted adjoint sources is then used to construct weight-window bounds and a biased source distri-bution using the CADIS formalism.
III. STREAMING EXPERIMENT
During three different experimental campaigns in 2012, 2013-2014 and 2016 measurements were performed with both the very sensitive thermo-luminescence detectors (TLD) and activation foils. Lessons learned in the 2012 and 2013-2014 campaigns were used to repeat the measurements during the 2016 DD campaign [2]. In this paper only the 2016 results are analyzed.
To differentiate between the neutron and non-neutron com-ponents of the dose field the team from the Institute of Nuclear Physics (IFJ) in Poland used two different detectors - natural and suppressed 6Li based detectors. The highly sensitive natLiF: Mg,Cu,P (MCP-N) and7LiF:Mg,Cu,P (MCP-7) TLDs. The MCP-N TLDs contained natural lithium with natural abundance 7.59% of6Li. The MCP-7 TLDs have suppressed 6Li to 0.03% with the rest lithium content composed of to 99.97 %7Li. The TLD types and the current assembly were optimized on the basis of previous experience (2012–2014 DD campaigns [1]).
Three different kinds of activation foils were used to deter-mine the reaction rate during the 2016 DD campaign. The foils were produced and analyzed by Institute of Nuclear and Radio-logical Sciences, Energy, Technology & Safety “Demokritos” (NCSRD) in Greece. The three different foils were: cobalt (Co), tantalum (Ta) and silver (Ag). The chemical purity of all foils was above 99.9 %. The foils were used bare and with a0.5 mmthick Cadmium foil to cut off thermal neutrons. All of the disc-shaped foils had the same dimensions: diameter = 14.9 mm, thickness= 0.5 mm. The measured reaction rates
on the foils were for the following reactions: 59Co(n,γ)60Co, 181Ta(n,γ)182Ta,109Ag(n,γ)110mAg. The foil activity was mea-sured at NCSRD using a gamma-ray spectrometry system based on a high-purity coaxial germanium semiconductor detector (GEM80) of 85% relative efficiency,1.37 keVenergy
resolution (Full Width at Half Maximum) at the1332 keVand
a peak-to-Compton ratio of 93:1. Detailed information on the TLD and activation foil calibration process and composition is provided in references [8] and [9].
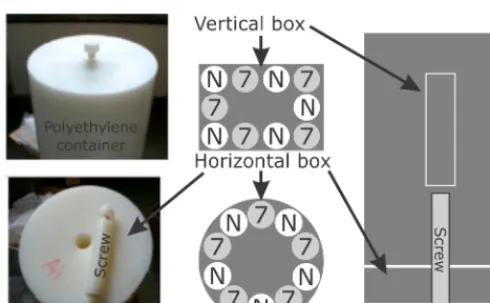
To investigate the shadowing effect in the directional neu-tron field two (vertical and horizontal) high-density polyethy-lene (HDPE) boxes were used to hold the TLDs and the activation foils. The two boxes were also immersed in a container (diameter = 25.5 cm, height = 25 cm) also made from the HDPE. The configuration of the TLDs in the HPDE boxes and container are shown in Fig. 1. The activations foils were configured in HDPE containers similar to the ones containing TLDs.
Fig. 1. TLD assemblies of N: MCP-N and 7: MCP-7 TLDs in high density polyethylene holders and container.
labyrinth is a five segment dogleg configuration of borated concrete, and the chimney consists of three large air ducts that connect the basement with the torus hall. A 3D representation of the tokamak, tokamak hall and the detector locations is given in Fig. 2. The TLD detectors were positioned at locations A1 - A8 and B1 - B8. Location B8 was not analyzed because the neutron flux measured there during the 2016 DD campaign with the TLDs was at background levels. Location B5 was also omitted from this analysis because of a positioning mistake during installation.
Assemblies with activation foil were positioned at locations A1, A2, A4 and B2, B3, B5. However, no reliable experimental data were acquired for position B2, due to a displacement of foils within the respective HDPE container. More on the specifics of the experimental data results from the 2016 DD campaign in Section V.
IV. CALCULATIONS AND MODEL INFORMATION
The full 360° JET MCNP model used in this analysis con-sists of a detailed plasma containment model and other major streaming relevant components including the SE Chimney and SW labyrinth features. The simplifications done to the model are presumed not to affect the final transport results. The model was developed and verified by the Culham Center for Fusion Energy and other contributors. A 3D representation of the model is presented in Fig.22.
The DD and DT neutron source spectrum integrated in MCNP was used for the energy distribution of the plasma source while the spatial distribution is a faithful but simplified representation of a typical thermal plasma shape. The TT energy source spectra was calculated using a source sub-routine for MCNP [10]. FENDL 3.1b [11] based libraries were used for both the multigroup deterministic ADVANTG calculation and the continuous energy Monte Carlo MCNP calculation. Some nuclide nuclear data missing from FENDL 3.1b was taken from JEFF-3.2 [12].
For this analysis the complete detailed models of the TLDs, activation foils, holders and containers were produced and
2The MCNP model is rotated 90°clockwise relative to true North.
incorporated into a single JET MCNP model for the first time. Up to now, two different approaches had been implemented: either a one-step MCNP calculations without detailed detector models (CCFE) or two-step MCNP calculations with detailed detector models (NCSRD). For this paper the lessons learned from previous analyses were used to produce effective variance reduction parameters using ADVANTG. Theoptimalvariance reduction parameters produced statistically relevant simulation results in volume averaged track-length estimator tallies posi-tioned in the actual detectors up to40 maway from the plasma
source.
As mentioned before, a hybrid two step workflow combin-ing the deterministic based code ADVANTG version 3.0.3. and stochastic transport code MCNP5 v. 1.6 was used for all calculations in this paper.
In the first step optimal variance reduction parameters were produced using the FENDL 3.1b based 47 neutron energy group library, a dedicated forward peaking quadrature set, 5th order of scattering cross section expansion and, most important, unique non-uniform Cartesian spatial meshes for each detector location. The spatial meshes ranged from a total of 1 million to about 5 million spatial voxels. These input parameters were used by ADVANTG to execute Denovo and produce an approximate importance (adjoint) function using Denovo. The importance function was then used to produce weight window and source biasing VR parameters for each detector (TLD or activation foil) using the CADIS methodology described in Sec. II-D.
Using the VR parameters produced in the first step, the second step MCNP calculations were performed for each detector. The computational results for the DD plasma source are presented and compared to experimental results in Sec. V-A. Preliminary results for the two other plasma sources (TT and DTE2) are presented in Sec. V-B in preparation for the analysis of the TT and DT campaigns currently underway at JET.
V. RESULTS
Two sets of results corresponding to the two different detectors (TLDs and activation foils) are presented in this section. The computational results are presented and compared to the 2016 DD experimental campaign in Sec. V-A. Because of the delays in the TT and DT campaigns only pre-analysis calculation results for the TLDs are presented in Sec. V-B. These calculation results are also compared to the DD results. Such a comparison is beneficial for future experimental con-figurations.
A. Analysis of DD benchmark experiment
All activation foils and TLDs in positions A1-A4, B2, B3, and B5 were irradiated with a total of 3.52· 1018 neutrons. The other TLDs were irradiated up to 6.18·1018. In the case of the TLDs, both the experimental and calculation fluence results were normalized to per source particle. Only the 1σ
Fig. 1. TLD assemblies of N: MCP-N and 7: MCP-7 TLDs in high density polyethylene holders and container.
labyrinth is a five segment dogleg configuration of borated concrete, and the chimney consists of three large air ducts that connect the basement with the torus hall. A 3D representation of the tokamak, tokamak hall and the detector locations is given in Fig. 2. The TLD detectors were positioned at locations A1 - A8 and B1 - B8. Location B8 was not analyzed because the neutron flux measured there during the 2016 DD campaign with the TLDs was at background levels. Location B5 was also omitted from this analysis because of a positioning mistake during installation.
Assemblies with activation foil were positioned at locations A1, A2, A4 and B2, B3, B5. However, no reliable experimental data were acquired for position B2, due to a displacement of foils within the respective HDPE container. More on the specifics of the experimental data results from the 2016 DD campaign in Section V.
IV. CALCULATIONS AND MODEL INFORMATION
The full 360° JET MCNP model used in this analysis con-sists of a detailed plasma containment model and other major streaming relevant components including the SE Chimney and SW labyrinth features. The simplifications done to the model are presumed not to affect the final transport results. The model was developed and verified by the Culham Center for Fusion Energy and other contributors. A 3D representation of the model is presented in Fig.22.
The DD and DT neutron source spectrum integrated in MCNP was used for the energy distribution of the plasma source while the spatial distribution is a faithful but simplified representation of a typical thermal plasma shape. The TT energy source spectra was calculated using a source sub-routine for MCNP [10]. FENDL 3.1b [11] based libraries were used for both the multigroup deterministic ADVANTG calculation and the continuous energy Monte Carlo MCNP calculation. Some nuclide nuclear data missing from FENDL 3.1b was taken from JEFF-3.2 [12].
For this analysis the complete detailed models of the TLDs, activation foils, holders and containers were produced and
2The MCNP model is rotated 90°clockwise relative to true North.
incorporated into a single JET MCNP model for the first time. Up to now, two different approaches had been implemented: either a one-step MCNP calculations without detailed detector models (CCFE) or two-step MCNP calculations with detailed detector models (NCSRD). For this paper the lessons learned from previous analyses were used to produce effective variance reduction parameters using ADVANTG. Theoptimalvariance reduction parameters produced statistically relevant simulation results in volume averaged track-length estimator tallies posi-tioned in the actual detectors up to40 maway from the plasma
source.
As mentioned before, a hybrid two step workflow combin-ing the deterministic based code ADVANTG version 3.0.3. and stochastic transport code MCNP5 v. 1.6 was used for all calculations in this paper.
In the first step optimal variance reduction parameters were produced using the FENDL 3.1b based 47 neutron energy group library, a dedicated forward peaking quadrature set, 5th order of scattering cross section expansion and, most important, unique non-uniform Cartesian spatial meshes for each detector location. The spatial meshes ranged from a total of 1 million to about 5 million spatial voxels. These input parameters were used by ADVANTG to execute Denovo and produce an approximate importance (adjoint) function using Denovo. The importance function was then used to produce weight window and source biasing VR parameters for each detector (TLD or activation foil) using the CADIS methodology described in Sec. II-D.
Using the VR parameters produced in the first step, the second step MCNP calculations were performed for each detector. The computational results for the DD plasma source are presented and compared to experimental results in Sec. V-A. Preliminary results for the two other plasma sources (TT and DTE2) are presented in Sec. V-B in preparation for the analysis of the TT and DT campaigns currently underway at JET.
V. RESULTS
Two sets of results corresponding to the two different detectors (TLDs and activation foils) are presented in this section. The computational results are presented and compared to the 2016 DD experimental campaign in Sec. V-A. Because of the delays in the TT and DT campaigns only pre-analysis calculation results for the TLDs are presented in Sec. V-B. These calculation results are also compared to the DD results. Such a comparison is beneficial for future experimental con-figurations.
A. Analysis of DD benchmark experiment
All activation foils and TLDs in positions A1-A4, B2, B3, and B5 were irradiated with a total of 3.52 · 1018 neutrons. The other TLDs were irradiated up to 6.18·1018. In the case of the TLDs, both the experimental and calculation fluence results were normalized to per source particle. Only the 1σ
statistical uncertainty of the second step Monte Carlo calcu-lation is included in the uncertainty of the calcucalcu-lation. The
Fig. 2. Southwest labyrinth and southeast chimney (left). TLD and activation foil container locations in the JET tokamak hall (right).
final total experimental uncertainty includes contributions from the uncertainty of: the calibration of TLDs, the actual TLD measurements, neutron yield and the background radiation measurement. Calculation/Experiment (C/E) values, reported in Tab. I, range from about 0.6 for the detector locations closest to the plasma to about 12 for the farthest location at the bottom of the chimney in the basement of the tokamak. The C/E uncertainty is the root sum of the square of experimental and calculation relative uncertainties. These results are slightly better compared to the C/E values calculated using simplified TLD containers mentioned in Sec. IV. One can also observe that the major part of the uncertainty comes from the exper-imental part, while the statistical uncertainty of the MCNP calculations is low because of efficient ADVANTG produced VR parameters. Calculations and experiments at the farthest positions are extremely difficult and the calculated C/E values are encouraging.
In Tab. II the activation foil results are compared against calculations in terms of reaction rates (RR). The IRDFF [13] activation libraries were used to calculate the activities of the activation foils using volume integrated tally estimators (F4 tally) and tally multiplication cards (FM card) implemented in MCNP. As it can be observed, C/E ratios range from about 0.5 to about 14.5 while, in most positions, the ratios corresponding to cadmium-covered foils are closer to one than those derived by bare foils. The C/E uncertainty is, as in the previous table, the root sum of the square of experimental and calculation relative uncertainties, where the calculation uncertainty is only the 1σstatistical uncertainty of the second step Monte Carlo calculation. The experimental uncertainty of the activation foils was calculated by combining all identified sources of error, namely the counting statistics, detector efficiency and nuclear data (uncertainties related to isotope half-lives and gamma-ray emission probabilities). Among these parameters, the statistical uncertainty of the gamma-ray measurements,
TABLE I
COMPARISON OFTLDCALCULATIONS AND EXPERIMENTAL RESULTS FOR THEDDPLASMA SOURCE.
DD [1/cmExperiment2/src. particle] [1/cmCalculation2/src. particle] ExperimentCalculation
Location Fluence Unc.Rel. Fluence Unc.Rel. C/E Unc.Rel.
A1 4.07E-09 0.17 2.34E-09 0.02 0.58 0.17
A8 1.02E-09 0.16 1.25E-09 0.06 1.22 0.17
A2 1.97E-10 0.17 4.18E-10 0.02 2.12 0.17
A3 2.03E-10 0.17 4.11E-10 0.01 2.02 0.17
A4 7.04E-11 0.18 1.88E-10 0.02 2.67 0.18
A5 3.98E-12 0.17 1.20E-11 0.02 3.01 0.17
A6 2.29E-13 0.25 1.34E-12 0.01 5.85 0.25
A7 2.29E-14 1.59 2.34E-09 0.02 5.20 1.59
B1 6.38E-09 0.16 1.09E-08 0.02 1.72 0.16
B2 8.40E-11 0.17 2.26E-10 0.02 2.68 0.18
B3 1.55E-10 0.17 3.25E-10 0.03 2.10 0.17
B4 1.29E-10 0.16 2.77E-10 0.03 2.15 0.17
B6 7.42E-13 0.20 4.85E-12 0.03 6.54 0.20
B7 5.65E-15 6.30 6.90E-14 0.02 12.20 6.30
which varied from5 % to approximately40 %, had the major
contribution to the combined uncertainty.
TABLE II
COMPARISON OF CALCULATED AND EXPERIMENTAL REACTIONS RATES(RR)OF THE ACTIVATION FOILS FOR THEDDPLASMA SOURCE.
DD Experiment [s-1] Calculation [s-1] Calculation/Experiment
Nuclide Location Reaction Rate Relative Uncertainty Reaction Rate Relative Uncertainty C/E Relative Uncertainty
109Ag (n, )110mAg A1 7.58E+03 0.11 1.99E+04 0.02 2.62 0.11
A1+Cd 1.36E+03 0.17 1.73E+03 0.02 1.27 0.17
59Co (n, )60Co
A1 3.80E+05 0.10 4.03E+05 0.02 1.06 0.11
A1+Cd 5.21E+04 0.11 2.50E+04 0.02 0.45 0.11
A2 1.36E+04 0.12 8.24E+04 0.02 6.07 0.12
A2+Cd 2.48E+03 0.19 4.91E+03 0.05 1.98 0.19
A4 7.02E+03 0.12 3.91E+04 0.02 5.58 0.12
A4+Cd 1.22E+03 0.26 2.40E+03 0.02 1.97 0.26
B3 1.66E+04 0.11 8.72E+04 0.03 5.25 0.12
B3+Cd 7.67E+03 0.22 6.09E+03 0.04 0.79 0.23
B5 5.54E+03 0.14 9.08E+03 0.02 1.64 0.14
B5+Cd 1.00E+03 0.34 4.77E+02 0.03 0.48 0.34
181Ta (n, )182Ta
A1 1.58E+05 0.10 1.65E+05 0.02 1.04 0.10
A1+Cd 3.22E+04 0.11 1.68E+04 0.02 0.52 0.11
A2 5.19E+03 0.13 3.49E+04 0.02 6.73 0.13
A2+Cd 1.54E+03 0.20 3.40E+03 0.05 2.21 0.21
A4 1.82E+03 0.14 1.77E+04 0.02 14.48 0.14
A4+Cd 5.07E+02 0.27 1.45E+03 0.02 2.86 0.27
B3 3.99E+03 0.12 2.96E+04 0.03 7.42 0.12
B3+Cd 4.21E+02 0.18 3.06E+03 0.03 7.27 0.18
B5 1.67E+03 0.16 3.64E+03 0.02 2.18 0.16
B5+Cd 3.79E+02 0.48 2.67E+02 0.03 0.71 0.48
building to calculate the reaction rates [14]. Nevertheless, the single calculation approach presented here enables a more accurate representation of the studied geometry and thus is able to provide lower uncertainties in the calculated data. The source of the observed discrepancies will be investigated further in the upcoming TT and DTE2 campaigns.
B. Pre-analysis for TT and DTE2 campaign
In preparation for the TT and DTE2 plasma campaigns at JET in 2019/2020 we performed a preliminary simulation of the TLDs at the same experimental positions but with different energy source spectra - the TT and DT source spectrum. The ADVANTG calculations had to be repeated and refined be-cause of the change in the energy spectrum. The results shown in Tab. III predict that the neutron fluence per source neutron measured by the TLDs during the TT campaign will be similar to those recorded during the DD campaign. On the other hand the neutron fluences per source neutron during the DT camping will be, on average, about20 %higher than the DD campaign.
The C/C uncertainty in the last column is the root sum of the square of relative uncertainties given in columns 3 and 5 which represent the 1σstatistical uncertainty of the volume integrated
track length estimator tallies (F4 tallies). During the upcoming TT experiment 5.04·1019 TT and 1.04·1020 DT neutrons (due to 1 % Deuterium) will be produced and during the following DTE2 experiment the maximum DT yield will be 1.53·1021 of DT neutrons and 3.06·1019 of TT neutrons [15]. Tab. IV reports the the total neutron fluences predicted in TLDs during TT and DTE2 campaigns considering the expected level of irradiation in future experiments3. The relative uncertainties given in columns 3 and 5 are the root sum of the square of uncertainties from contributions of TT and DT sources.
3The neutrons from DD reactions were disregarded in these predictions.
TABLE III
COMPARISON OFTLDCALCULATIONS FORDD, TTANDDTPLASMA SOURCES.
TT Calculation
[1/cm2/src. particle] [1/cmDT Calculation2/src. particle] DD/TT DD/DT
Location Fluence Unc.Rel. Fluence Unc.Rel. CCDD/
TT
CDD/
CDT
A1 2.30E-09 0.01 3.28E-09 0.02 1.02 0.71
A8 1.21E-09 0.02 1.71E-09 0.04 1.03 0.73
A2 4.37E-10 0.07 5.58E-10 0.02 0.96 0.75
A3 4.06E-10 0.03 5.53E-10 0.02 1.01 0.74
A4 1.90E-10 0.01 2.60E-10 0.03 0.99 0.72
A5 1.23E-11 0.03 1.59E-11 0.01 0.97 0.75
A6 1.28E-12 0.02 1.64E-12 0.02 1.05 0.82
A7 1.16E-13 0.02 1.53E-13 0.03 1.03 0.78
B1 9.30E-09 0.02 1.15E-08 0.03 0.98 0.79
B2 2.27E-10 0.02 2.90E-10 0.03 0.99 0.78
B3 3.38E-10 0.03 4.06E-10 0.04 0.96 0.80
B4 2.64E-10 0.04 3.45E-10 0.02 1.05 0.80
B6 5.27E-12 0.04 5.99E-12 0.04 0.92 0.81
B7 6.46E-14 0.02 8.53E-14 0.05 1.07 0.81
VI. CONCLUSION
In this paper we presented a post-analysis of the DD neutron streaming experiments performed in 2016 and a pre-analysis of the upcoming TT and DT campaigns using ADVANTG. ADVANTG was used to prepare efficient variance reduction parameters for Monte Carlo MCNP calculations of difficult streaming problems in complex realistic tokamak geometries. The agreement between the calculation and experimental results for the TLDs ranges from 0.6 close to the plasma to 12 more than 40 m away from the plasma source. The
C/E values slightly improved compared to previous analyses because detailed models of the TLD holders and containers were used. Considering the complexity of the problem, model
TABLE IV
PREDICTION OF TOTAL NEUTRON FLUENCE ATTLDLOCATIONS FOR THE UPCOMINGTTANDDTE2CAMPAIGNS.
TT campaign DTE2 campaign
Location Fluence [1/cm2] Rel. Unc. Fluence [1/cm2] Rel. Unc.
A1 4.58E+11 0.01 5.09E+12 0.02
A8 2.39E+11 0.03 2.66E+12 0.04
A2 8.01E+10 0.02 8.67E+11 0.02
A3 7.80E+10 0.02 8.59E+11 0.02
A4 3.67E+10 0.02 4.04E+11 0.03
A5 2.28E+09 0.01 2.47E+10 0.01
A6 2.35E+08 0.01 2.55E+09 0.02
A7 2.17E+07 0.02 2.37E+08 0.03
B1 1.67E+12 0.02 1.79E+13 0.03
B2 4.16E+10 0.02 4.51E+11 0.03
B3 5.93E+10 0.03 6.32E+11 0.04
B4 4.92E+10 0.02 5.36E+11 0.02
B6 8.88E+08 0.03 9.32E+09 0.04
B7 1.21E+07 0.03 1.33E+08 0.05
simplifications and potential uncertainty because of nuclear data uncertainty propagation this is a very encouraging results. For the first time, activation foil reaction rate measurements were also analyzed using this hybrid ADVANTG/MCNP methodology. The C/E results are not as good as with TLDs but, these are promising preliminary results which need to be analyzed further in the upcoming TT and DTE2 campaigns at JET planed for 2019/2020.
To prepare for the upcoming experimental campaigns a pre-analysis using different (TT and DT) source spectra was performed. The results show that one can expect similar levels of neutron fluence per source particle measured by the TLDs during the TT campaign and on average a 20 %
increase of the fluence per source particle during the DT campaign. Total neutron fluences for the upcoming TT and DTE2 campaigns determined using expected neutron yields were also calculated. The expected neutron fluence during the TT campaign ranges from 1.67⇥1012n/cm2 at location B1 to 1.21⇥107n/cm2 at location B7. On the other hand the expected neutron fluence during the DTE2 campaign is expected to range from 1.79⇥1013n/cm2 at location B1 to
1.33⇥108n/cm2 at location B7.
ADVANTG has proven to be a reliable tool for analyzing complex fusion streaming problems and reducing the statistical uncertainty of the second-step Monte Carlo calculation. But one has to acknowledge other uncertainties in such a complex simulation, i.e. model simplification and uncertainties because of nuclear data. In the future we plan to investigate the uncertainties due to nuclear data using a newly developed capability of the Sensitivity/Uncertainty code SUSD3D [16], [17].
ACKNOWLEDGMENT
This work has been carried out within the framework of the EUROfusion Consortium and has received funding from the Euratom research and training program 2014–2018 and 2019-2020 under grant agreement No 633053. The views and
opinions expressed herein do not necessarily reflect those of the European Commission.
The authors also acknowledge the financial support from the Slovenian Research Agency (research core funding No. P2-0073 and project for training young researchers No. 1000-15-0106).
REFERENCES
[1] P. Batistoni, S. Conroy, B. Obryk, S. Popovichev, I. Stamatelatos, B. Syme. and T. Vasilopoulou and JET Contributors 2015, ”Benchmark experiments on neutron streaming through JET Torus Hall penetrations”, Nucl. Fusion 55 053028.
[2] R. Villari, P. Batistoni, J.P. Catalan, B. Colling, D. Croft, U. Fischer, D. Flammini, N. Fonnesu, L. Jones, A. Klix, B. Kos, M. Kłosowski, I. Kodeli, S. Loreti, F. Moro, J. Naish, B. Obryk, L. Packer, P. Pereslavtsev, R. Pilotti, S. Popovichev, P. Sauvan, I.E. Stamatelatos, T. Vasilopoulou and JET Contributors, ”ITER oriented neutronics benchmark experi-ments on neutron streaming and shutdown dose rate at JET”, Fus. Eng. Des., 123, pp 171-176, 2017.
[3] S. W. Mosher, S. R. Johnson, A. M. Bevill, A. M. Ibrahim, C. R. Daily, T. M. Evans, J. C. Wagner, J. O. Johnson, and R. E. Grove, ”ADVANTG—An automated variance reduction parameter generator”, ORNL/TM-2013/416 Rev. 1, Oak Ridge National Laboratory, Oak Ridge, TN, 2015.
[4] X-5 MONTE CARLO TEAM, ”MCNP – A general Monte Carlo N-particle transport code, Version 5 – Volume I: Overview and theory”, LA-UR-03-1987, Los Alamos National Laboratory, Apr. 2003, revised Feb. 2008.
[5] T. M. Evans, A. S. Stafford, R. N. Slaybaugh, K. T. Clarno, ”Denovo: A new three-dimensional parallel discrete ordinates code in SCALE”, Nuclear Technology, vol. 171, pp. 171–200, 2010.
[6] J.C. Wagner, A. Haghighat, ”Automated variance reduction of Monte Carlo shielding calculations using the discrete ordinates adjoint func-tion”, Nuclear Science and Engineering, 128, 186, 1998.
[7] J. C. Wagner, D. E. Peplow, and S. W. Mosher, ”FW-CADIS method for global and semi-global variance reduction of Monte Carlo radiation transport calculations”, Nuclear Science and Engineering, 176, 37-572014.
[8] B. Obryk, R. Villari, P. Batistoni, A. Colangeli, P. De Felice, N. Fonnesu, M. Kłosowski, S. Loreti, K. Malik, J. Nash, M. Pillon, M. Pimpinella, L. Quintieri and JET Contributors, ”TLD calibration for neutron fluence measurements at JET fusion facility”, Nuclear Inst. and Methods in Physics Research, A 904, 202–213, 2018.
[9] T. Vasilopoulou, I. E. Stamatelatos, P. Batistoni, A. Colangeli, D. Flammini, N. Fonnesu, S. Loreti and JET Contributors, “Improved Neutron Activation Dosimetry for Fusion.” Fusion Engineering and Design 139: 109–114, 2019.
[10] I. Lengar, A. ˇCufar, V. Radulovi´c, P. Batistoni, S. Popovichev, L. Packer, Z. Ghani, I. A. Kodeli, S. Conroy, L. Snoj and JET contributors, “Activation Material Selection for Multiple Foil Activation Detectors in JET TT campaign”, Fusion Engineering and Design (2018) in press. [11] A. Koning, A. Trkov, ”FENDL-3.1b: Fusion Evaluated Nuclear Data
Library Ver.3.1b”, https://www-nds.iaea.org/fendl/.
[12] OECD/NEA, ”The JEFF-3.2 Nuclear Data Library”, NEA Data Bank, Available at https://www.oecd-nea.org/dbforms/data/eva/evatapes/je 32/, 2014.
[13] R. Capote, K.I. Zolotarev, V.G. Pronyaev, and A. Trkov, ”Updating and Extending the IRDF-2002 Dosimetry Library” J. ASTM International, Volume 9, Issue 4, 2012.
[14] T. Vasilopoulou, I. E. Stamatelatos, P. Batistoni, N, Fonnesu, R. Villari, J. Naish, S. Popovichev, B. Obryk and JET Contributors, “Activation foil measurements at JET in preparation for D-T plasma operation” Fusion Engineering and Design, In-Press, 2018.
[15] R. Villari and G. Sips, personal communication.
[16] B. Kos, I. A. Kodeli, ”Coupling of the SUSD3D S/U Code with the Denovo Deterministic Transport Solver”, Proceedings, 27th International Conference Nuclear Energy for New Europe - NENE 2018, Portoroˇz, Slovenia, 2018.