© 2017, IJCSMC All Rights Reserved
48
Available Online atwww.ijcsmc.comInternational Journal of Computer Science and Mobile Computing
A Monthly Journal of Computer Science and Information Technology
ISSN 2320–088X
IMPACT FACTOR: 6.017
IJCSMC, Vol. 6, Issue. 6, June 2017, pg.48 – 56
A Classification Approach for Predicting Plant
Leaf Diseases in Digital Image Processing
Rupa M
1, Pathur Nisha S
2, Geetha A
3, Shanthi P
4¹PG student, Computer Science and Engineering, Nehru Institute of Technology, Coimbatore, India
²Professor, 3Associate Professor, Computer Science and Engineering, Nehru Institute of Technology, Coimbatore, India
4
Asst. Prof / MCA/ Sri Krishna College of Engineering & Tech, Coimbatore, India
1
[email protected]; 2 [email protected]; 3 [email protected]
Abstract-- In agriculture, detection and diagnosis of plant disease using digital image processing techniques focused on accurate segmentation of healthy and diseased tissue. Among various segmentation methods, the most widely used semi-automatic segmentation is based on gray scale histogram. In a novel semi-semi-automatic segmentation process, the edges were removed along with pixels and then color conversion was done. After color conversion, pixel value adjustments and contrast enhancement of an image were performed to improve the image quality. Histogram with 100 bins was constructed for recognizing the diseased tissue from the healthier part of a leaf image. At last, segmentation of diseased leaf was found based on the histogram bins. Such bins were found manually which is not easy for all cases. Moreover, detection accuracy was reduced the quality by the influence of reflection light and distortion regions in an acquired image. Hence reflection light and distortion from image were removed using Quality Assessment Method Scheme (QAMS) algorithm. For automatic separation of diseased part from the healthier regions in a leaf image an optimization algorithm is required. To automatically define the histogram bins and separate diseased part from the healthier regions in a leaf image the Convolutional Neural Networks (CNN) algorithm used. After segmenting the diseased leaf image, the classification is done by Support Vector Machine (SVM) to detect the leaf diseases. The method provides better detection accuracy and computational time is reduced.
Keywords-- CNN, Diseases detection, Distortion removal, Reflection light, SVM.
I.INTRODUCTION
griculture is the primary backbone of Indian economy. Image processing has wide range of applications in the agricultural field for the following purposes, prediction of plant disease from plant image and prediction of pest attacks from plant image.
The detection and classification of plant diseases helps Plant productivity. Image segmentation techniques provide accurate segmentation of leaf images as diseased and healthy tissue. There are different methods developed for detecting plant disease such as thresholding, region growing, clustering, and Edge based detection. For detection process, the image should take some process like pre-processing, segmentation, feature extraction and classification processes.
Image pre-processing is the important step to remove unnecessary information and noises from the input image. This step will improve the image quality.
© 2017, IJCSMC All Rights Reserved
49
Segmentation procedures partition an image into its constituent parts or objects. In common, autonomous segmentation is one of the most difficult tasks in digital image processing. A rugged segmentation procedure brings the process a long way toward successful solution of imaging problems that require objects to be identified individually.
Segmentation is the process dividing an image into regions with similar properties such as gray level, color, texture, brightness, and contrast.
For segmentation of disease symptoms, color space should be appropriately chosen. There is various color spaces used for image analysis. But most of the color space methods use HSV (Hue-Saturation-Value)or L*a*b* (Lightness and two channels) representing opposing color dimensions in color channels. After the color space conversion, only one channel from both color spaces is used for segmentation. Segmentation is then proceeds by employing segmentation methods after channel selection. Based on the threshold values, the healthy and diseased tissue is identified.
A. Plant Leaf Diseases
Plant leaf diseases identification in agriculture has many applications, and is especially significant to the biology diversity research. Classifying plant leaf finds application in botany and other industries. The surrounding protection is important for plants. Shape is one of the most important features for characterizing various plants leaves visually. Plant leaves have two-shapes in nature. The paper presents survey of different leaf diseases identification. The plant leaf diseases are broadly classified into bacterial, viral, fungal.
B. Histogram
A histogram is a pictorial representation of the distribution of numerical data. It is continuous variable of the (probability distribution) quantitative variable. The first step to construct histogram is “bin” values and, the entire ranges of values is dividing into a series of time—and then count how many values fall into each time period. The bins are specified as continuous, does not overlap period of a variable. The intervals must be close, and bins (but are not required to be) of equal size.
C. Classification
This classification process is used to classify all pixels in a image into one or more classes. There are two main classification methods, they are: Supervised classification and Unsupervised Classification.
Unsupervised classification is a large number of unknown pixels and divides into a number of classed based on natural groupings present in the image values. While in supervised classification, the image is classified by examining the reflectance for each pixel and making a decision about which of the signatures it resembles most.
II. RELATED WORKS
Reflection and distortion separation in image is difficult task. The problem of this reflection and distortion separation arises naturally in our everyday life when a desired action contains another actions reflected off a glass panel or semi reflective medium. A common example for this is when we see picture through transparent glass or taking the picture of an object which are placed inside a glass. Reflection appeared in images sometimes the camera may be shake when we take photographs so the image will be distorted or blurred. Distortion will happen either the properties of the camera lens or position relative to the object. One of the distortions is caused when the camera is keen at an extreme angle to the subject. The problem of removing reflection and distortion from un-natural images [5]. This will effect in the nature of images. Reflection occurred when there is the change in position of a wave front at an interface between two different media are glass and water so that the wave front change into the medium from which it originated. The law of reflection describes for specular reflection is mirror like reflection of light from a surface.
A picture made using a camera distortion will appear when either the properties of the camera lens or the position. Here the input contains multiple polarized images with different polarizer angles [1]. The output consists of high standard image which is removed distortion and reflection separation method. In this paper proposed a Quality Assessment method Scheme (QAMS) is used for removing picture reflection and distortion. Using this QAMS method, the quality of image can be increased by measuring PSNR and Error Rate. The another distortion type is inside a lens there is a round glass element, with the side effect of this type of glasses occurs barrel distortion. Due to the effect of angle light more near to the edges of the lens then it is near the center of the lens. When the lens center point is smaller it will get more extreme effect of barrel Distortion. The image with reflection can be described by a linear superposition of two forms: the reflection layer from the action reflected by the glass and the background layer from the action beyond the glass.
© 2017, IJCSMC All Rights Reserved
50
A Convolutional Neural Network (CNN) is a stack of non-linear transformation functions that are learned from data. The success of modern CNNs relies on several factors that include: availability of large datasets, more computing power and new ideas and algorithms. Nowadays the concept of deep architecture is to make CNNs a powerful tool for image recognition. A deep CNN has multiple layers that progressively compute features from input images. There are mainly two types of layers in this network: convolutional layers and fully connected layers. Convolutional layers may be understood as banks of filters that transform an input image into another image, highlighting specific patterns. On the other hand, fully connected layers take a vector as input and produce another vector as output.
Fine-tuning a network is a procedure based on the concept of transfer learning .The start training a CNN to learn features for a broad domain with a classification function targeted at minimizing error in that domain. Then, replace the classification function and optimize the network again to minimize error in another, more specific domain.
III. EXISTING SYSTEM
In the existing work first the images were collected from the collection of related sets. Destruction was applied to remove the pixels present in the leaves edges. The standard image was then transformed into HSV and L*a*b* color spaces. The earlier system considered H and a channel from both color spaces. Brightest pixels in H channels were then corrected. After the brightest pixel correction, the contrast of the grayscale images was enhanced by using original and new values of the pixels. Histogram of both H and a channel was constructed using 100-bin histogram.
The pixel value to segregate healthy and diseased tissue should be found for segmentation using histogram bins. Then the bins are found by manual identification. When the global maximum is located in smaller value bins, it indicates that the leaf is severely diseased. On the other hand, if the global maximum is located in large value bins, this indicates that the leaf is still relatively healthy, with green controls the histogram. Finally, user choose images (that obtained for channel H or a, respectively) that provides the most accurate segmentation.
IV. PROPOSED SYSTEM
To detect and classify the plant leaf diseases first the images were collected from the collection of related set. The pixels that are located along the edges of the leaves are removed by performing erosion using a 5-pixel diameter disk as the structuring element. Reflection happens when there is the variation in direction of a wave front at action between two different media so that is originated from the wave front returns into the medium. Distortion will happens when either the position of the camera relative to the object or properties of the lens. Reflection and distortion light on images is removed by using Quality Assessment method Scheme (QAMS). Reflection and distortion light in the image removes it using reflection separation and distortion separation algorithm. The standard image was then transformed into HSV and L*a*b* color spaces. The system considered H and a channels from both color spaces. Brightest pixels in channels were then corrected.
After the correction of brightest pixel, contrast enhancement of the image was performed to improve the image quality. In existing system histogram of both H and a channels was constructed using 100-bin histogram [1]. The pixel value to segregate healthy and diseased tissue should be found for segmentation using histogram bins. The identification of bin is used to represent values of healthy (green) pixels in each image, considering that healthy tissue tends to be represented as a light shade of gray in the grayscale images. Convolutional Neural Networks (CNNs) is used instead of manual identification of histogram bins. It is a feed-forward and artificial neural network and it is based on biological processes. This network estimate features from input images. CNN is trained to learn features for large amount of datasets with classification function focused to reduce error. After the application of CNN, diseased regions are automatically segmented from the normal regions. Then best segmentation image is chosen from either of the channels. SVM classifier is used to detect diseases in image.
Algorithm 1: Reflection separation
Input: Image 1 to Image N
Output: reflection removed image Construct the Gaussian image pyramid.
For each level, from coarse to fine, in the multi-scale pyramid
Compute the mask image and the reflection guide map. If the current scale is the coarsest scale,
Initialize αi else:
Up-sample the results of αi, R and B.
Evaluate the regularization weights λαi , λR and λB. end if
© 2017, IJCSMC All Rights Reserved
51
Estimate (R, B) with αi fixed. Estimate αi with (R, B) fixed. end for
end for
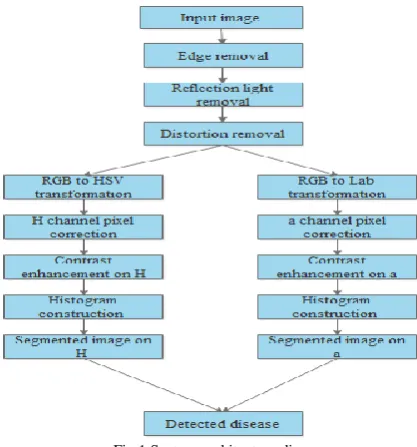
Fig 1.System architecture diagram
Each input image is down-sampled for constructing Gaussian image pyramid. For each scale, the mask image and reflection guide map are constructed and non-convex energy function is reduced by solving reflection and background layer problems. For each level, QAMS starts at the coarsest scale and goes down scale by scale toward the finest scale of the pyramid. Then if the current scale of the image is coarsest scale, amount of reflection remaining in the image is initialized and they are up-sampled along with values of reflection and background of the image. Regularization weights of obtained values are calculated. This will proceed for each level. Then obtained refined values are updated in reflection guide map.
Algorithm 2: Distortion separation
Input: Image
Output: High quality image
Construct the Gaussian image Pyramid While(step>minstep)
{ Calculate_error_at (K-step) Calculate_error_at (K+step) Calculate_error_at (K) If(K is smallest) Step:=step/4; else
If(K-step was better) k:=K-step
else K:=K+step
Constructing Gaussian image pyramid .Then algorithm for distortion tries to calculate two main parameters of the distortion K1 and K2. It is based on an extremely simple search loop finding one parameter (k) at a time is either k1 or k2.
Steps involved in CNN
1. Input the image in the CNN
2. Obtain Color patch number and histogram bins from the input image and fed to CNN
3. Sub sampling layer of CNN produces the detecting results by combining different number of histogram bins from 10 to 100 along with different color patches
© 2017, IJCSMC All Rights Reserved
52
5. Accuracy for each and every combination of histogram bins and color patches are learned by CNN from the detection result obtained from every iteration
6. After training the CNN, test image is given as input to the trained CNN
7. From the learned information, CNN segments the diseased pixels from healthier pixels 8. Obtain the segmentedimage.
a. Edge removal
Edge detection and edge removal are the two primary steps in image processing. In this module, the pixels that are located along the edges of the leaves are removed by performing erosion using a 5-pixel diameter disk as the structuring element. The main purpose of removing these pixels is to avoid some inconsistencies that are occurred during image analysis. This edge removal process can cause be little impact on the detection accuracy of the final results because, some negligible amount of pixels with diseased symptoms are removed.
Fig 2.Edge removal
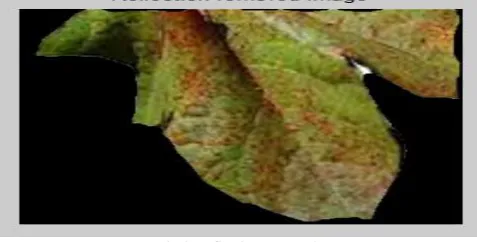
b. Reflection light removal using QAMS
Reflection separation is done by using the effect of reflection under different rotation angles of a polarizer. Each input image is down-sampled for constructing Gaussian image pyramid. For each scale, the mask image and reflection guide map are constructed and non-convex energy function is reduced by solving reflection and background layer problems. For each level, QAMS starts at the coarsest scale and goes down scale by scale toward the finest scale of the pyramid. Then if the current scale of the image is coarsest scale, amount of reflection remaining in the image is initialized and they are up-sampled along with values of reflection and background of the image. Regularization weights of obtained values are calculated. This will proceed for each level. Then obtained refined values are updated in reflection guide map.
Fig 3.Reflection removal
c. Distortion removal using QAMS
© 2017, IJCSMC All Rights Reserved
53
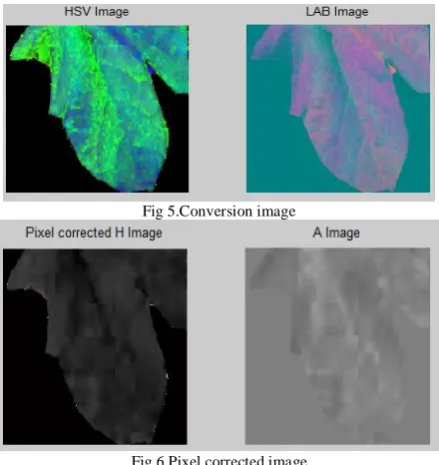
Fig 4.Distortion removald. Color Space Conversion
In general, Color Space Conversion coverts one basic form of color representation into another form. In this module, Red-Green-Blue (RGB) color space is transformed into two different transformations. One is Hue-Saturation-Value (HSV) color space and another one is Lightness and two channels (a and b) (L*a*b) color space transformation. From HSV and L*a*b color spaces, channel H from HSV and channel a from L*a*b are only considered for further process. After the transformation, 8-bit image format (pixel values varies from 0 t0 255) is changed into 16-bit double format with pixel values ranges from 0 to 1.
Fig 5.Conversion image
Fig 6.Pixel corrected image
e. Contrast enhancement
To improve the quality of contrast of the grayscale images use following equation. q i,j = (p i,j-min(p)/
max (p)-min (p) ). When this equation is applied on a channel of L*a*b color space, the intensity values of pixels are inverted to form 1- q i,j and the backgrounds of images obtained from H channel and a channel are set to 1.
Fig 7.Contrast enhancement
f. Histogram construction
© 2017, IJCSMC All Rights Reserved
54
are needed to identify the diseased pixels. Hence, in order to select the best represented typical pixel values. Convolutional Neural Networks (CNN) is introduced. CNN consists of convolutional layers and fully connected layers. Convolution layer contains banks of filters that convert an input image into another image while fully connected layers take a vector as input and produce another vector as output. CNN is trained for automatic selection of histogram bins. Color patches and histogram bins are used as input for CNN. Different number of histogram bins is taken like 10, 20, 30, 40... 100 with color patches are used for training the CNN.
g. Image segmentation
The segmentation was to find the value of pixels that separates healthy and diseased tissue. The diseased tissue tends to generate peaks towards the (left end of the histogram) lower value bins. The healthier the leaf as the more pronounced are the higher peaks. Due to differences in color, shades and illumination, the position of those peaks may vary substantially from sample to sample. CNN learned the accuracy and bin values of diseased and healthier leaf histograms and generated the class label. Then based on the color and bins of test image, diseased as well as healthier part of an image is automatically segmented and improves the detection accuracy.
Fig 8.Segmented image
h. Detecting diseases using SVM
After segmenting the diseased leaf image, the classification is done by Support Vector Machine (SVM) to detect the leaf diseases.
Fig 9. Detected disease name
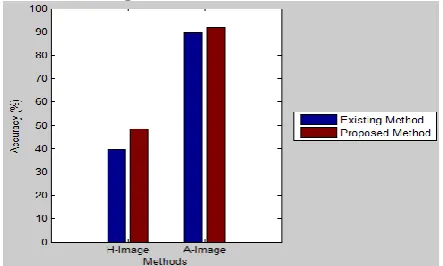
i. Performance analysis with experimental results
The diseased leaf images performance is analysed by using these four parameters, which is Accuracy, Precision, Recall and F-measure.
1) Accuracy
It is the proportion of the total number of predictions that were correct.
© 2017, IJCSMC All Rights Reserved
55
2) PrecisionIt is the proportion of the predicted positive cases that were correct.
Fig 11. Comparison in precision 3) Recall
It is the proportion of positive cases that were correct.
Fig 12. Comparison in Recall
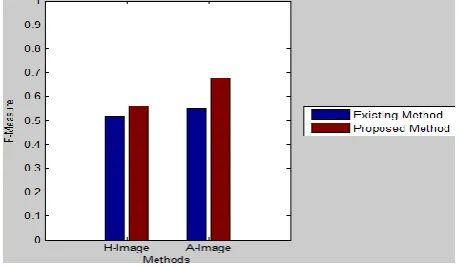
4) F-measure
It calculates the average of the information retrieval precision and recall metrics.
Fig 13. Comparison in F-measure
© 2017, IJCSMC All Rights Reserved
56
V. CONCLUSION
The Reflection light and distortion on images is removed by using Quality Assessment method Scheme (QAMS). In existing system, the specular light is used and the histogram bins is manually identified. The edge removal and reflection lights and distortion is removed using quality assessment method scheme is done .Then, the image is converted to color channels and pixel correction is applied. In future direction, the contrast enhancement is used the histogram bin is identified automatically by using CNN. After the application of CNN, diseased regions are automatically segmented from the normal regions. Then, the best segmentation image is chosen from either of the channels. A classification support vector machine (SVM) is used detect the disease in plant leaf image. The proposed system provides accurate segmentation of diseased leaves and it provides detection accuracy. The computation time will be reduced because of automatic identification of bins in histogram.
In future, this work will be extended to find the percentage of infection in accordance with the area affected, the risk level of disease present in the leaf will also be analysed.
REFERENCES
[1] Barbedo, J. G. A. (2016). A novel algorithm for semi-automatic segmentation of plant leaf disease symptoms using digital image
processing. Transactions on springer 10.1007.
[2] Jimita Baghel , Prashant Jain (2016). K-Means Segmentation Method for Automatic Leaf Disease Detection. Int. Journal of Engineering
Research and Application.
[3] Jundare Manisha. A., Jundare Pallavi T., Jundare Pragati V., Prof. C.S.Aryan (2016). Plant Disease Detection and its Treatment using
Image Processing, Int. Journal of Advanced Research in Electrical, Electronics and Instrumentation Engineering
[4] Dr. N. Sasirekha ,N. Swetha (2015). An Identification of Variety of Leaf Diseases Using Various Data Mining Techniques. Int. Journal
of Advanced Research in Computer and Communication Engineering.
[5] K. Muthukannan, P. Latha, R. Pon Selvi and P. Nisha (2015). Classification of diseased plant leaves using neural network algorithms.
ARPN Journal of Engineering and Applied Sciences.
[6] Barbedo, J. G. A. (2014). An automatic method to detect and measure leaf disease symptoms using digital image processing. Plant
Disease, 98(12), 1709-1716.
[7] Guijarro, M., Riomoros, I., Pajares, G., & Zitinski, P. (2015). Discrete wavelets transform for improving greenness image segmentation
in agricultural images. Computers and Electronics in Agriculture, 118, 396-407.
[8] Grand-Brochier, M., Vacavant, A., Cerutti, G., Bianchi, K., & Tougne, L. (2013, July). Comparative study of segmentation methods for
tree leaves extraction. In Proceedings of the International Workshop on Video and Image Ground Truth in Computer Vision Applications (p. 7). ACM.
[9] Manimurugan S, Asha Susan Prakash. (2012)A simple method for removing reflection and distortion from a single image. International
Journal of Engineering and Innovative Technology (IJEIT).
[10]Angie K. Reyes1, Juan C. Caicedo2, and Jorge E. Camargo (2015) Fine-tuning Deep Convolutional Networks for Plant Recognition.
Laboratory for Advanced Computational Science and Engineering Research,Universidad Antonio Nari~no, Colombia.
[11]Aakif, A., & Khan, M. F. (2015). Automatic classification of plants based on their leaves. Biosystems Engineering, 139, 66-75.
[12]Gao, R., & Wu, H. (2015). Agricultural image target segmentation based on fuzzy set. Optik-International Journal for Light and Electron
Optics, 126(24), 5320-5324.
[13]Larese, M. G., Namías, R., Craviotto, R. M., Arango, M. R., Gallo, C., & Granitto, P. M. (2014). Automatic classification of legumes using leaf vein image features. Pattern Recognition, 47(1), 158-168.
[14]Zhou, R., Kaneko, S. I., Tanaka, F., Kayamori, M., & Shimizu, M. (2014). Disease detection of Cercospora Leaf Spot in sugar beet by
robust template matching. Computers and Electronics in Agriculture, 108, 58-70.
[15]Wang, J., He, J., Han, Y., Ouyang, C., & Li, D. (2013). An adaptive thresholding algorithm of field leaf image. Computers and
electronics in agriculture, 96, 23-39.
[16]Du, J. X., Zhai, C. M., & Wang, Q.P. (2013). Recognition of plant leaf image based on fractal dimension features. Neurocomputing, 116,
150-156.
[17]Solahudin, M., Pramudya, B., & Manaf, R. (2015). Gemini virus attack analysis in field of chili (Capsicum annuum L.) using aerial photography and Bayesian segmentation method. Procedia Environmental Sciences, 24,254-257.
[18]Xia, C., Lee, J. M., Li, Y., Song, Y. H., Chung, B. K., & Chon, T. S. (2013). Plant leaf detection using modified active shape models. Biosystems engineering, 116(1), 23-35.
[19]Kruse, O.M.O., Prats-Montalban, J. M., Indahl, U. G., Kvaal, K., Ferrer,A., & Futsaether, C. M. (2014). Pixel classification methods for
identifying and quantifying leaf surface injury from digital images. Computers and electronics in Agriculture, 108
[20]De Coninck, B. M. A., Amand, O., Delauré, S. L., Lucas, S., Hias, N., Weyens, G., & Cammue, B. P. A. (2012). The use of digital image
analysis and real‐time PCR fine‐tunes bioassays for quantification of Cercospora leaf spot disease in sugar beet breeding. Plant
pathology, 61(1), 76-84.