www.ijiset.com
61
Transient Stability Analysis with SVC and
STATCOM for Four Machine Two Area Test
System with and without PSS using
Matlab/Simulink
G. B. JadhavP
1
P
, Dr. C. B. BangalP
2
P
, Dr. Sanjeet KanungoP
3
P
1
P
Ph.D. Scholar, Dr.Babasaheb Ambedkar Marathwada University, Aurangabad, Maharashtra.
P
2
P
Professor & Principal, RMD, Shinhgad School of Engineering, Pune, Maharashtra.
P
3
P
Professor & Program Chair Marine Engineering, Tolani Maritme Institute, Pune, Maharashtra.
Abstract : The objective of this paper is to analyze the performance of a static var compensator and static synchronous compensator with and without power system stabilizer(PSS). To illustrate the performance of the FACTS(Flexible AC Transmission systems) controller SVC and STATCOM with and without PSS, IEEE two area 11 Bus Multi-Machine power System has been considered. The designed system tested using matlab simulink software and result was compared. The simulation was run for 20 seconds. Time domain simulation method is implemented in this paper. STATCOM showed better improvement in transient stability compare with SVC. The performance was also compared with GPSS(Generic Power system Stabilizer) and MBPSS Multiband Power System Stabilizer) to see the effect of further oscillationscreated during and after fault in the system with SVC and STATCOM. The MBPSS showed better effect than GPSS to damp the further oscillations created in the system during and after fault with SVC and STATCOM.
Keywords : Transient Stability, SVC, STATCOM, GPSS, MBPSS, Matlab/Simulink
1. Introduction:
The power demand depends on load demand. If active power demand increases then speed of generators drop down and frequency of EMF decreases. If the reactive power demand increases then speed does not get affected but it is the magnitude of voltage which decreases. Thus load demand can make generators unstable. If load changes are small and stability is maintained, it is called as steady state stability. If load changes are large and sudden, still stability is maintained, it is
transient stability. Stability must be maintained under any circumstances to have uninterrupted power supply. Stability is the response of the Synchronous Generator, supplying power to the external network following a disturbance. Under steady operation, it runs at Synchronous speed and when there is a perturbation, small or large, then machine tends to swing. It may either get restored to its original state or new state or fall out of step. Thus, transient stability is defined as the ability of the power system to maintain synchronism when subjected to a severe transient disturbance, such as a fault on transmission facilities, sudden loss of generation, or loss of a large load. The resulting system response involves large excursions of generator rotor angles and is influenced by the nonlinear power-angle relationship. Transient stability depends on both the initial operating state of the system and the severity of the disturbance. The transient stability can further be divided into two classes i) First-Swing Stability: for first one second after a system fault (simple generator model & no control model). ii) Multi Swing Stability: system analysis over long period of time (more sophisticated machine model) [1,2].
www.ijiset.com
62
lines. In this paper SVC and STATCOM phasor typemodels are used for study [3,4].
Due to excitation and system parameter combinations under certain loading conditions can introduce negative damping into the system. In order to offset this effect and to improve system damping in general, artificial means of producing torques in phase with the speed are introduced. These are called supplementary stabilizing signals and the networks used to generate these signals are known as power system stabilizers [2].
Power System Stabilizer (PSS) is a feedback controller, for a synchronous generator which provides an additional stabilizing signal to Automatic Voltage Regulator (AVR) through voltage reference input in order to damp out Low Frequency Oscillations (LFO). The purpose of PSS is to damp out the generator rotor oscillation in the range of 0.1 to 3 Hz. To damp out the electromechanical oscillations, PSS is expected to produce an electrical torque components should be in phase with rotor speed deviation of the generator. There are two types of stabilizer (i) Generic power system stabilizer model using the acceleration power (Pa= difference between mechanical power Pm and output electrical power Peo) and a (ii) Multi-band power system stabilizer using the speed deviation (dw) [17,23].
2. Power System Stablizer (PSS) Models 2.1. Generic Power System Stabilizer
The Generic Power System Stabilizer (PSS) block can be used to add damping to the rotor oscillations of the synchronous machine by controlling its excitation. The disturbances occurring in a power system induce electromechanical oscillations of the electrical generators. These oscillations, also called power swings, must be effectively damped to maintain the system stability. The output signal of the PSS is used as an additional input (vstab) to the Excitation System block. The PSS input signal can be either the machine speed deviation, dw, or its acceleration power, Pa = Pm - Peo (difference between the mechanical power and the electrical power). The Generic Power System Stabilizer is modeled by the following nonlinear system:
Figure 1. The Block Diagram of the Generic Power System Stabilizer
Figure 1 shows the block diagram of the generic power system stabilizer (PSS), which can be modeled by using the following transfer function:
G(s) = K *[ (TR1nR.S + 1)(TR2n.RS +1) /
(TR1d.RS+1)(TR2d.RS+1)]
(1)
To ensure a robust damping, the PSS should provide a moderate phase advance at frequencies of interest in order to compensate for the inherent lag between the field excitation and the electrical torque induced by the PSS action. The model consists of a low-pass filter, a general gain, a washout high-pass filter, a phase-compensation system, and an output limiter. The general gain K determines the amount of damping produced by the stabilizer.
The washout high-pass filter eliminates low frequencies that are present in the dw signal and allows the PSS to respond only to speed changes. The phase-compensation system is represented by a cascade of two first-order lead-lag transfer functions used to compensate the phase lag between the excitation voltage and the electrical torque of the synchronous machine [5,9]
2.2. Multi-band Power System Stabilizer
The disturbances occurring in a power system induce electromechanical oscillations of the electrical generators. These oscillations, also called power swings, must be effectively damped to maintain the system's stability. Electromechanical oscillations can be classified in four main categories [1, 3, 4]:
(1) Local oscillations: between a unit and the rest of the generating station and between the latter and the rest of the power system. Their frequencies typically range from 0.8 to 4.0Hz.
(2) Interplant oscillations: between two electrically close generation plants. Frequencies can vary from 1 to 2Hz.
(3) Interarea oscillations: between two major groups of generation plants. Frequencies are typically in a range of 0.2 to 0.8Hz.
www.ijiset.com
63
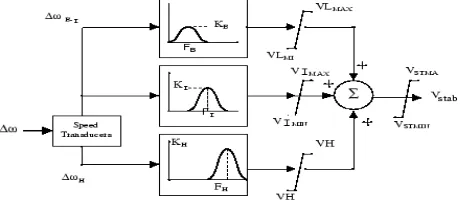
Figure 2. The Block Diagram of the Multi-bandPower System Stabilizer (MB-PSS)
The need for effective damping of such a wide range, almost two decades, of electromechanical oscillations motivated the concept of the multiband power system stabilizer (MBPSS), as shown in Figure 2. Just as its name reveals, the MB-PSS structure is based on multiple working bands. Three separate bands are dedicated to the low-, intermediate-, and high-frequency modes of oscillations: the low band is typically associated with the power system global mode, the intermediate with the interarea modes, and the high with the local modes. Each of the three bands is made of a differential bandpass filter, a gain, and a limiter. The outputs of the three bands are summed and passed through a final limiter producing the stabilizer output Vstab. This signal then modulates the set point of the generator voltage regulator so as to improve the damping of the electromechanical oscillations. To ensure robust damping, the MB-PSS should include a moderate phase advance at all frequencies of interest to compensate for the inherent lag between the field excitation and the electrical torque induced by the MB-PSS action [8,9]
3. Static Var Compensator (SVC)
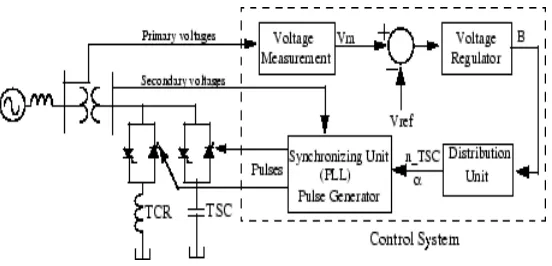
Figure 3 shows the single-line diagram of a static var compensator and its control system. The variation of reactive power is performed by switching three-phase capacitor banks and inductor banks connected on the secondary side of a coupling transformer. Each capacitor bank is switched on and off by three thyristor switches (Thyristor Switched Capacitor or TSC). Reactors are either switched on-off (Thyristor Switched Reactor or TSR) or phase-controlled (Thyristor Controlled Reactor or TCR).
The control system consists of the following issues: (1) A measurement system measuring the positive-sequence voltage is to be controlled.
(2)A Fourier-based measurement system using a one-cycle running average is used.
(3) A voltage regulator that uses the voltage error (difference between the measured voltage Vm and the reference voltage Vref) to determine the SVC susceptance B needed to keep the system voltage constant.
(4) A distribution unit that determines the TSCs (and eventually TSRs) must be switched in and out, and computes the firing angle of TCRs.
(5) A synchronizing system using a phase-locked loop (PLL) synchronized on the secondary voltages and a pulse generator that send appropriate pulses to the thyristors.[5,9,24]
Figure 3. The Single-Line Diagram of a Static Var Compensator and its Control System.
3.1. SVC V-I Characteristic
The SVC can be operated in two different modes: In voltage regulation mode (the voltage is regulated within limits as explained below). In var control mode (the SVC susceptance is kept constant). When the SVC is operated in voltage regulation mode, it implements the following V-I characteristic (Figure 4).
Figure 4. The V-I Characteristics of the SVC
As long as the SVC susceptance (B) stays within the maximum and minimum susceptance values imposed by the total reactive power of capacitor banks (Bcmax) and reactor banks (Blmax), the voltage is regulated at the reference voltage Vref. However, a voltage droop is normally used (usually between 1% and 4% at maximum reactive power output), and the V-I characteristic has the slope indicated in the Figure. The V-I characteristic is described by the following three equations [1, 3, 4]:
V = Vref + Xs⋅I
{if SVC is in regulation range( −Bcmax< B < Bl
www.ijiset.com
64
V = - (I / BcRmaxR ) { If SVC is fully capacitive ( B =BcRmaxR) }R R(3)
V = I / BlRmaxR { If SVC is fully inductive ( B =
BlRmaxR)
} (4) Where, V = Positive sequence voltage, I = Reactive current(pu/Pbase) (I > 0 indicates an inductive current Xs = Slope or droop reactance (pu/Pbase),
Bcmax = Maximum capacitive
susceptance(pu/Pbase) with all TSCs in service, no TSR or TCR, Blmax = Maximum inductive susceptance(pu/Pbase) with all TSRs or TCRs at full conduction, no TSC, Pbase = Three –phase base power.[9]
3.2. SVC Dynamic Response
When the SVC is operating in voltage regulation mode, its response speed to a change of system voltage depends on the voltage regulator gains (proportional gain Kp and integral gain Ki), the droop reactance Xs, and the system strength (short-circuit level). For an integral-type voltage regulator (Kp = 0), if the voltage measurement time constant Tm and the average time delay Td due to valve firing are neglected, the closed-loop system consisting of the SVC and the power system can be approximated by a first-order system having the following closed-loop time constant: TRcR = 1 / [Ki(Xs + Xn)]
(5)
Where,‘Tc’ represents the closed-loop time constant; ‘Ki’ represents the proportional gain of the voltage regulator (p.u._B/p.u._V/s); ‘Xs’ represents the slope reactance p.u./Pbase; ‘Xn’ represents the equivalent power system reactance (p.u./Pbase).
This equation demonstrates that we obtain a faster response speed when the regulator gain is increased or when the system short-circuit level decreases (higher Xn values). If we take into account the time delays due to voltage measurement system and valve firing, we obtain an oscillatory response and, eventually, instability with too weak a system or too large a regulator gain.[9]
4. Static Synchronous Compensator (STATCOM)
The Static Synchronous Compensator (STATCOM) is a shunt device of the Flexible AC Transmission Systems (FACTS) family using power electronics to control power flow and improve transient stability on power grids. The STATCOM regulates voltage at its terminal by controlling the amount of reactive power injected into or absorbed from the power system. When system voltage is low, the STATCOM generates reactive power (STATCOM capacitive).
When system voltage is high, it absorbs reactive power (STATCOM inductive)[9,13].
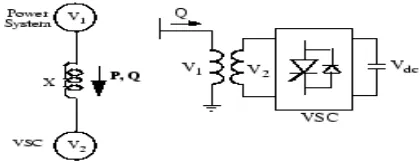
The variation of reactive power is performed by means of a Voltage-Sourced Converter (VSC) connected on the secondary side of a coupling transformer. The VSC uses forced-commutated power electronic devices (GTOs, IGBTs or IGCTs) to synthesize a voltage V2 from a DC voltage source. The principle of operation of the STATCOM is explained on the figure below showing the active and reactive power transfer between a source V1 and a source V2. In this figure, V1 represents the system voltage to be controlled and V2 is the voltage generated by the VSC [9,13].
4.1 Operating Principle of the STATCOM
Figure 5. Basic functional model of STATCOM
16T
P16T = (16TV16TR1R16TV16TR2R)sin16Tδ16T / 16TX 16T, 16TQ = 16T 16TV16TR1R(16TV16TR1 – R 16TV16TR2Rcos16Tδ16T) / 16TX
(6)
V1 = Line to line voltage of source1, V2 = Line to line voltage of source2, X = Reactance of interconnection transformer and filters, δ = Phase angle of VR1R with respect to VR2
In steady state operation, the voltage V2 generated by the VSC is in phase with V1 (δ=0), so that only reactive power is flowing (P=0). If V2 is lower than V1, Q is flowing from V1 to V2 (STATCOM is absorbing reactive power). On the reverse, if V2 is higher than V1, Q is flowing from V2 to V1 (STATCOM is generating reactive power). The amount of reactive power is given by:
Q = (VR1R(VR1R – VR2R )) / X. (7)
A capacitor connected on the DC side of the VSC acts as a DC voltage source. In steady state the voltage V2 has to be phase shifted slightly behind V1 in order to compensate for transformer and VSC losses and to keep the capacitor charged. Two VSC technologies can be used for the VSC:
www.ijiset.com
65
harmonics contained in the square wavesgenerated by individual inverters. In this type of VSC, the fundamental component of voltage V2 is proportional to the voltage Vdc. Therefore Vdc has to be varied for controlling the reactive power.
• VSC using IGBT-based PWM inverters. This type of inverter uses Pulse-Width Modulation (PWM) technique to synthesize a sinusoidal waveform from a DC voltage source with a typical chopping frequency of a few kilohertz. Harmonic voltages are cancelled by connecting filters at the AC side of the VSC. This type of VSC uses a fixed DC voltage Vdc. Voltage V2 is varied by changing the modulation index of the PWM modulator [9,15,22,24,].
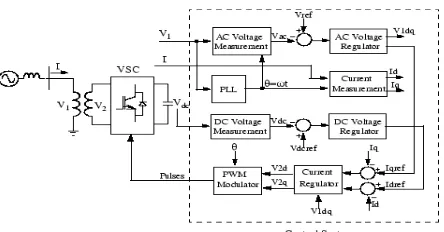
4.2 Single-line Diagram of a STATCOM and Its Control System Block Diagram
Figure 6. Single-line Diagram of a STATCOM and Its Control System Block Diagram
The control system consists of: A phase-locked loop (PLL) which synchronizes on the positive-sequence component of the three-phase primary voltage V1. The output of the PLL (angle Θ=ωt) is used to compute the direct-axis and quadrature-axis components of the AC three-phase voltage and currents (labeled as Vd, Vq or Id, Iq on the diagram).
• Measurement systems measuring the d and q components of AC positive-sequence voltage and currents to be controlled as well as the DC voltage Vdc.
• An outer regulation loop consisting of an AC voltage regulator and a DC voltage regulator. The output of the AC voltage regulator is the reference current Iqref for the current regulator (Iq = current in quadrature with voltage which controls reactive power flow). The output of the DC voltage regulator is the reference current Idref for the current regulator (Id = current
in phase with voltage which controls active power flow).
• An inner current regulation loop consisting of a current regulator. The current regulator controls the magnitude and phase of the voltage generated by the PWM converter (V2d V2q) from the Idref and Iqref reference currents produced respectively by the DC voltage regulator and the AC voltage regulator (in voltage control mode). The current regulator is assisted by a feed forward type regulator which predicts the V2 voltage output (V2d V2q) from the V1 measurement (V1d V1q) and the transformer leakage reactance.[9,21,23]
4.3 STATCOM V-I Characteristic
The STATCOM can be operated in two different modes:
• In voltage regulation mode (the voltage is regulated within limits as explained below) • In var control mode (the STATCOM
reactive power output is kept constant) When the STATCOM is operated in voltage regulation mode, it implements the following V-I characteristic.
Figure 7. The V-I Characteristics of the STATCOM
As long as the reactive current stays within the minimum and minimum current values (-Imax, Imax) imposed by the converter rating, the voltage is regulated at the reference voltage Vref. However, a voltage droop is normally used (usually between 1% and 4% at maximum reactive power output), and the V-I characteristic has the slope indicated in the figure. In the voltage regulation mode, the V-I characteristic is described by the equation: V = VRrefR +
Xs I (8) Where, V = Positive sequence voltage (pu), I = Reactive current (pu/Pnom) (I > 0 indicates an inductive current), Xs = Slope or droop reactance (pu/Pnom), Pnom = Three-phase nominal power of the converter.[9,15,22]
6. Simulation Model and Results:
Two-www.ijiset.com
66
Area System) two area 11 Bus -bus power systemnetwork with SVC and STATCOM which are connected at bus 7 as shown in figure 8 & 9. The system contains eleven buses and two areas, connected by a weak tie between bus 7 and 9. Totally two loads are applied to the system at bus 7 and 9. Two shunt capacitors are also connected to bus 7 and 9 as shown in the figure 8&9. The system comprises two similar areas connected by a weak tie. Each area consists of two generators, each having a rating of 900 MVA and 20 kV. All four machines are equipped with a steam turbine and governor(STG), excitation system and power system stabilizer(PSS).The left half of the system is identified as area 1 and the right half is identified as area 2. The saturation of the synchronous machines are not identical. Both SVC and STATCOM used for this model have same rating of +/- 200 MVA and the reference voltage is set to 1 pu for both SVC and STATCOM. The loads and reactive power supplied A: PL = 967 MW QL = 100MVAr QC = 187MVAr B: PL= 1767 MW QL = 100MVAr Qc = 187 MVAr. The transmission system nominal voltage is 230kV. The base MVA of the system is 100 and system
frequency is 60 Hz. All the time constants are in seconds. The transient stability analysis has been carried out by monitoring the performance of the generators (G1,G2,G3&G4) and different buses. The transient stability analysis of this power system network have been considered when three phase fault occurs at bus 8 at time t = 1s and cleared at 2.1s. The total duration of fault is 1.1s. It is observed that the system quickly losses its stability after fault clearing as shown in figure11. In order not to pursue unnecessary simulation, the Simulink Stop block is used to stop the simulation when angle difference reaches 3*360. Figure no. 10, shows the Waveforms of without three phase fault, here the system is stable so does not required facts and pss devices in this case. During & post fault condition shown in fig 12 to 17, we observed the terminal voltage and speed of all generators. The terminal voltage reached to zero pu during fault and increased up to 1 pu and settle to 1 pu after fault. During fault speed of all generators increased up to 1.03 pu due to sudden decrease in load and settle to 1 pu after fault.
www.ijiset.com
67
Figure9. Simulink model of 3 machine 9 bus system with STATCOMFigure10. Waveform of without three phase fault – (i) Rotor angle deviation between generator G1,G2,G3&G4 (ii) Speed of rotor machine G,G2,G3&G4 (iii) Stator Voltage of G1,G2,G3&G4
Figure11. Waveform of with three phase fault – (i) Rotor angle deviation between generator G1,G2,G3&G4 (ii) Speed of rotor machine G,G2,G3&G4 (iii) Stator Voltage of
G1,G2,G3&G4
Figure12. Waveform of with three phase fault and SVC – (i) Rotor angle deviation between generator G1,G2,G3&G4 (ii) Speed of rotor machine G1,G2,G3&G4 (iii) Stator Voltage of G1,G2,G3&G4
www.ijiset.com
68
Figure14. Waveform of with three phase fault andSVC&MBPSS – (i) Rotor angle deviation between generator G1,G2,G3&G4 (ii) Speed of rotor machine G1,G2,G3&G4 (iii) Stator Voltage of G1,G2, G3&G4
Figure15. Waveform of with three phase fault and STATCOM – (i) Rotor angle deviation between generator G1,G2,G3&G4 (ii) Speed of rotor machine G1,G2,G3&G4 (iii) Stator Voltage of G1,G2, G3&G4
Figure16. Waveform of with three phase fault and STATCOM&GPSS – (i) Rotor angle deviation between generator G1,G2,G3&G4 (ii) Speed of rotor machine G1,G2,G3&G4 (iii) Stator Voltage of G1,G2,G3&G4
Figure17. Waveform of with three phase fault and STATCOM&MBPSS – (i) Rotor angle deviation between generator G1,G2 and G3 (ii) Speed of rotor machine G1,G2,G3&G4 (iii) Stator Voltage of G1,G2,G3&G4
6.1 Comparison between of SVC and STATCOM with and without PSS:
From simulation results shown in figure 12 to 17 comparison is made between the above facts devices with and without PSS for stability enhancement of IEEE 11 bus system as shown in table 1 and 2. From table1&2, it is clear that STATCOM with MBPSS is the effective combination for stability enhancement over SVC with MBPSS as the post fault settling time and angle deviation obtained from STATCOM with MBPSS is less as compared to that obtained from SVC with MBPSS.
Table.1 Comparison between SVC and STATCOM with and without PSS for power system stability enhancement
IEEE 11 Bus system with Power system
stability Enhancement
Stability time for d_theta 1_2 (in sec)
Stability time for d_theta 3_4 (in sec)
Stability time for d_theta 1_4(in sec)
Stability
time for d_theta
2_3(in sec)
SVC YES 20 20 20 20
STATCOM YES 20 20 20 20
SVC&GPSS YES 9 9 9 9
STATCOM&GPSS YES 9 9 9 9
SVC&MBPSS YES 8 8 8 8
STATCOM&MBPSS YES 8 8 8 8
www.ijiset.com
69
IEEE 9 Bus system with Angle deviationd_theta 1_2 (min. and max. in deg)
Angle deviation d_theta 3_4 (min. and max. in deg )
Angle deviation d_theta1_4 (min. and max. in deg )
Angle deviation d_theta2_3 (min. and max. in deg)
SVC +15 to +38P
-7.5 to -20 -50 to +100 -40 to +80
STATCOM +17 to +37 -7.5 to -27.5 -20 to +80 -20 to +62
SVC&GPSS +15 to +35 -5 to -30 -50 to +110 -48 to +100
STATCOM&GPSS +15 to +38 -5 to -28 -48 to +100 -45 to +99
SVC&MBPSS +15 to +38 -5 to -30 -50 to +100 -48 to +100
STATCOM&MBPSS +15 to +36 -5 to -27 -48 to +100 -45 to +98
7. Conclusion:
(a) The dynamic behavior of the power system is compared with the presence of SVC and STATCOM in the system in the event of a major disturbance. Then the performance of STATCOM for power system stability improvement is compared with the SVC. It is clear from the simulation results that there is a considerable improvement in the system performance with the use of STATCOM for which settling time in post fault is found to be around 20 sec. and angle deviation between all 4 generators is less as compared to SVC as shown in table no.2.
(b) The dynamic behavior of the power system is also compared with the presence of SVC with PSS and STATCOM with PSS in the system in the event of a major disturbance. Then the performance of STATCOM with MBPSS for power system stability improvement is compared with the SVC incorporated with MBPSS . It is clear from the simulation results that there is a considerable improvement in the system performance with the use of STATCOM with MBPSS for which settling time in post fault is found to be around 8 sec. and angle deviation between all 4 generators is less as compared to SVC with MBPSS as shown in table no.2.
REFERENCES:
[1] Prabha Kundur, “Definition and Classification of Power System Stability” IEEE TRANSACTIONS ON POWER SYSTEMS © 2004 IEEE
[2] Prabha Kundur, “Power System Control and stability” The EPRI Power System Engineering Series.
[3] Narain G. Hingorani, Laszlo Gyugyi, “Understanding FACTS : concepts and technology of flexible AC transmission systems”
[4] Mehrdad Ahmadi Kamarposhti, “Comparison of SVC and STATCOM in Static Voltage Stability
Margin Enhancement,” World Academy of Science, Engineering and Technology,2009
[5] Huang Shao-Ping, “Modeling and Simulating for Transient Stability Analysis of Power System using Dynamic Phasor” The 1st International Conference on Information Science and Engineering (ICISE2009)
[6] Mohammad Mohammadi, “Voltage Stability Analysis with Static Var Compensator (SVC) for Various Faults in Power System with and Without Power System Stabilizers (PSS)” Research Journal of Applied Sciences, Engineering and Technology 3(7): 668-676, July 25, 2011
[7] NavinkumarRao, ' “Steady-State and Dynamic Performance of the Static Var Compensator (SVC)
Phasor Model” NIET JOURNAL OF
ENGINEERING &TECHNOLOGYWinter 2011
[8] Gaber Shabib, “COORDINATED DESIGN OF A MB-PSS AND STATCOM CONTROLLER TO ENHANCE POWER SYSTEM STABILITY” International Journal of Electrical Engineering and Technology (IJEET), Volume 3, Issue 2, July- September (2012).
[9] Lin Xu, “Coordinated Control of SVC and PSS for Transient Stability Enhancement of Multi-Machine Power system” TELKOMNIKA, Vol. 11, No. 2, February 2013.
[10] Tran Thi Ngoat and Le Ngoc Giang, “Assessment of the Effectiveness of Two Coordinated Systems: SVC-PSS and STATCOM-PSS for Improving Transient Stability of Power System” International Journal of Computer and Electrical Engineering, Vol. 5, No. 4, August 2013
www.ijiset.com
70
Electrical, Electronics and InstrumentationEngineering
Vol. 2, Issue 8, August 2013
[12] EMAD ALI DAOOD, “DYNAMIC EFFECT OF FACTS ON TRANSIENT STABILITY ANALYSIS OF POWER SYSTEM STABILIZERS BY SOFT COMPUTING TECHNIQUE” International Journal of Electrical and Electronics Engineering Research (IJEEER) ,Vol. 3, Issue 5, Dec 2013.
[13] Arvind Pahade and Nitin Saxena, “Transient stability improvement by using shunt FACT device (STATCOM) with Reference Voltage Compensation (RVC) control scheme” International Journal of Electrical, Electronics and Computer Engineering 2(1): 7- 12(2013)
[14] Apoorv H Prajapati, “BASIC CONCEPT OF POWER SYSTEM STABILIZER FOR POWER SYSTEM STABILITY AND COMPARISON OF DIFFERENT DESIGN METHODS” International Journal For Technological Research In Engineering Volume 1, Issue 11, July-2014
[15] Dinesh Kumar1, Ajay Kumar2, “Stability Analysis of Multi-Machine System using STATCOM” International Journal of Enhanced Research in Science Technology & Engineering, Vol. 3 Issue 8, August-2014.
[16] Gowrishankar Kasilingam, “Coordination of PSS and PID Controller for Power System Stability Enhancement – Overview” Indian Journal of Science and Technology, Vol 8(2), 142–151, January 2015.
[17] J.N.Rai Comparison of FACTS Devices for Two Area Power System Stability Enhancement using MATLAB Modelling” International Journal of Applied Power Engineering (IJAPE) Vol. 3, No. 2, August 2014
[18] Divya Prakash, “Enhancing Stability of Multi-Machine IEEE 9 Bus Power System Network Using PSS” International Journal of Advanced Research in Electrical,Electronics and Instrumentation Engineering, Vol. 4, Issue 5, May 2015.
[19] Urmila Bainsla*1, Mohini2, Kiran Rani3, Dr.
Anju Gupta4 “TRANSIENT STABILITY
ENHANCEMENT OF MULTI MACHINE SYSTEM USING STATIC VAR COMPENSATOR” International Journal of Engineering Research and General Science Volume 3, Issue 3, May-June, 2015
[20] P.P. Panchbhai Transient Stability Improvement Of IEEE 9 Bus System With Shunt FACTS Device STATCOMInternational Research Journal of Engineering and Technology (IRJET) ,Volume: 03 Issue: 03 | Mar-2016
[21] Prashant Rajotia1 “ POWER SYSTEM STABILITY IMPROVEMENT OF MULTI MACHINE SYSTEM BY USING STATCOM”International Research Journal of Engineering & Applied Sciences,Volume 4 Issue 3, July 2016 – September 2016
[22] Moudud Ahmed, “A comparative analysis on different types of power system stabilizers” IEEE Xplore:01 December 2016.
[23] P. Suresh, “TRANSIENT STABILITY PERFORMANCE ANALYSIS OF AN IEEE
9 BUS POWER SYSTEM USING FACTS DEVICE” International Journal of Computational Research and Development (IJCRD) ),Volume 1, Issue 2, 2016