Planetary scale and tidal perturbations in mesospheric temperature observed by
WINDII
M. G. Shepherd1, W. E. Ward2, B. Prawirosoehardjo1, R. G. Roble3, S.-P. Zhang1, and D. Y. Wang2
1∗Centre for Research in Earth and Space Science, York University, Toronto, Canada
2Centre for Research in Earth and Space Technology, Toronto, Canada
3High Altitude Observatory, National Center for Atmospheric Research, Boulder, CO, U.S.A.
(Received August 11, 1998; Revised June 25, 1999; Accepted June 25, 1999)
WINDII, the Wind Imaging Interferometer on the Upper Atmospheric Research Satellite measures winds and emission rates from selected excited metastable species. Here we report on measurements of the atmospheric Rayleigh scattering from the O(1S) background filter at 553 nm wavelength used to derive temperature profiles in the upper mesosphere from 70 km to 95 km, for solstice periods from December 1992/93 and January 1993/94. The data are first zonally averaged and then combined in local time over about one month. Based on these temperatures, an analysis of planetary wave structures and tidal perturbations employing least-mean-square (LMS) fits to the data has been conducted and the results are presented. The planetary wave structures observed were well described with a quasi two-day wave (QTDW). Amplitudes of 14 K and 10 K at 85 km height for downleg (descending) and upleg (ascending) sampling respectively at latitudes from 20◦S to 40◦S were found to be in good agreement with QTDW temperature results from the MLS/UARS experiment assuming a vertical amplitude structure of the type described by the HRDI/UARS mesospheric wind observations. It is shown that the diurnal tide amplitudes estimated from latitudes from 25◦N to 35◦S using the LMS fit maximize at the equator with an amplitude of about 6 K and decrease toward tropical latitudes, consistent with the classical tidal theory and predictions from the TIME-GCM model.
1.
Introduction
The atmosphere between 80 and 100 km is one of the most difficult regions to study experimentally. The domi-nant source of temperature information for this region comes from rocket based in-situ measurements, ground-based lidar observations and in the last decade—from satellite missions like the SME (Clancy and Rush, 1989; Clancyet al., 1994) and UARS (Reberet al., 1993).
The most extensive observations of middle atmosphere thermal tides relied on ground-based optical techniques (Wiens et al., 1995; Yu et al., 1997; Hecht et al., 1998; States and Gardner, 1998; von Zahn et al., 1998). These data, although with high time resolution, are limited to a few geographical locations. On the other hand, satellites provide long term, continuous global coverage of the mid-dle atmosphere, although with much coarser time resolu-tion. Satellite studies successfully demonstrated the feasibil-ity and methodology of obtaining global tidal analysis from sun-synchronous satellite measurements (i.e. Hitchman and Leovy, 1985; Lieberman, 1991).
While much effort has been devoted to the study and mod-eling of tidal perturbations and planetary waves in the meso-sphere/lower thermosphere (MLT) wind field (i.e. Hayset al., 1994; Burrageet al., 1995; Hagan et al., 1995, 1997;
∗CRESS, York University, 4700 Keele Street, North York, Ont, Canada, M4J 1P3.
Copy right cThe Society of Geomagnetism and Earth, Planetary and Space Sciences (SGEPSS); The Seismological Society of Japan; The Volcanological Society of Japan; The Geodetic Society of Japan; The Japanese Society for Planetary Sciences.
McLandress et al., 1996; Akmaev et al., 1997; Yudin et al., 1997; Wanget al., 1997, and references therein), few studies have addressed the dynamics of the temperature field in that region (i.e. Rodgers and Prata, 1981; Hitchman and Leovy, 1985; Dudhiaet al., 1993; Wuet al., 1996; Wardet al., 1998). Many of the published mesospheric temperature studies have been focused on the accuracy of the retrieved temperature profiles, and a determination of climatological means and trends.
In the following sections we present results from analy-sis of tidal perturbations and planetary scale waves, such as the quasi two-day wave, in mesospheric temperature data from the 70–95 km height range, from the Wind Imaging In-terferometer (WINDII) (Shepherdet al., 1993a) on UARS. These have been identified as major features in the analy-sis of the wind data of WINDII and HRDI on UARS and it is of interest to identify their form in the WINDII tem-perature data. The observed mean temtem-perature field, tidal amplitudes and phases are compared with some model pre-dictions by the TIME-GCM (Roble and Ridley, 1994), while the quasi two-day wave results are discussed in the context of the UARS/MLS (Wuet al., 1996) temperature observations and the WINDII and HRDI wind signatures.
2.
WINDII Temperature Data
The vertical temperature profiles are derived from Rayleigh scattering measurements by the WINDII back-ground filter at 553 nm wavelength. The WINDII measure-ments are limb images of the MLT with tangent heights that range in average from 65 to 115 km above the surface in
594 M. G. SHEPHERDet al.: WINDII TEMPERATURE TIDES AND PLANETARY WAVES
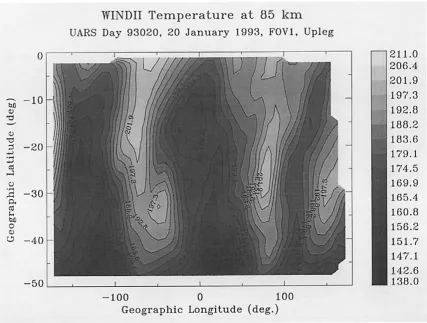
Fig. 1a. Map of the WINDII temperatures at 85 km, in the Southern hemisphere for January 20, 1993. The colour table units are for temperature in Kelvin (K).
2.2 km increments. The measurements sample horizontal segments of 25 km with 5 km bins and are integrated along the line-of-sight direction over a distance of roughly 400 km. The two look directions view at 45◦and 135◦from the UARS satellite track.
Due to the orbital inclination of the UARS spacecraft, the maximum latitude coverage observed is from about 72◦in one hemisphere to 42◦ in the other. The viewing geome-try of WINDII depends on the pointing direction of UARS which rotates 180◦every 36 days. On a single day WINDII completes 15 orbits while the Earth rotates beneath it, thus providing a full longitudinal coverage over a given latitude circle. For an earth-bound observer, the observing points drift westward along a latitude circle at a rate of about 365◦of longitude per day. This corresponds to a 20-minute change in the local time of each subsequent day’s measurement. About 72 days are thus required for all solar times to be sampled by the satellite on a single node. However, since the orbit has both ascending and descending portions it takes only 36 days to cover the complete diurnal range. Under these con-ditions WINDII is able to provide data for tidal analysis by collecting observations over a month.
The temperature retrieval is based on an approach simi-lar to that employed in the analysis of Rayleigh lidar data. Assuming that the atmosphere is in hydrodynamical equilib-rium and is described by the ideal gas law, the temperature is derived from the atmospheric scale height at given altitude. In the case of WINDII the measurements are integral
line-of-sight values of the Rayleigh scattering radiances, which are inverted to volume emission rates at the tangent height from which the derived temperature is assigned to that tan-gent height. The temperature inversion employs a Chahine-type routine (i.e. Chahine, 1977; Twomey, 1977) which will be discussed in detail in an upcoming paper. Some earlier results were discussed by Shepherdet al.(1997). Since the molecular scatter signal which is proportional to atmospheric density is very weak in the upper mesosphere the SNR and the measurement accuracy rapidly deteriorates with height at altitudes above about 95 km. Therefore, at present, mean-ingful temperature values can be derived only below about 90 km altitude.
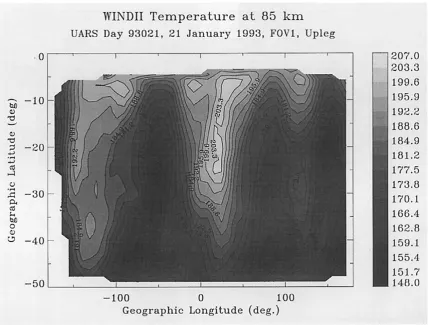
Fig. 1b. Map of the WINDII temperatures at 85 km, in the Southern hemisphere for January 21, 1993. The colour table units are for temperature in Kelvin (K).
The quasi two-day analysis is accomplished employing the approach used for the analysis of WINDII wind data (Wardet al., 1996). The daily longitudinal coverage allows planetary wave signatures to be identified in a single day although in the analysis presented here two day intervals are used to provide better signal-to noise in the determination of the amplitudes and phases. For the tidal analysis the data are binned in local solar time LT/latitude/altitude. The LT binning is 1 hour, the latitude binning is in 10◦intervals, and the altitude bins are 2 km. Due to the fact that WINDII views at afixed angle with respect to the local spacecraft horizontal, the ellipticity of the orbit and the earth oblateness cause the height range of the mesospheric image to change with latitude along the orbit. From the equator to 50◦S the height of the bottom of the image changes from 65 km to 80 km restricting the height range available for temperature measurements. Another re-striction on the local time coverage is due to the precession of the orbit. For the time period under consideration, the cov-erage of the northern latitudes is limited by the position of the terminator. Finally, changes in the WINDII observation mode (from Southern to Northern hemisphere), that is the yaw, also lead to a gap in the LT sampling as will be shown and discussed in the following sections.
3.
Results
It is well known now that the two dominant planetary scale components in the mesosphere are the migrating solar tides and the westward propagating family of planetary waves.
Tidal and planetary waves often dominate the meteorology of the atmospheric region between 80 and 150 km. Thus it is of considerable interest to see to what extent the WINDII temperature observations in the upper mesosphere reflect the presence of such dynamical structures.
3.1 Quasi 2-day wave
Ground-based (Clarket al., 1994; Harris, 1994; Meeket al., 1996) and satellite observations (Wuet al., 1993; Ward
et al., 1996) have shown the QTDW to be a dominant dy-namical feature in the MLT region in the month following solstice. While most of the results were concerned with the MLT wind field, QTDW signatures were observed also in the mesospheric temperature (Rodgers and Prata, 1981; Wu
et al., 1996) and the green line emission rates, observed by WINDII (Wardet al., 1997).
596 M. G. SHEPHERDet al.: WINDII TEMPERATURE TIDES AND PLANETARY WAVES
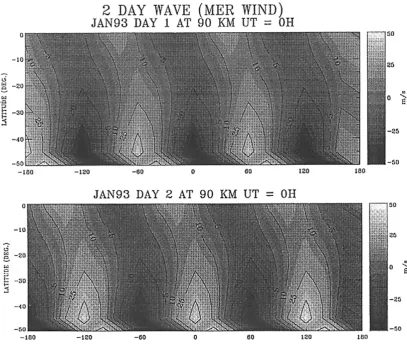
Fig. 2. Simulations of the quasi two-day wave using WINDII wind measurements for January 1993 (see text).
scattering can be observed or temperature derived. In the spring of 1994 this problem was eliminated as the entire UARS satellite was“tipped”downward by about 0.3◦.
Mapping of the temperatures at 85 km showed structures in the temperaturefield characterized by three maxima, each extending from the equator to about 50◦S. On a given day these maxima were positioned about 120◦ longitude apart. Comparing the pattern on two consecutive days, e.g. Jan-uary 20 and JanJan-uary 21, 1993, illustrated in Fig. 1, showed that on the second day the maxima had propagated west-ward in longitude with a phase shift of about 60◦. All these characteristics are consistent with the signature of a quasi 2-day wave (QTDW) (Haganet al., 1993). Empirical model
fits (Wanget al., 1997) at 90 km height of a QTDW, using high resolution global wind data derived from the WINDII green line observations from 1992 and 1993, and given in Fig. 2, shows a pattern similar with that of the experimental temperatures in Fig. 1.
A comparison between the WINDII meridional windfield on January 20, 1993 at 90 km (Wardet al., 1996,figure 2a) with the temperature field for the same day at 25◦–35◦S showed winds and temperature QDTW structures to be in quadrature. This is as expected for a Rossby wave with a ver-tical wavelength significantly greater than two scale heights. The temperature phase fronts are tilted westward similar to the wind QDTW pattern, although the tilt is not very
pro-nounced.
As was mentioned earlier, since the local time at given latitude circle varies by 20 min/day, the 11 day observations encompass about 3.5 hours of local time. Thus as was pointed out by Wardet al.(1997) the variations are observed against a background of a mean and a tide at given specific local time.
The amplitude and phase of the dynamical structure seen at 79 km, 82 km, 85 km and 88 km altitude are determined by binning the temperature data into latitude bins of 10◦. Each two day period and each latitude bin were fitted in least-mean-square (LMS) sense to:
TQTDW=T0+TCcos(2π(σt+nφ))+TSsin(2π(σt+nφ)), (1) where: φis the longitude, in degrees,t—the universal time (days),n is the zonal wavenumber (= 3), andσ is the ob-servational frequency (= 0.5 day−1) (Hagan et al., 1993; Wu et al., 1993). Here T0, TC, and TS are the constants solved for in thefitting process. It is assumed that the central period is 48 hours. The constant T0, represents the mean temperature and tidal temperaturefields (the tidal amplitude being roughly constant during a two-day period), whileTC andTSrepresent components of the QTDWfield. The am-plitude and phase of the QTDW are given by
TC2+TS2and tan−1(T
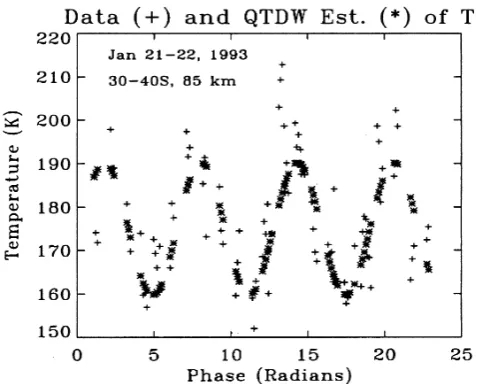
Employing the above expression, the WINDII tempera-tures werefitted at 20◦–30◦S and 30◦–40◦S. Figure 3 illus-trates the QTDWfit to the data at 85 km from January 21 and January 22, 1993 at 30◦–40◦S. The experimental data are indicated with crosses, while the QTDWfit is shown as asterisks. The data are plotted as a function of thefitting phase(2π(σt+nφ))in radians.
The question of aliasing for the QTDW has been discussed by Wu (1994) and Wuet al. (1995). The WINDII tempera-ture sampling is such that a data point is obtained for at least one of the legs on both days. According to Wu (1994) the QTDW aliasing is negligible and will not be addressed in the discussion that follows.
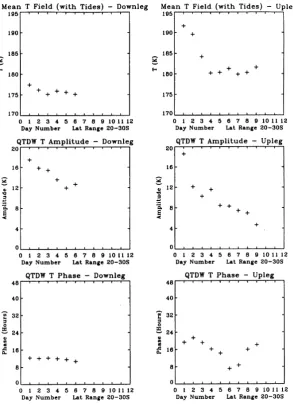
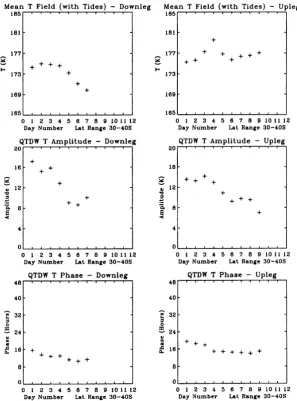
From the LMSfit the mean temperaturefield, amplitude and phase of the QTDW were determined for each day from January 19 to January 30, 1993 and the results at 85 km al-titude are given in Fig. 4. The data were fitted separately for upleg and downleg, thus avoiding aliasing due to ther-mal tidal perturbations. The downleg results are available only for six days, limited by the position of the termina-tor. The upleg results cover the entire ten days period of observations. A general trend in the temperature amplitudes both for upleg and downleg, as well as at the 20◦S–30◦S and 30◦S–40◦S bins, is that they decrease in magnitude as time progresses. The downleg amplitudes show smaller variations but are larger in magnitude than those for the upleg. There seems to be a trend of three-four days of almost constant am-plitude, a day of transition, followed by another three to four days of almost constant amplitude particularly at the 30◦S–
40◦S latitude range (Fig. 4b). In the 20◦S–30◦S range the downleg temperature amplitude is around 16 K for thefirst three days, followed by another three days with amplitude of about 13 K, giving an average amplitude of 15 K for the entire period. For the upleg the scatter in the 20◦S–30◦S data is larger but settles down to a mean of about 8 K in the second part of the period (after the 6th day) with an average ampli-tude of 9 K at 85 km. At 30◦S–40◦S downleg, the amplitudes
Fig. 3. QTDWfit in LMS sense (asterisks) to the WINDII temperatures (crosses) at 85 km and in the 30◦–40◦S latitude bin for January 21/22, 1993.
are quite variable ranging from about 16 K for thefirst three days, to about 9 K at the end of this time interval. For the 30◦S–40◦S upleg range the amplitude decreases from 14 K in thefirst four days to about 10 K in the second half of the period, with a total average of 11 K.
The QTDW phase assigned to an arbitrary longitude of 0◦, for the downleg is of the order of 12–14 hr for both lati-tude ranges considered. In the upleg case at 20◦S–30◦S the QTDW phase varies significantly during the 10 days period with an average of 16 hr, while at 30◦S–40◦S it is almost constant at about 16 hr. The QTDW mean temperaturefield including tides, for downleg is of the order of 173–176 K, but larger variations are seen in the upleg data with an average of 176–183 K. In the latitude range 20◦S–30◦S the QTDW downleg mean temperature at 85 km (Fig. 4a) is rather con-stant over the six days period, 175–176 K, encompassing 2 hr of LT, while at 30◦S–40◦S it is of the order of 175 K for the
first four days of the period followed by a decrease down to∼170 K by the end of the time series. For the upleg the scatter of the mean temperatures is larger at the beginning of the observation period, but is about 180 K after the third day at 20◦S–30◦S, and about 176–177 K at 30◦S–40◦S.
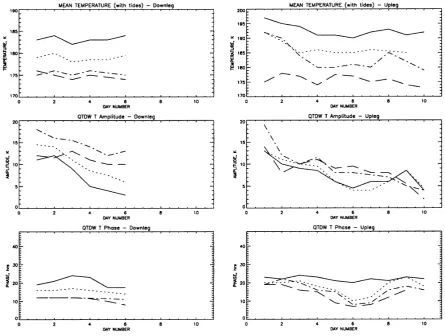
Figure 5 shows a comparison between the QTDW param-eters derived at 79 km, 82 km, 85 km and 88 km for the latitude range 20◦S–30◦S. In the downleg case the ampli-tude increases with increasing height from an average of 7 K at 79 km to 15 K at 85 km or by about a factor of 2. In the upleg case the increase is apparent although it is less dra-matic and the amplitude of the QTDW at 85 km is only 20% larger than the 79 km value of 8 K. For the 30◦S–40◦S lat-itude bin (not shown here) there is much larger scatter both in the downleg and the upleg values compared to those at 20◦S–30◦S. For the downleg the increase is only 33% larger than the 7 K value at 79 km, while for the upleg—it is about 70% larger than the 6 K value at 79 km.
The differences in the amplitude and mean temperature
fields for the upleg and the downleg segments of the WINDII observations seen in Figs. 4 and 5 correspond to different local time and hence to different phases of the tidal signatures or different conditions for thefiltering of gravity waves (GW) and the associated forcing of the flow. In a recent study Meyer (1999) investigated the interaction of gravity waves with QTDW employing the GSWM (Hagan et al., 1993) enhanced by a hybrid gravity wave parameterization. The results reported indicate that such an interaction will modify the amplitude of the QTDW while the phase will remain the same. However, the estimated temperature increase of 35 K to baseline QTDW amplitudes of the order of 25–30 K are much larger then the upleg/downleg differences shown in Figs. 4 and 5 and at present we cannot draw a conclusion about the presence or magnitude of plausible GW-QTDW perturbations in the WINDII temperatures.
mid-598 M. G. SHEPHERDet al.: WINDII TEMPERATURE TIDES AND PLANETARY WAVES
Fig. 4a. QTDW parameters for the WINDII temperaturefield at 20◦–30◦S at 85 km altitude.
latitude in the Southern hemisphere increases with height up to about 85 km where the wind amplitude is a factor of 2 larger than that at 75 km (Paloet al., 1997,figure 15). Assuming that there is no significant dynamical perturbation between 73 km and 79 km gives very good agreement between the QTDW temperature amplitudes determined from the MLS and the WINDII observations. The WINDII amplitude re-sults for the downleg are also consistent with the meridional wind QTDW’s pattern reported by Paloet al.(1997).
3.2 Tidal perturbations
A common approach used in the analysis of dynamical structures in wind data was to combine data from several years of observations for a given season thus producing a larger dataset with better latitude/LT coverage. This ap-proach was demonstrated to be successful in the tidal analysis of the WINDII and HRDI wind data (e.g. Hayset al., 1994; McLandress et al., 1996). While the WINDII wind data have 24 hours coverage allowing reliable determination of diurnal and semidiurnal tidal structures, the WINDII meso-spheric temperatures are only for the daytime and the limited LT sampling can influence significantly the characteristics of
the results obtained.
Fig. 4b. QTDW parameters for the WINDII temperaturefield at 30◦–40◦S at 85 km altitude.
diurnal perturbation. There is a temperature minimum cen-tered at about 88 km in the morning sector (late January data) which moves slowly upward in the afternoon hours showing a reversed slope to that of the maximum at lower altitudes. This pattern is consistent with observations of tidal temper-ature perturbations reported by Yuet al.(1997). The gap in the LT coverage is due to the yaw change—from one obser-vational mode (Northern hemisphere) to another (Southern hemisphere). Although the yaw requires only one day, the position of the terminator and the WINDII orbital sequence options produce this gap. During the December solstice pe-riods in 1992/93 and 1993/94 the green line emission and the background at 553 nm wavelength are typically observed four times per week during daytime, except for the time from January 19 to January 30, 1993 when measurements were taken every day. In terms of actual time the yaw occurs on January 8, 1993 and January 5, 1994 for the 1992/93 and the 1993/94 datasets, respectively. Combining all tempera-ture profiles for the 1992/1994 period provides more detailed maps of the temperature distribution with height and LT. In the latitude range 15◦N–35◦S the composite December
sol-stice temperaturefield is determined from 42 to 45 daily zonal mean profiles. For the 15◦N–25◦N the sampling is only over 27 days of observations. Figure 7 presents the composite temperature map at the equator—the pattern similar to that outlined by the more limited sampling of the 1992/93 data. There is a distinct downward progression with LT below 85 km height with a well defined mesopause at about 90–92 km height in the morning sector which decreases with height in the afternoon.
600 M. G. SHEPHERDet al.: WINDII TEMPERATURE TIDES AND PLANETARY WAVES
Fig. 5. QTDW parameters for the WINDII temperaturefield at 20◦–30◦S for the height range from 79 to 88 km. Solid line—79 km, dotted line—82 km, long-dash—85 km, and dash-dotted—88 km.
Fig. 7. The WINDII zonal mean temperaturefield at the Equator,±5◦latitude, for December 1992/93 and January 1993/94.
602 M. G. SHEPHERDet al.: WINDII TEMPERATURE TIDES AND PLANETARY WAVES
Fig. 9a. LMSfit to the WINDII temperatures at the Equator,±5◦, for December solstice 1992/93. The experimental data are given in solid circles, while the LMSfit is shown with a solid line. The error bars indicate the geophysical variance of the zonal mean daily averaged data.
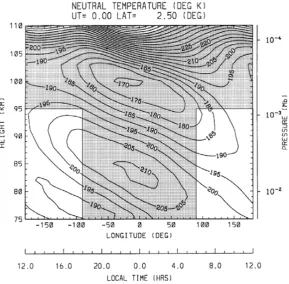
altitude. The agreement in magnitude in the morning sector remains good at lower altitudes and at 75 km both model and observations give temperatures of about 200 K. In the afternoon sector, the WINDII temperatures are comparable in magnitude with the model below 85 km, but above that altitude the WINDII temperatures are colder by 5–6 K than the TIME-GCM results and show a different pattern from the predicted one. There are local similarities in the pattern of the observed and predicted temperaturefield, but again in general the descent of the WINDII temperature variations is smaller than the model predictions.
Since the WINDII mesospheric temperatures are restricted to the height range of 72–95 km, a crude estimate of the ver-tical wavelength of the associated diurnal tidal perturbation is determined as twice the distance between the minimum and the maximum of the temperaturefield, shown in Figs. 6 and 7. For both, the 1992/93 and the 1992/94 datasets, with minima at about 88 km at 0800 hr LT and maxima at 74 km the vertical wavelength is of the order of 26 km. This value is consistent with the vertical wavelength of 25 km of wind diurnal tides, observed both by HRDI (Hayset al., 1994; Burrageet al., 1995) and WINDII (McLandresset al., 1994). The observed wavelengths are in very good agreement with a vertical wavelength of 26 km for the diurnal temperature tide in the mesosphere predicted by the TIME-GCM, shown in Fig. 8 and also reported by Roble and Shepherd (1997),
and Wardet al.(1998). We will return to this discussion later in this section.
In general, zonal averaging will remove any contribu-tion of stacontribu-tionary planetary waves to the zonal mean be-cause the averaging is over an integral number of wave-lengths. For fast moving travelling planetary waves, such as the QTDW such cancellation will not necessarily occur and aliases might contribute to the zonal averages as has been dis-cussed by McLandresset al.(1996) and Forbeset al.(1997), and demonstrated by Wardet al.(1996) (theirfigure 1). As was discussed in Subsection 3.1 QTDW have been identified in the late January data corresponding to the morning sector in Figs. 6 and 7. McLandresset al. (1996) estimated that the QDTW wave contribution to the daily zonal average was 10% of its amplitude. For amplitudes of the order of 7 K to 14 K (for the height range 79–85 km) the contribution from the QTDW aliasing will be of about 1 K and will be well within the accuracy of the temperature data used to derive the zonal averages.
Fig. 9b. The same as in Fig. 9a, but for December solstice 1992/94.
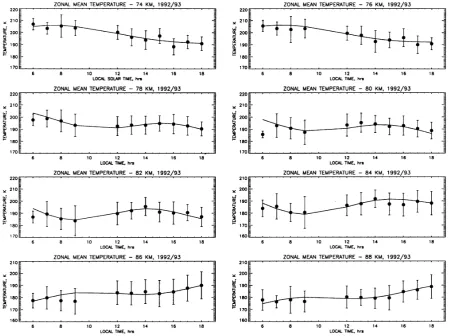
As was mentioned earlier, the temperature data are binned onto LT bins of 1 hr and an LMSfit is done for a given latitude range, each day of observation and each altitude bin to the following equation:
T =T0+ADTcos(2πωDT(t−t0DT))
+BSTcos(2πωST(t−t0ST)), (2)
wheretis the local time (hr),ωis the frequency (=0.042 hr−1 and 0.083 hr−1for diurnal (DT) and semidiurnal (ST) tide, respectively). The ADT,BST,t0DT andt0ST are the constants solved for in the LMSfitting process giving the amplitude and the phase of the diurnal (DT) and semidiurnal (ST) tide, while
T0 is the mean temperaturefield. This is“simple binning” (McLandress et al., 1996) since no effort has been made to remove the mean from the tides before sorting the daily zonal averages in local time. As McLandresset al.(1996) have shown this method is most suitable for discontinuous
data coverage like the data employed in the current analysis. Since the data are only from daytime observations, with an LT coverage of 9–12 hr between 35◦S and 25◦N latitude,
fitting them directly with the above expression can give am-biguous results. Crary and Forbes (1982) demonstrated that such a time range is insufficient for reliable separation of the diurnal and semidiurnal components and the daily mean. Since the WINDII data are binned in 1 hour bins according to these authors the minimum criterion for reliability of the diurnal tidefit is to have a standard deviation that is less than 3 times the standard deviation of the original data. However, Burrage et al.(1995) demonstrated that in spite of the LT limitations of the daytime sampling it is possible to estimate diurnal tidal amplitude and phase, since monthly mean
combina-604 M. G. SHEPHERDet al.: WINDII TEMPERATURE TIDES AND PLANETARY WAVES
Fig. 10a. The diurnal-tide temperature amplitudes for December 1992/January 1993.
tion trials for the mean temperature and the tidal amplitudes and phases, the bestfit to the experimental data was obtained. The results from the LMSfit to the WINDII temperature data at altitudes ranging from 74 to 90 km for a latitude band of ±5◦ around the equator for December solstice 1992/93 are given in Fig. 9a. The experimental temperatures are given with dots, while the LMS fit for diurnal and semidiurnal tides are given with a solid line. The error bars indicate the geophysical variance (the standard deviation) of the zonally averaged daily mean temperatures for given latitude bin and a LT range from 6 hr to 18 hr. Although a significant amount of variation was observed from orbit to orbit which may be caused by longitudinally varying planetary-scale disturbance (Shepherdet al., 1993b) more often than not a distinct sim-ilarity in the shape of the temperature profiles was observed (not shown here for brevity), in particular for the 15◦N to 25◦S latitudinal bins. This underlying structure is suggestive of the presence of the migrating solar tides and the back-ground mean temperature field and is in concert with the pattern shown in Figs. 6 and 7. Although in general the LMS
fit to the daily zonal mean temperatures is rather good, one should bear in mind that at altitudes above about 90 km the quality of the WINDII data decreases in relation to the de-crease of the SNR and the determined amplitudes and phases could be erroneous. Therefore although there are tempera-ture data up to 95 km we have chosen to discuss results only below 90 km altitude. Figure 9b presents the results of the LMSfitting of the 1992/1994 combined datasets at the equa-tor along with the standard deviations of the experimental data for the altitude range from 72 km to 90 km. In view of the above discussion the tidal parameters obtained in the analysis will be compared with other independent results to establish their acceptability.
Due to the WINDII viewing geometry and the position of the terminator the number of LT samples at latitudes
greater than 25◦N was not sufficient to extract meaningful information on either the diurnal or semidiurnal tides and so data above this latitude are not shown or discussed herein. Figure 10 gives the latitudinal pattern of the diurnal tidal am-plitudes obtained according to the WINDII observations at altitudes from 74 km to 90 km, for December solstice 1992/93 and for the composite 1992/94 data in the height range 72 km to 90 km. The(1,1)diurnal-tide amplitude of the temper-ature has a maximum at the equator with a value of 5–6 K, decreasing towards subtropical latitudes (±20◦). Such pat-tern in the experimental data is consistent with the Hough function for the diurnal temperature tide. In addition, the contours suggest a tilt southward, increasing with height to about 83–85 km, which then reverses to northward at higher latitudes. The tidal amplitude is somewhat asymmetric about the equator. As in the case of wind diurnal tides (Hayset al., 1994, McLandresset al., 1996) this may be due to changes in the mean winds and temperature gradients giving rise to higher-order modes other than the classical (1,1)diurnal tide. An indication of such changes will be seen in the corre-sponding phases shown in Fig. 11. As was discussed earlier, McLandresset al.(1996) and Forbeset al.(1997) suggested that the correct determination of the tidal amplitude could be affected by the presence of a QTDW perturbation if the tidal amplitude is less than 10% that of the QTDW. Com-paring the tidal and QTDW temperature amplitudes obtained in the analysis shows that the tidal amplitude is 50% of the QTDW amplitude and thus is not distorted significantly by the QTDW perturbation.
Fig. 10b. The diurnal-tide temperature amplitudes for December 1992/93 and January 1993/94.
appearing at altitudes above 85 km and an amplitude compa-rable to that at the equator. The general pattern is similar to the composite daily zonal mean neutral temperatures given in Fig. 7, for the 16–18 hr LT range. The temperatures in this LT range are from December 24–31 period and are mostly from the 1993/94 dataset.
Differences between the tidal structures in the 1992–93 and 1993–94 wind data were observed and discussed by Burrageet al.(1995) and Yudinet al.(1997). Applying root-mean-square (rms) wind analysis Yudinet al.(1997) found that the 1992–93 monthly mean composites have similar pat-terns and locations of the tidal-wind energy concentration. The 1993–94 wind rms showed a much weaker concentra-tion of kinetic energy in the lower latitudinal MLT region. Such attenuation of the(1,1)-mode diurnal amplitudes after September 1993 have been previously reported by Burrage
et al.(1995). More recent analysis by Zhanget al.(1998) of the tidal structure variation of O(1S) volume emission rates observed by the WINDII over the period 1992–1996 have also shown a decrease in the tidal amplitude at low lat-itudes over these years. Although those observations are not linearly related to the neutral temperature in the middle at-mosphere/lower thermosphere (MLT) region it is reasonable to assume that the temperature structure should also experi-ence variations consistent to those observed in the wind and emission ratefield.
Figure 11a shows the phase (LT of amplitude maximum) for the diurnal tide obtained from the LMSfit to the 1992/93 temperatures. The phases are presented for 10◦ bins from 35◦S to 25◦N. At all latitudes considered the diurnal tide exhibits a systematic downward phase progression with lati-tude. It has been suggested (Hayset al., 1994) that latitudinal changes in the phase indicate the presence of more than one Hough mode. At the equator (±5◦) the diurnal phase has
606 M. G. SHEPHERDet al.: WINDII TEMPERATURE TIDES AND PLANETARY WAVES
Fig. 11a. The diurnal-tide phases of the WINDII temperatures for December 1992/January 1993.
in LT decreases (as in the case at 15◦N–25◦N) or the dif-ference between the ascending and descending part of the orbits is less than 12 hr the uncertainty in the derived tidal parameters increases significantly in agreement with the re-sults presented by Crary and Forbes (1982).
Burrageet al.(1995) studied seasonal variations of wind semidiurnal tides and found that they are stronger at solstice than at equinox, opposite to the diurnal tides which maximize at equinox and are much smaller at solstice. Shepherdet al. (1998) reached the same conclusion from the analysis of the WINDII meridional winds. Our analysis shows that the semidiurnal tidal amplitudes are larger in magnitude that the diurnal ones with a maximum at about 20◦S. At the equator the amplitudes are comparable (∼5–6 K). However, it has been pointed out (Hays et al., 1994; Burrageet al., 1995) that LMSfitting of daytime wind data cannot provide reliable estimate of the semidiurnal tidal parameters and this discussion of our semidiurnal results is outside the scope of this report.
According to Ward (1998), the temperature oscillations at a given height are dependent on the form of the background temperature profile at that height. Thus comparisons of tem-perature amplitudes between different datasets and between models and experimental data must take account of differ-ences in the background temperature profiles for appropriate comparisons to be conducted.
Since mean temperaturefields using the same dataset were
Fig. 11b. The same as in Fig. 11a, but for December 1992/93 and January 1993/94.
obtained. With all this in mind we consider the LMS results for the mean temperature QTDW and tidal fields to be in acceptable agreement.
To test further the results from the LMSfit to the WINDII temperatures, the WINDII diurnal amplitudes given in Fig. 10a are compared with predictions for December solstice for January 1993 from the TIME-GCM model, shown in Fig. 13 as an unshaded rectangle. There is an agreement in the mag-nitude of the diurnal-tide amplitude, from the 1992/93 season and the TIME-GCM predictions within the latitude/height range of the observations. A tilt in the maximum/minimum pattern towards the South hemisphere is seen both in the WINDII data and the TIME-GCM predictions. However, more detailed analysis is necessary for better quantitative comparison between the WINDII results and the model pre-dictions.
4.
Discussion
The analysis presented showed that in spite of the lim-ited local time coverage of the WINDII mesospheric tem-peratures (only 10–12 hr) the LMSfit applied to data in the ±15◦latitude range around the equator can provide a real-istic estimate of the diurnal tidal amplitudes and phases of the mesospheric temperature in the height range 72–90 km that is consistent with the classical tidal theory. The magni-tude of the WINDII diurnal amplimagni-tudes is comparable with the TIME-GCM model, but the pattern differs for latitudes
greater than 10◦–15◦ around the equator. Since the TIME-GCM model has been shown to agree with the WINDII O(1S) airglow and wind observations with a full 24 hr LT coverage (Roble and Shepherd, 1997; Shepherdet al., 1998) and since the WINDII temperatures are derived from the Rayleigh scat-tering measurements from the O(1S) backgroundfilter, we consider the reasonable agreement in the±15◦latitude range to be in support of the potential consistency between the WINDII mesospheric temperatures and meridional winds at those latitudes.
All temperature tidal results presented here are for Decem-ber solstice conditions, when the diurnal tidal amplitudes are very weak and can be affected by other Hough modes as was illustrated by the derived diurnal phases. A further test of the method and results presented so far will be an anal-ysis and comparison of the WINDII mesospheric tempera-tures with model predictions and other experimental data for spring equinox, which is currently under way.
5.
Conclusions
We have presented observations of the mean temperature, quasi-two-day wave and diurnal tides from the upper meso-sphere for December solstice, during December 1992/1993 and January 1993/1994, observed by WINDII.
determina-608 M. G. SHEPHERDet al.: WINDII TEMPERATURE TIDES AND PLANETARY WAVES
Fig. 12a. WINDII mean temperaturefield for December 1992/January 1993—a LMSfit to the WINDII temperatures.
Fig. 12b. WINDII mean temperaturefield for December 1992/93 and January 1993/94—a LMSfit to the WINDII temperatures.
tion of planetary wave and tidal structures, which character-istics are in good agreement with other independent temper-ature observations and model simulations.
The main results of the work presented are as follows: 1. The planetary wave structures observed are well de-scribed with a quasi two-day wave,n =3. The amplitude, for a latitude range between 20◦S and 40◦S at 85 km where the wave amplitude maximizes, is about 15 K for downleg and 11 K for upleg sampling. It was shown that the WINDII
QTDW amplitudes were in good agreement with QTDW temperature results from the MLS experiment on UARS and the vertical amplitude structure of the QTDW, described by the HRDI wind observations.
2. The temperature variability of the QDTW provides a view of the spatial characteristics of the amplitude and phase of this planetary wave structure which were not published before.
Fig. 13. TIME-GCM diurnal-tide temperature amplitudes for December solstice. The rectangle outlines the latitude/altitude range (unshaded) for a comparison with the WINDII diurnal tide amplitudes from Fig. 10a.
WINDII zonal means for the December solstice periods in 1992/93 and 1992/94, examples of which were presented for the equator, is in agreement in magnitude (within 4–6 K in the height range 75–95 km), with the predictions of the TIME-GCM model, although the overall pattern differs somewhat. However, the WINDII data are highly suggestive of a diurnal variation in the temperature on the same order as predicted by the model. The descent of temperature variations with time seen in the model is not clearly evident in the WINDII results.
4. The tidal pattern in the 70–95 km height range is consis-tent with that of the diurnal tide with a vertical wavelength of 20 km for the 1992/93 dataset and of 25 km for the 1992/94 dataset at the equator,±5◦, and at±10◦around the equator. 5. At latitudes greater than 15◦the tidal phase indicated perturbation of semidiurnal type (period of 6–12 hr) and in-ferred vertical wavelength greater than∼40 km.
6. For the 1992/93 data the diurnal-tide amplitudes de-termined for latitudes from 35◦S to 25◦N maximize at the equator with a magnitude of∼6 K (the actual diurnal am-plitudes from the LMSfit at the equator are of the order of 7 K before creating the contour plot) and decrease toward tropical latitudes, consistent with the classical tidal theory and the Hough function for temperature.
7. The mean temperature field for December solstice 1992/93, determined independently both in the tidal and the QTDW analysis, are consistent with each other when com-pared at 25◦S in the height range 79 to 88 km.
Acknowledgments. The WINDII project is jointly sponsored by the Canadian Space Agency and the Centre National d’Etudes Spatiales, France. The authors are grateful for their support, along with NASA, in making this work possible. Support for scientific analysis of the data is provided by the Natural Science and Engi-neering Research Council of Canada. The Centre for Research in Earth and Space Technology (CRESTech) is a designated Centre
of Excellence supported by the Technology Fund of the Province of Ontario. The authors thank Dr. B. H. Solheim for providing the WINDII raw data used in this study. We would also like to thank the referees for their helpful suggestions in the revision of this manuscript.
References
Akmaev, R. A., V. A. Yudin, and D. A. Ortland, SMLTM simulations of the diurnal tide: comparison with UARS observations,Ann. Geophysicae, 15, 1187–1197, 1997.
Burrage, M. D., M. E. Hagan, W. R. Skinner, D. L. Wu, and P. B. Hays, Long-term variability in the solar diurnal tide observed by HRDI and simulated by GSWM,Geophys. Res. Lett.,22, 2641–2644, 1995. Chahine, M., Generalization of the relaxation Method for the Inverse
Solu-tion of Nonlinear and Linear Transfer EquaSolu-tions, inInversion Methods in Atmospheric Remote Sounding, edited by A. Deepak, Academic Press, pp. 67–116, 1977.
Clancy, R. T. and D. W. Rusch, Climatology and trends of mesospheric (58–90 km) temperatures based upon 1982–1986 SME limb scattering profiles,J. Geophys. Res.,94, 3377–3393, 1989.
Clancy, R. T., D. W. Rusch, and M. T. Callan, Temperature minima in the average thermal structure of the middle mesosphere (70–80 km) from analysis of 40- to 92-km SME global temperature profiles,J. Geophys. Res.,99, 19,001–19,020, 1994.
Clark, R. R., A. C. Current, A. H. Manson, C. E. Meek, S. K. Avery, S. E. Palo, and T. Aso, Hemispheric properties of the two-day wave from mesosphere-lower-thermosphere radar observations,J. Atmos. Terr. Phys.,56, 1276–1288, 1994.
Crary, D. J. and J. M. Forbes, On the extraction of tidal information from measurements covering a fraction of a day,Geophys. Res. Lett.,10, 580–
582, 1982.
Dudhia, A., S. E. Smith, A. R. Wood, and F. W. Taylor, Diurnal and semi-diurnal temperature variability of the middle atmosphere, as observed by ISAMS,Geophys. Res. Lett.,20, 1251–1254, 1993.
Forbes, J. M., Atmospheric tides 1. Model description and results of the solar diurnal component,J. Geophys. Res.,87, 5222–5240, 1982. Forbes J. M., Tidal and planetary waves, inThe Upper Mesosphere and
lower thermopshere: A review of experiment and theory, Geophysical Monograph 87, edited by R. M. Johnson and T. L. Killeen, pp. 67–87, AGU, Washington D.C., 1995.
610 M. G. SHEPHERDet al.: WINDII TEMPERATURE TIDES AND PLANETARY WAVES
Hagan, M. E., J. M. Forbes, and F. Vial, Numerical investigations of the propagation of the quasi-two-day wave into the lower thermosphere,J. Geophys. Res.,98, 23,193–23,205, 1993.
Hagan, M. E., J. M. Forbes, and F. Vial, On modeling migrating solar tides, Geophys. Res. Lett.,22, 893–896, 1995.
Hagan, M. E., C. McLandress, and J. M. Forbes, Diurnal tidal variability in the upper mesosphere and the lower thermosphere,Ann. Geophysicae, 15, 1176–1186, 1997.
Harris, T. J., A long-term study of the quasi-two-day wave in the middle atmosphere,J. Atmos. Terr. Phys.,56, 569–579, 1994.
Hays, P. B., D. L. Wu, and the HRDI Science Team, Observations of the diurnal tide from space,Amer. Meteor. Soc.,51, 3077–3093, 1994. Hecht, J. H., R. L. Waltersheid, R. G. Roble, R. S. Lieberman, E. R.
Talaat, S. K. Ramsay Howat, R. P. Lowe, D. N. Turnbull, C. S. Gardner, R. States, and P. D. Dao, A comparison of atmospheric tides inferred from observations at the mesopause during ALOHA-93 with the model predictions of the TIME-GCM,J. Geophys. Res.,103, 6307–6321, 1998.
Hitchman, M. H. and C. B. Leovy, Diurnal tide in the equatorial middle atmosphere as seen in LIMS temperatures,J. Atmos. Sci.,42, 557–561, 1985.
Liebermann, R. S., Nonmigrating diurnal tides in the equatorial middle atmosphere,J. Atmos. Sci.,48, 1112–1123, 1991.
McLandress, C., Y. Rochon, G. G. Shepherd, B. H. Solheim, G. Thuillier, and F. Vial, The meridional wind component of the thermospheric tide observed by WINDII on UARS,Geophys. Res. Lett.,21, 2417–2420, 1994.
McLandress, C., G. G. Shepherd, and B. H. Solheim, Satellite observations of thermospheric tides: Results from the Wind Imaging Interferometer on UARS,J. Geophys. Res.,101, 4093–4114, 1996.
Meek, C. E., A. H. Manson, S. J. Franke, W. Singer, P. Hoffmann, R. R. Clark, T. Tsuda, T. Nakamura, M. Tsutsumi, M. Hagan, D. C. Fritts, J. Isler, and Yu. I. Portnyagin, Global study of northern hemisphere quasi 2-day wave events in the summers of 1992 and 1991,J. Atmos. Terr. Phys., 58, 1401–1412, 1996.
Meyer, C. K., Gravity wave interactions with mesospheric planetary waves: a mechanism for penetration into the Termosphere-Ionosphere System, submitted toJ. Geophys. Res., 1999.
Palo, S. E., M. E. Hagan, C. E. Meek, R. A. Vincent, M. D. Burrage, C. McLandress, S. J. Franke, W. E. Ward, R. R. Clark, P. Hoffmann, R. Johnson, D. Kurschner, A. H. Manson, D. Murphy, T. Nakamura, Yu. I. Portnyagin, J. E. Salah, R. Schminder, W. Singer, T. Tsuda, T. S. Virdi, and Q. Zhou, An intercomparison between the GSWM, UARS, and ground based radar observations: a case-study in January 1993,Ann. Geophysicae,15, 1123–1141, 1997.
Reber, C. A., C. E. Trevathan, R. J. McNeal, and M. R. Luther, Upper Atmosphere Research Satellite (UARS) mission,J. Geophys. Res.,98, 10,643–10,647, 1993.
Roble, R. G. and E. C. Ridley, A thermosphere-ionosphere-mesosphere electrodynamics general circulation model (TIME-GCM): Equinox solar cycle minimum simulations (30–500 km),Geophys. Res. Lett.,21, 417–
420, 1994.
Roble, R. G. and G. G. Shepherd, An analysis of wind imaging interfer-ometer observations of O(1S) equatorial emission rates using the thermo-sphere-ionosphere-mesosphere-electrodynamics general circulation model,J. Geophys. Res.,102, 2467–2474, 1997.
Rodger, C. D. and A. J. Prata, Evidence for a travelling two-day wave in the middle atmosphere,J. Geophys. Res.,86, 9661–9664, 1981.
Shepherd, G. G., G. Thuillier, W. A. Gault, B. H. Solheim, C. Hersom, J. M. Alunni, J.-F. Brun, S. Brune, P. Charlot, L. L. Cogger, D.-L. Desaulnier, W. F. E. Evans, R. L. Gattinger, F. Girod, D. Harvie, R. H. Hum, D. J. W. Kendal, E. L. Llewellin, R. P. Lowe, J. Ohrt, F. Pasternako, O. Peilet, I. Powell, Y. Rochon, W. E. Ward, R. H. Wiens, and J. Wimperis, WINDII, the wind imaging interferometer on the Upper Atmosphere Research Satellite,J. Geophys. Res.,98, 10,725–10,750, 1993a.
Shepherd, G. G., G. Thuillier, B. H. Solheim, S. Changra, L. L. Cogger, M. L. Duboin, W. F. J. Evans, R. L. Gattinger, W. A. Gault, M. Herse, A. Hauchecorne, C. Lathuilliere, E. J. Llewellyn, R. P. Lowe, H. Teitelbaum, and F. Vial, Latitudinal structure in atomic oxygen concentrations ob-served with WINDII on UARS,Geophys. Res. Lett., 20, 1303–1306, 1993b.
Shepherd, G. G., R. G. Roble, S.-P. Zhang, C. McLandress, and R. H. Wiens, Tidal influence on midlatitude airglow: Comparison of satellite and ground-based observations with TIME-GCM predictions,J. Geo-phys. Res.,103, 14,741–14,751, 1998.
Shepherd, M. G., A. Dudhia, M. Lopez-Puertas, and W. F. J. Evans, Upper mesosphere temperatures in summer: WINDII observations and compar-isons,Geophys. Res. Lett.,24, 357–360, 1997.
States, R. J. and C. S. Gardner, Influence of the diurnal tide and thermo-spheric heat sources on the formation of mesothermo-spheric temperature inver-sion layers,Geophys. Res. Lett.,25, 1483–1486, 1998.
Twomey, S.,Introduction to the Mathematics of Inversion in Remote Sensing and Indirect Measurements, 243 pp., Development of Geomathematics, 3. Elsevier Scientific Publishing Company, Amsterdam, 1977. Wang, D. Y., C. McLandress, E. L. Fleming, W. E. Ward, B. Solheim, and
G. G. Shepherd, Empirical model of 90–120 km horizontal winds from wind-imaging interferometer green line measurements in 1992–1993,J. Geophys. Res.,24, 1,127–1,130, 1997.
Ward, W. E., Tidal mechanisms of dynamical influence on oxygen recom-bination airglow in the mesosphere and lower thermosphere,Adv. Space Res.,21(6), 795–805, 1998.
Ward, W. E., D. Y. Wang, B. H. Solheim, and G. G. Shepherd, Observations of the two-day wave in WINDII data during January 1993,Geophys. Res. Lett.,23, 2923–2926, 1996.
Ward, W. E., B. H. Solheim, and G. G. Shepherd, Two day wave induced variations in the oxygen green line volume emission rate: WINDII ob-servations,Geophys. Res. Lett.,24, 1127–1130, 1997.
Ward, W. E., J. Oberheide, M. Riese, P. Preusse, and D. Offermann, Tidal signatures in temperature data from the CRISTA I mission,J. Geophys. Res., submitted, June, 1998.
Wiens, R., S.-P. Zhang, R. Peterson, and G. Shepherd, Tides in Emission Rate and Temperature from the O2Nightglow over Bear Lake Observa-tory,Geophys. Res. Lett.,22, 2637–2640, 1995.
Wu, D. L., A study of the diurnal tide and the two-day wave with the High Resolution Doppler Imager (HRDI), Ph.D. Thesis, University of Michigan, 201 pp., 1994.
Wu, D. L., P. B. Hays, W. R. Skinner, A. R. Marshall, M. D. Burrage, R. S. Lieberman, and D. A. Ortland, Observations of the quasi-2-day wave from the High Resolution Doppler Imager on UARS,Geophys. Res. Lett., 20, 2853–2856, 1993.
Wu, D. L., P. B. Hays, and W. R. Skinner, A least squares method for spectral analysis of space-time series,J. Atmos. Sci.,52, 3501–3511, 1995. Wu, D. L., E. F. Fishbein, W. G. Read, and J. W. Waters, Excitation and
evolution of the quasi-2-day wave observed in UARS/MLS temperature measurements,J. Atmos. Sci.,53, 728–738, 1996.
Yu, J., R. States, S. J. Franke, C. S. Gardner, and M. Hagan, Observations of tidal temperature and wind perturbations in the mesopause region above Urbana, IL (40◦N, 88◦W),Geophys. Res. Lett.,24, 1207–1210, 1997. Yudin, V. A., B. V. Khattatov, M. A. Geller, D. A. Ortland, C. McLandress,
and G. G. Shepherd, Thermal tides and studies to tune the mechanistic tidal model using UARS observations,Ann. Geophysicae,15, 1205–1220, 1997.
Zhang, S. P., R. H. Wiens, B. H. Solheim, and G. G. Shepherd, Nightglow zenith emission rate variations in O(1S) at low latitudes from WINDII observations,J. Geophys. Res.,103, 6251–6259, 1998.